15 page speed optimizations that sites ignore (at their own risk)
A recent analysis of twenty leading websites found a surprising number of page speed optimizations that sites are not taking advantage of – to the detriment of their performance metrics, and more importantly, to the detriment of their users and ultimately their business.

I spend a lot of time looking at waterfall charts and web performance audits. I recently investigated the test results for twenty top sites and discovered that many of them are not taking advantage of optimizations – including some fairly easy low-hanging fruit – that could make their pages faster, their users happier, and their businesses more successful.
More on this below, but first, a few important reminders about the impact of page speed on businesses...
Slow pages hurt your business
In user survey after user survey over the past decade or so, site speed has emerged as one of the greatest factors that determine a person's satisfaction with a website (second only to security). Because our "need for speed" is deeply rooted in our neural wiring, it's unlikely to change, no matter how much we wish it could.
In case you have any doubts, countless case studies have proven a consistent and demonstrable correlation between page speed and business and user engagement metrics like conversions, bounce rate, and search rank. Just a few examples:
- Walmart found that every 1 second of improvement equaled a 2% increase in conversion rate.
- Vodafone improved their Largest Contentful Paint (LCP) time by 31%, resulting in an 8% increase in sales, a 15% increase in their lead-to-visit rate, and an 11% increase in their cart-to-visit rate.
- NDTV, one of India's leading news stations and websites, improved LCP by 55% and saw a 50% reduction in bounce rate.
- ALDO found that on their single-page app, mobile users who experienced fast rendering times brought 75% more revenue than average, and 327% more revenue than those experiencing slow rending times. On desktop, users with fast-rendering times brought in 212% more revenue than average and 572% more than slow.
How much faster than your competitors do you need to be?
It's not enough to be fast. You need to be faster than the competition. If you're not, your customers could be quietly drifting away. In a traditional brick-and-mortar scenario, abandoning one store for another takes effort. On the web, it takes a couple of clicks.
The margin for speed is tight. Way back in 2012, Harry Shum (then EVP of Technology and Research at Microsoft) said:
"Two hundred fifty milliseconds, either slower or faster, is close to the magic number now for competitive advantage on the Web."
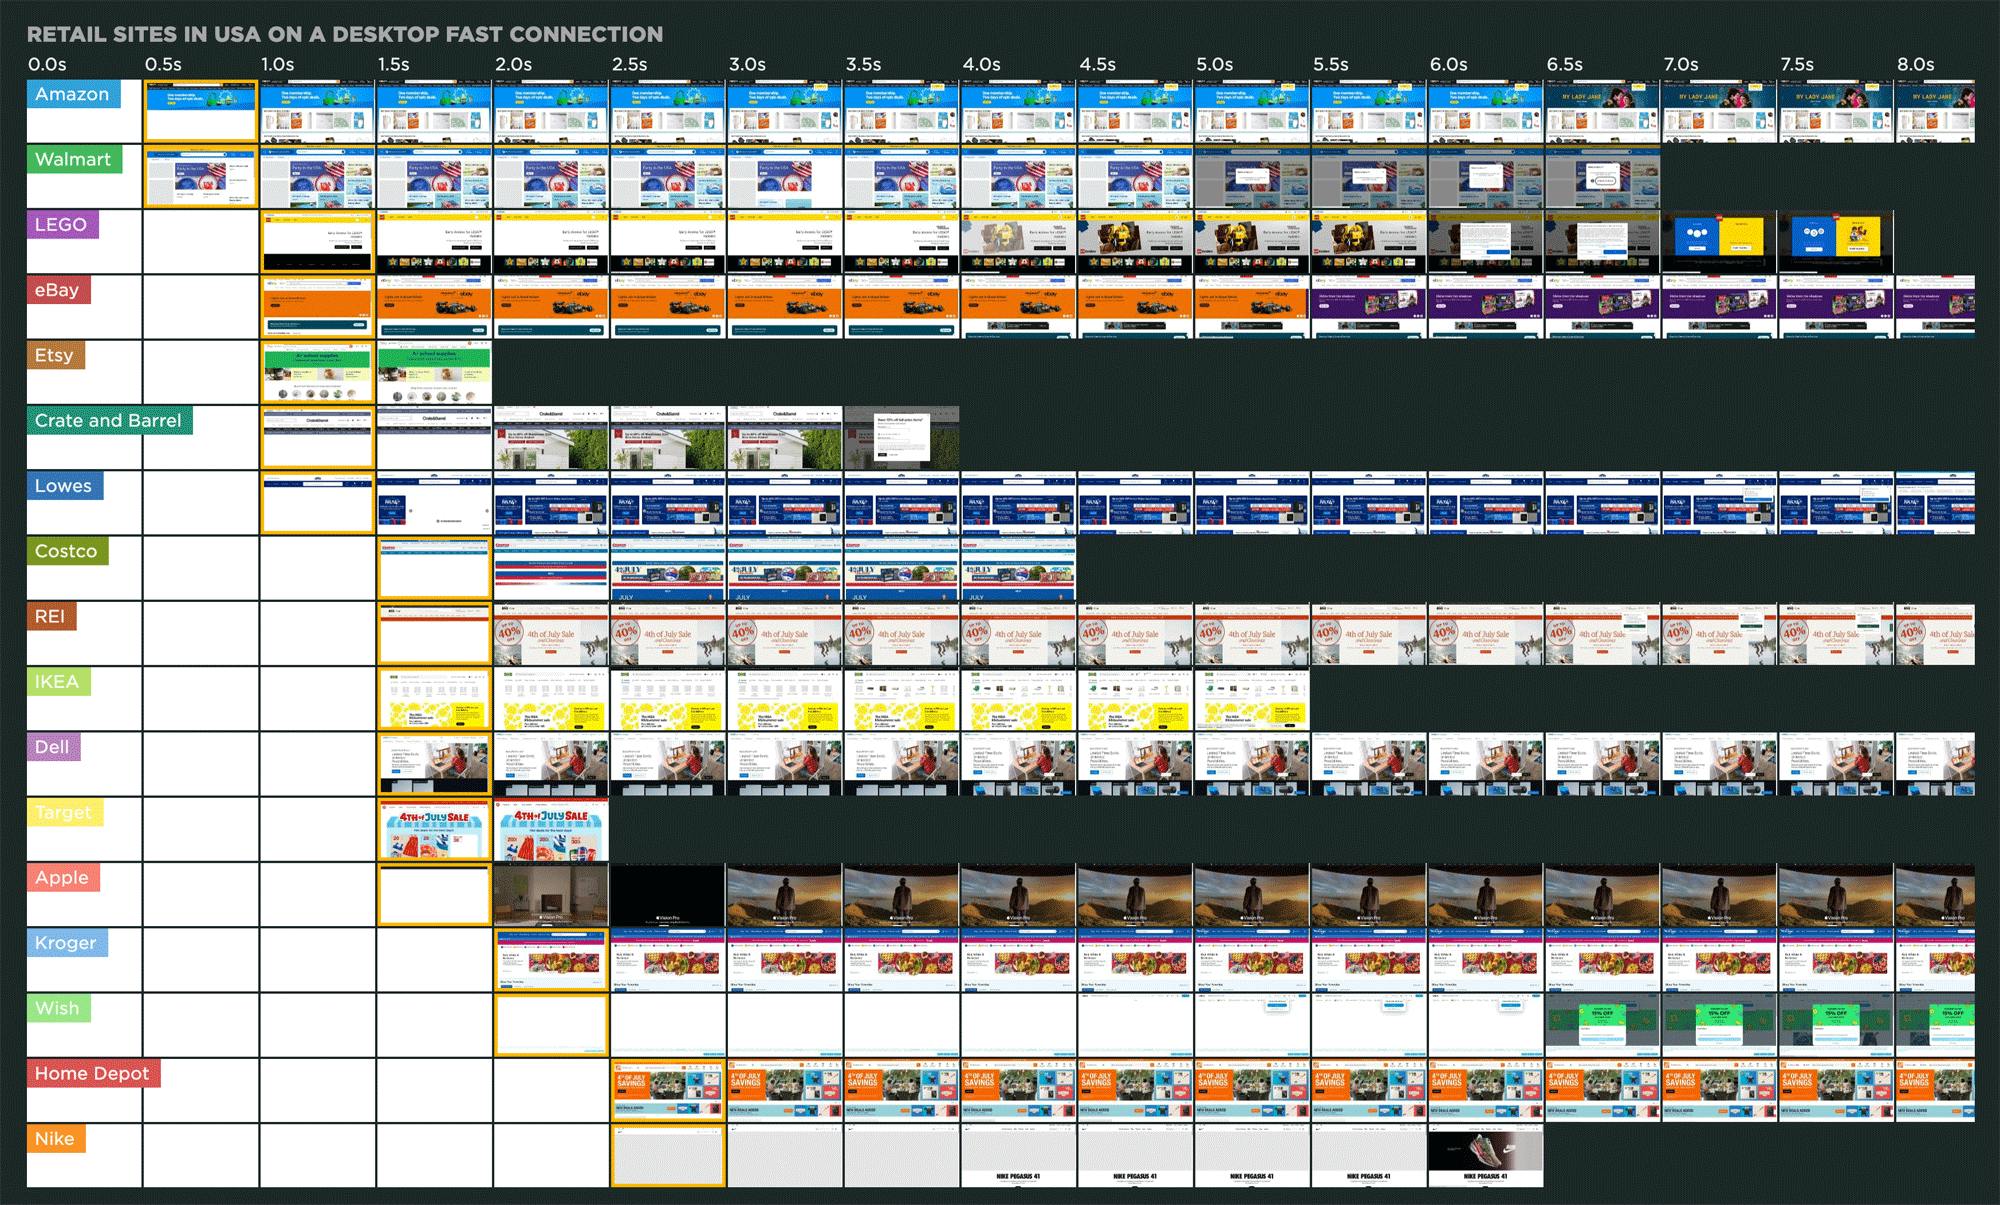
With many synthetic monitoring tools, you can benchmark your site against your competitors. Competitive benchmarking is a great way to see how you stack up – and how much you need to improve.
This is why it's crucial to take advantage of any optimization technique that could help give you a competitive advantage.
US Retail Benchmarks leaderboard
Background: Looking at 20 leading sites
For this investigation:
- I looked at the synthetic test results for twenty randomly selected industry-leading sites, taken from SpeedCurve's Page Speed Benchmarks dashboard.
- I then tallied the pass/fail status for common performance recommendations (AKA performance audits).
Page Speed Benchmarks is an interactive set of dashboards that anyone can explore and use for their own research. Every day we run a synthetic test for the home pages of industry-leading websites and rank them based on how fast their pages appear to load from a user’s perspective. You can filter the dashboard to rank sites based on common web performance metrics, such as Start Render, Largest Contentful Paint, Cumulative Layout Shift, Time to Interactive, and more.
The Benchmarks dashboard also allows you to drill down and get detailed test results for each page, including waterfall charts, Lighthouse scores, and recommended optimizations/audits. Looking at these test details lets you see how the fastest and slowest pages in the dashboards are built – what they're doing right, as well as missed opportunities for optimization.
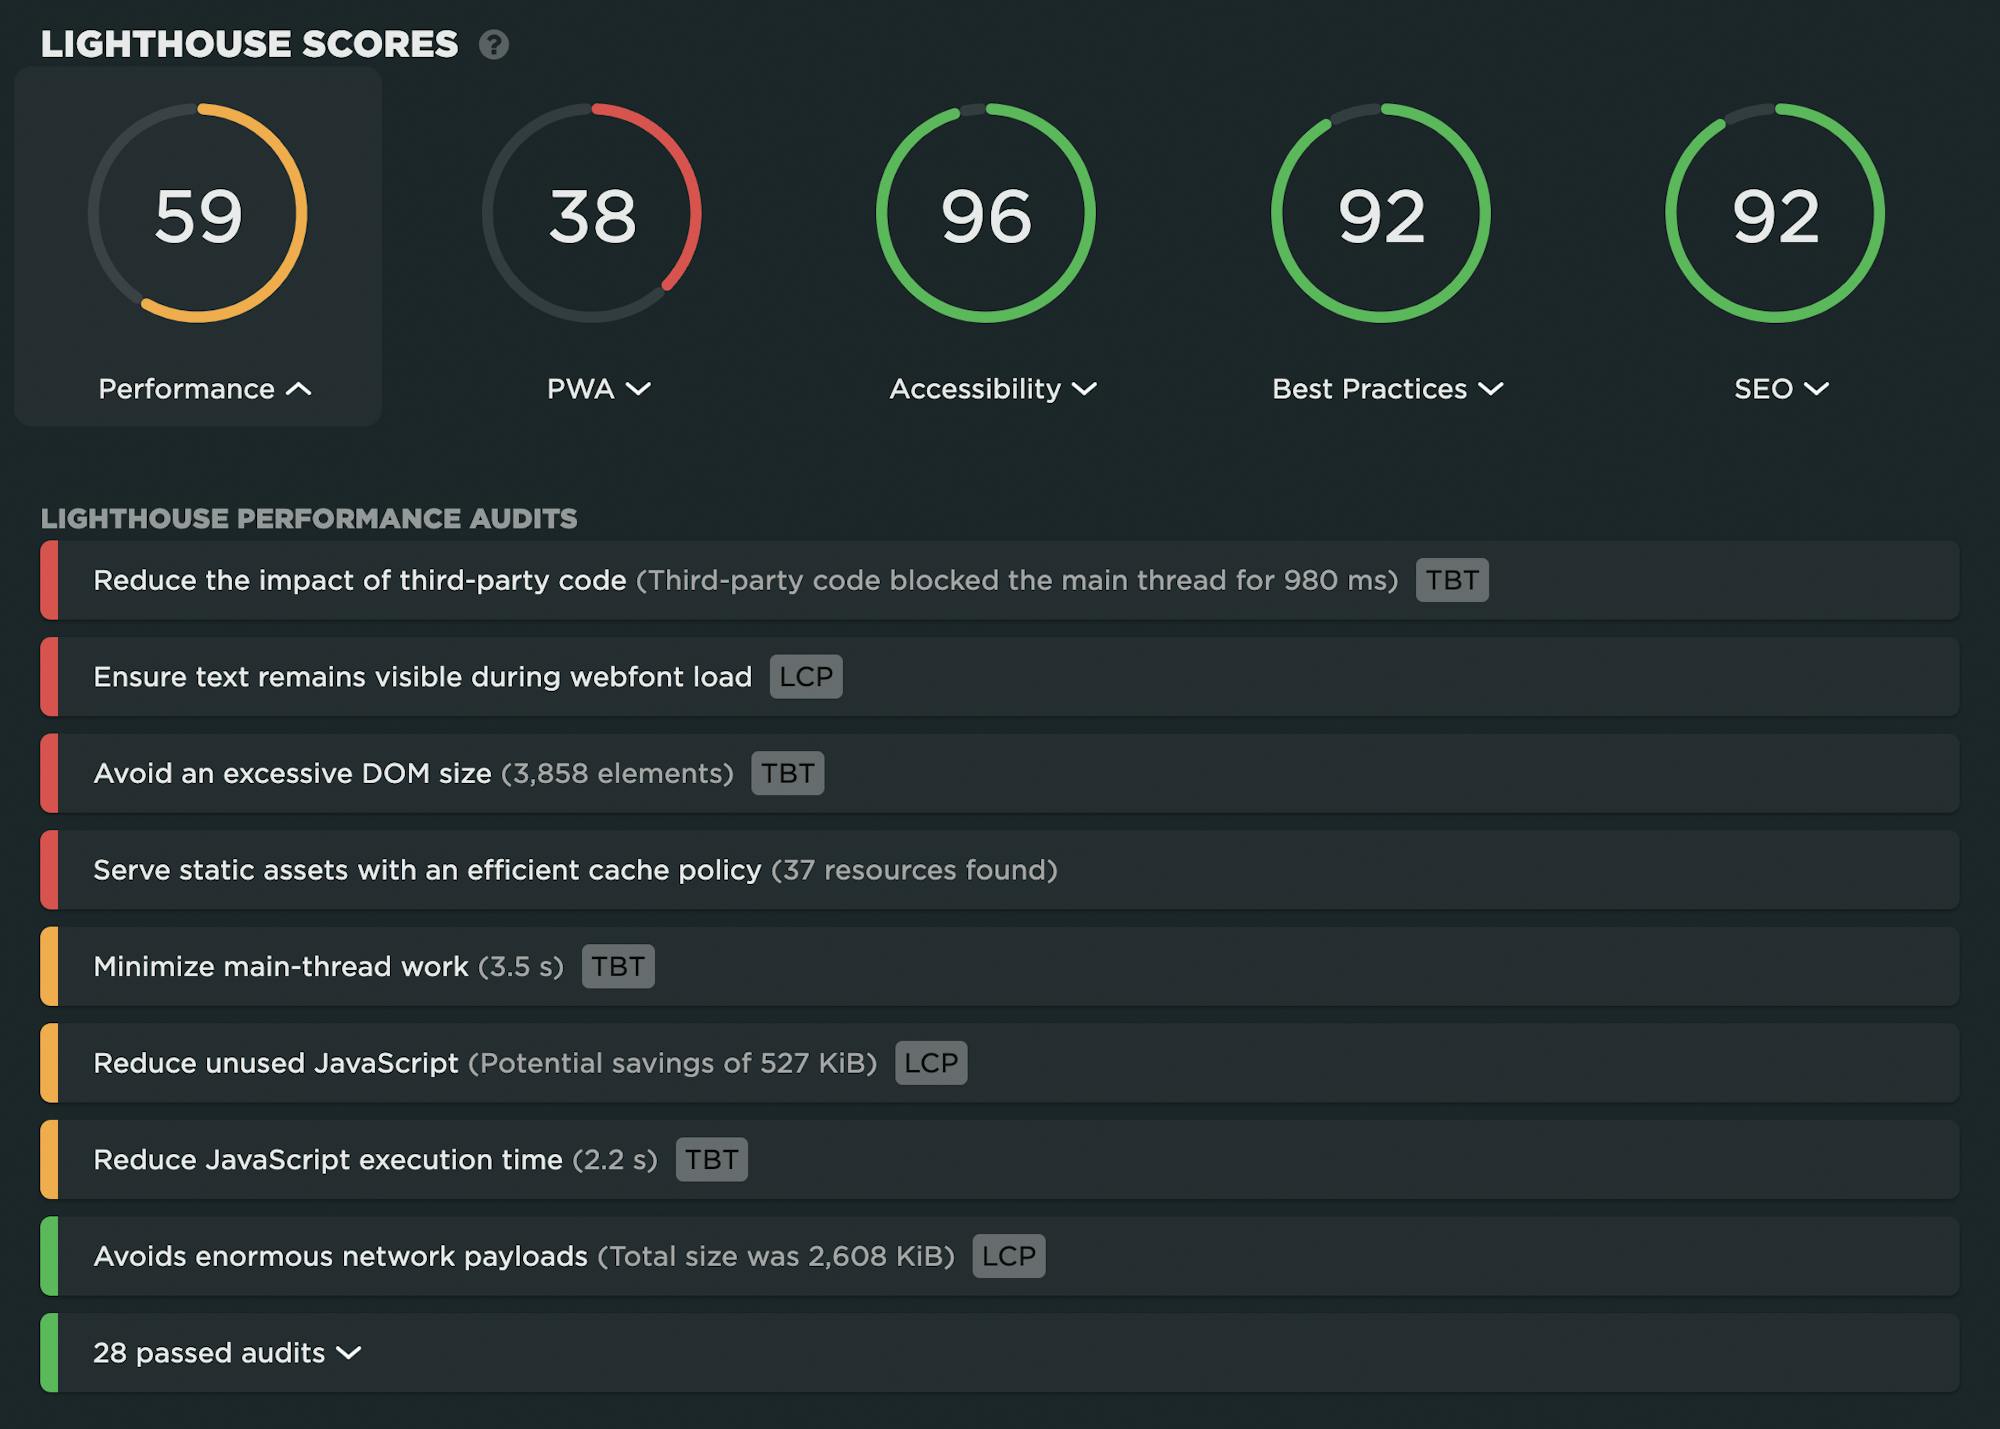
Lighthouse scores and performance audits, taken from this synthetic test result
For the twenty sites I looked at, below are the most common page speed optimizations those sites were not taking advantage of, ranked from least to most implemented.
Serve static assets with an efficient cache policy
Metric(s) affected: Rendering metrics for repeat views
The first time you visit a site, it's likely that your browser won't have any of the resources it needs to load the page already stored in its cache. This is often referred to as a cold cache. This state is very typical for sites that don't get a lot of repeat visitors over a short duration. For many other sites, such as your favourite media or shopping sites, repeat views are very common.
For sites that receive a lot of repeat visitors, taking advantage of the browser cache is a big performance win. Yet only 1 out of the 20 pages I looked at had an efficient cache policy.

Fix: Setting appropriate HTTP headers for page resources is the best way to make sure you are optimally caching content for your site.
Reduce unused JavaScript
Metric(s) affected: Largest Contentful Paint
There's a shocking number of zombie scripts out there, slowly killing performance. Unused JS can hurt your site in a number of ways, from render-blocking scripts that prevent your page from loading to competing with essential JS for bandwidth, especially on mobile and low-powered devices. Only 3 out of 20 sites passed this audit.
Fix: Reduce unused JavaScript and, when possible, defer scripts until they're required.
Page prevented back-forward cache restoration
Metric(s) affected: Rendering metrics for repeat views
Many navigations are performed by going back to a previous page and forward again. Back/forward cache (or bfcache) stores the entire page so that it's available and renders nigh instantaneously. It doesn't require special HTTP headers and is now supported across all major browsers.
For sites that have a lot of back/forward navigations, taking advantage of the bfcache remains one of the biggest opportunities to deliver a page load experience that feels seamless. Yet 16 out of 20 sites did not have bfcache restoration enabled.
Fix: Leverage the browser cache to reduce the number of HTTP requests.
Image elements do not have explicit 'width' and 'height'
Metric(s) affected: Cumulative Layout Shift
Without height and width attributes, your images fly around the page trying to figure out how to resolve and settle down in each individual user's browser. This can really hurt your Cumulative Layout (CLS) score. CLS is a Core Web Vital, which means it's an important factor in Google's search algorithm. The worse your CLS score, the greater risk of hurting your SEO rank.
More to the point, a poor CLS score tells you that your pages feel super janky and unstable. Page jank is an irritant for everyone, but it's a major accessibility problem for people with disabilities that affect fine motor skills.
All this goes to say that it's very surprising to see that 14 out of 20 sites failed this audit.

Fix: Set an explicit width and height on all image and video elements. Alternatively, reserve the required space with CSS aspect-ratio or similar.
Minimize main-thread work
Metric(s) affected: Largest Contentful Paint, Total Blocking Time (to name just a couple)
Geoff Graham provides a good analogy for the browser main thread here:
I’ve heard the main thread described as a highway that gets cars from Point A to Point B; the more cars that are added to the road, the more crowded it gets and the more time it takes for cars to complete their trip. This particular highway has just one lane, and it only goes in one direction. there’s only one way to go, and everything that enters it must go through it... Each resource on a page is a contender vying for a spot on the thread and wants to run first. If one contender takes its sweet time doing its job, then the contenders behind it in line just have to wait.
When you understand how hard all a page's resources are fighting for the main thread, it's easy to understand why minimizing main-thread work is a crucial page speed optimization strategy. It's not uncommon to see pages where main-thread work could be reduced by 8-10 seconds or more! Of the 20 sites I looked at, 13 failed this audit.

Fix: Reduce the time spent parsing, compiling and executing JS. You may find delivering smaller JS payloads helps with this.
Reduce JavaScript execution time
Metric(s) affected: Interaction to Next Paint, Total Blocking Time
JavaScript is, by default, parser blocking. That means that when the browser finds a JavaScript resource, it needs to stop parsing the HTML until it has downloaded, parsed, compiled, and executed that JavaScript. Only after all of that is done can it continue to look through the rest of the HTML and start to request other resources and get on its way to displaying the page.
For the 20 sites I looked at, there was a 50/50 pass/fail rate for this audit.
Fix: There are several things you can do, including minification and compression, serving JS asynchronously (or deferring it), avoiding layout thrashing, and yielding to the main thread. The most radical solution: wherever possible, don't use JavaScript!
Avoid enormous network payloads (AKA page size)
Metric(s) affected: Largest Contentful Paint
I've stopped being shocked when I see pages that are upwards of 10, 20, and even 30 MB in size. Large network payloads can cost users real money and are highly correlated to slow load times. The main culprits: huge image and video files, along with unoptimized JavaScript.
If a page is greater than 5,000 KB in size, then it fails this audit. Of the 20 sites I looked at, 9 failed – meaning they were larger than 5,000 KB.

Fix: Reduce payload size. For first views, you can optimize resources like images and videos to be as small as possible. For repeat views, leverage the browser cache as recommended earlier in this post.
Serve images in next-gen formats
Metric(s) affected: Start Render, Largest Contentful Paint
Image formats like WebP and AVIF often provide better compression than PNG or JPEG, which means faster downloads and less data consumption. 11 out of 20 sites passed this audit.

Fix: Explore alternative image formats. AVIF is supported in Chrome, Firefox, and Opera and offers smaller file sizes compared to other formats with the same quality settings. WebP is supported in the latest versions of Chrome, Firefox, Safari, Edge, and Opera and provides better lossy and lossless compression for images on the web.
Ensure text remains visible during webfont load
Metric(s) affected: Start Render, Largest Contentful Paint
Some web fonts can be large resources, which means they render slowly. Because fonts are often one of the first resources to be called by the browser, a slow font can relay all your downstream metrics. And depending on the browser, the text might be completely hidden until the font loads. The resulting flash of invisible text (FOIT) is a UX annoyance.
Despite all those very good reasons to optimize font rendering, 7 out of 20 sites failed this audit.
Fix: Leverage the font-display CSS feature to ensure text is visible to users while web fonts are loading.
Reduce the impact of third-party code
Metric(s) affected: Total Blocking Time, Largest Contentful Paint, Interaction to Next Paint
These days, a typical web page can contain dozens of third-party scripts. All that extra code – which you don't have much control over – can significantly affect the speed of your pages. A single non-performant blocking script can completely prevent your page from rendering. The good news is that only 4 out of 20 sites failed this audit (though that number is still too high).
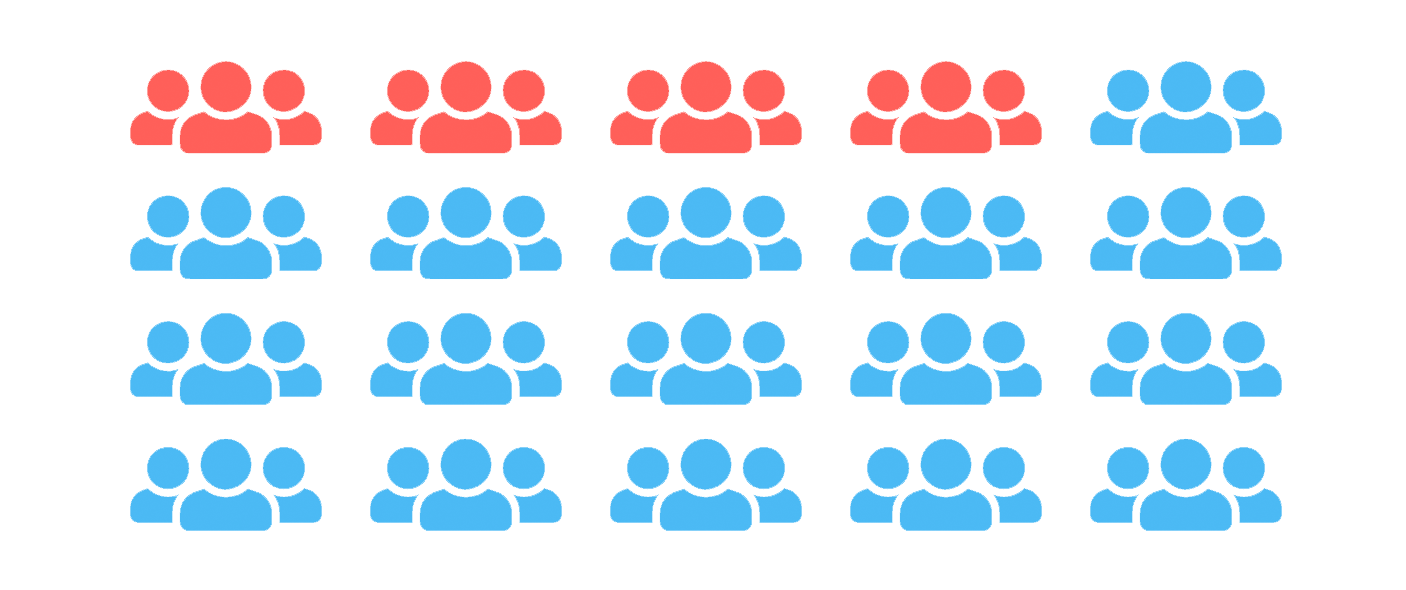
Fix: While you can't always do much about your third-party vendors, you still have a number of options available, including limiting the number of redundant third-party providers and loading third-party code after your page has primarily finished loading.
Reduce unused CSS
Metrics affected: Start Render, Total Blocking Time, Largest Contentful Paint
By default, the browser has to download, parse, and process all stylesheets before it can display any content. Like unused JavaScript, unused CSS clutters your pages, creates extra network trips, unnecessarily adds to your total payload, and ultimately slows down user-perceived performance. Decluttering your pages pays off, yet 4 out of 20 sites failed this audit.
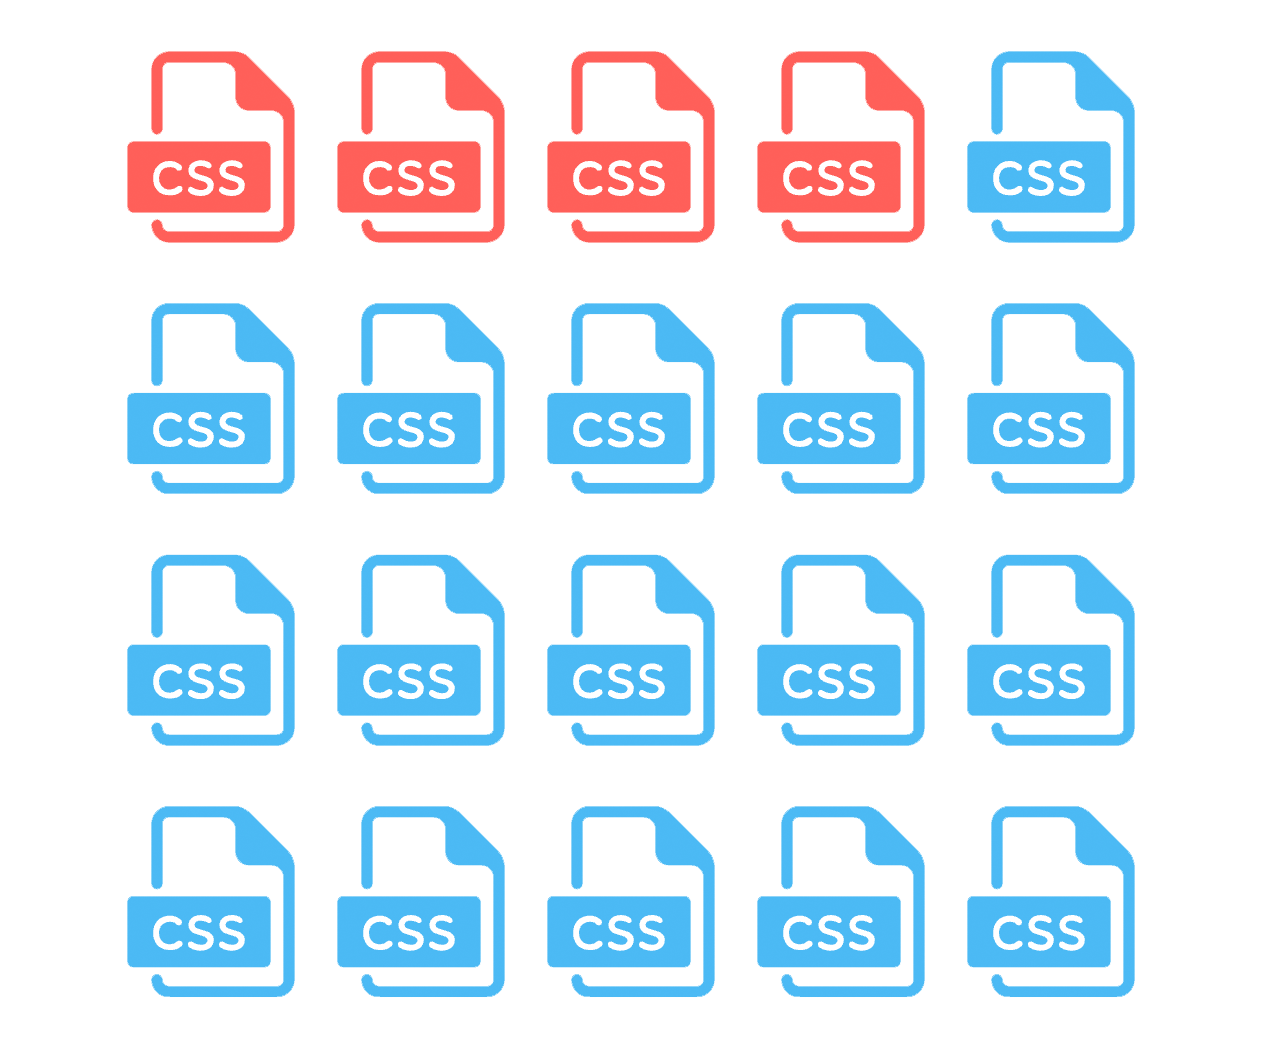
Fix: Reduce unused rules from stylesheets and defer CSS not used for above-the-fold content. Use critical CSS for faster rendering.
Avoid 'document.write()'
Metric(s) affected: Start Render and other downstream metrics
For users on slow connections, external scripts dynamically injected via document.write() can delay page load by tens of seconds. That's a lot!

Fix: Remove all uses of document.write() from your code. If it's being used to inject third-party scripts, use asynchronous loading instead.
Eliminate render-blocking resources
Metric(s) affected: Start Render, Largest Contentful Paint, and other downstream metrics
A blocking resource is any resource that blocks the first paint of your page. Anything that has the potential to block your page completely is concerning, right? Yet 3 out of 20 sites failed this audit.

Fix: Eliminate render-blocking scripts. Assess your blocking resources to make sure they're actually critical and then serve the legitimately critical scripts inline. Serve non-critical code asynchronously or defer it. Remove unused code completely.
Use HTTP/2
HTTP/2 offers many benefits over HTTP/1.1, including binary headers and multiplexing. What this means: your page's resources are leaner and faster. Most sites I looked at are already leveraging HTTP/2, but there were still a couple of holdouts.
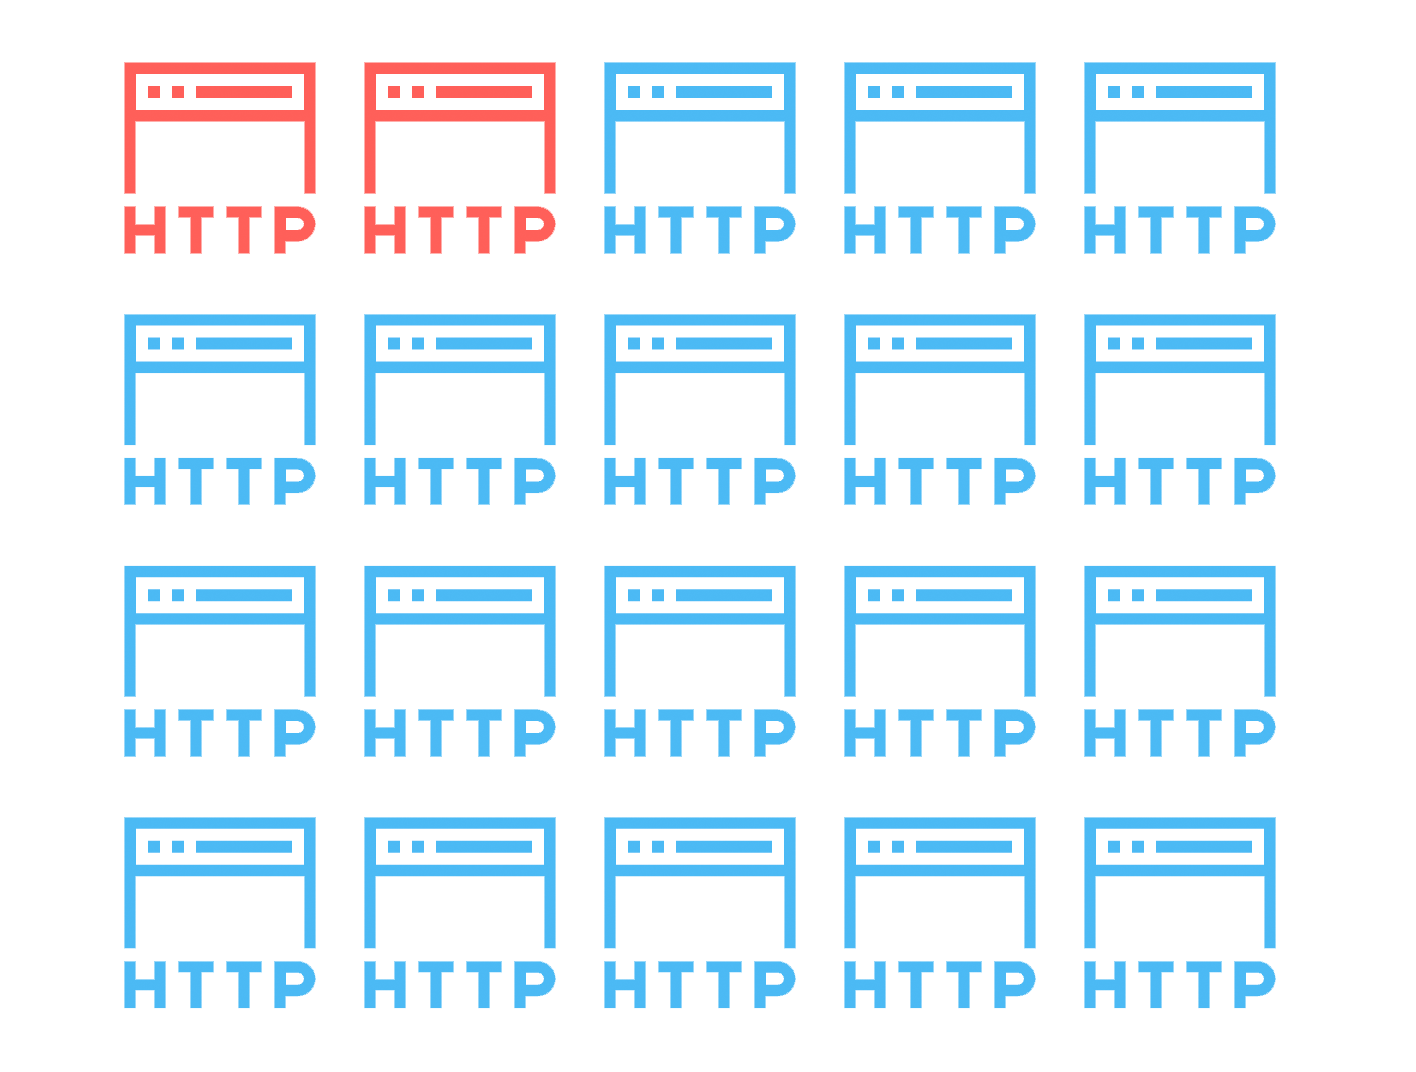
Fix: Learn how to set up HTTP/2.
Do NOT lazy load the LCP image
Metric(s) affected: Largest Contentful Paint
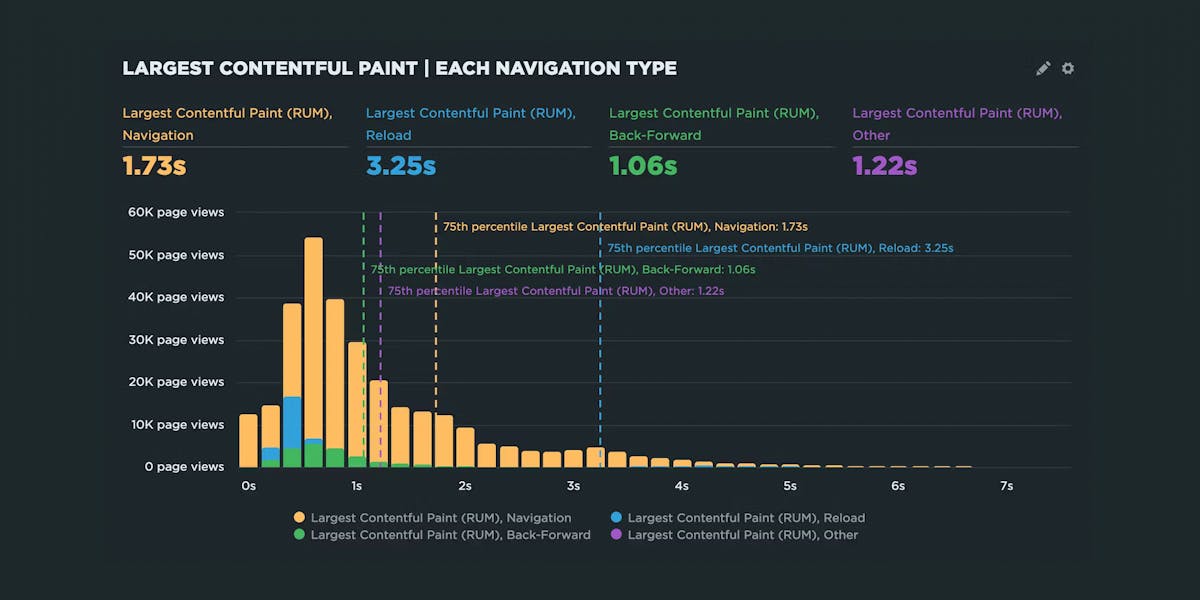
Yikes! I don't see this issue often, but I'm still surprised every time I do. Images that are lazy loaded render later in the page lifecyle. Lazy loading is a great page speed optimization technique for non-critical images, such as those that are lower down on the page. But it's a huge problem if you're lazy loading your Largest Contentful Paint (LCP) image. This can add many seconds to your LCP time. (I've seen LCP times of up to 20 seconds – caused by lazy loading!)
LCP is a Core Web Vital, which means it's a user experience signal in Google's search algorithm. The worse your LCP time, the greater risk of hurting your SEO rank. Just as important, slow images hurt the user experience, and ultimately conversions and bounce rate for your site. Seeing that 2 out of 20 sites failed this audit broke me a little. I hope this post helps you avoid this mistake!

Fix: The LCP image should never be lazy loaded. In fact, the LCP image should be prioritized to render as early in the page lifecycle as possible. If the LCP element is dynamically added to the page, you should preload the image. Get more LCP optimization tips.
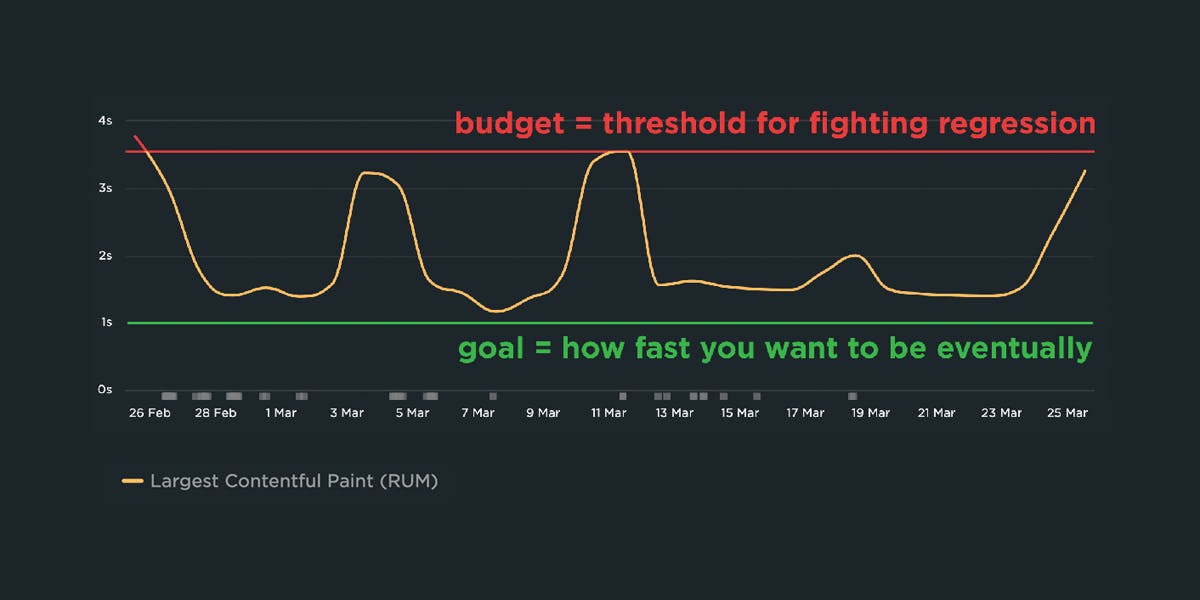
You should also create a performance budget for LCP, so you get alerted right away if it suddenly degrades.
Why are so many recommendations neglected?
There are a few reasons I can think of off the top of my head:
Some optimizations may not affect the critical rendering path
The critical rendering path is the set of steps a browser takes to convert all a page's resources – from images and HTML to CSS and JavaScript – into a complete, functional web page. Optimizing the critical rendering path means taking a good look at the order in which the resources on your pages render, and then making sure that each resource in the rendering path is as performant as possible. It sounds simple – and conceptually it is – yet it can be tricky to achieve (as this performance audit of LEGO.com reveals).
Depending on how a page is built, the critical rendering path might be well optimized, even disregarding some of the optimizations listed above. For example, a page might contain render-blocking first- and third-party JavaScript – such as ads and beacons – but if these scripts are called later in the pages rendering life cycle, then they probably won't affect the user experience.
Some optimizations may be harder (or impossible) to implement
If your page has a massive payload, there might not be much you can do about it. News sites, for example, typically have huge pages because they're required to contain a ton of ads and widgets in addition to their huge content payload of images and videos.
And speaking of images, serving them in next-gen formats (e.g., AVIF instead of JPEG) can be challenging if you have a large number of content creators uploading images to your CMS.
People just don't know
Some practices – such as leveraging the bfcache – are so new that they might not be on people's radar. Others – such as knowing not to lazy load the LCP image – are probably because people are too broadly applying a generally good best practice like lazy loading.
But still...
Many of the sites I looked at are pretty fast, despite not following web performance optimization best practices religiously. But that doesn't mean ignoring best practices is... well, good practice.
- Page size and complexity affects users at the 95th percentile – including mobile users and people using slower networks. Ignoring 5% (or more) of your users is a bad idea.
- Bad practices pile up until there's a tipping point. After that, all it takes is one unoptimized image or non-performant script to seriously hurt your page.
- Zombie third parties can introduce security issues. You should always understand why a third-party script is on your pages and eliminate the ones that don't belong there.
- Page jank is a thing. It's not enough to have a fast Start Render or Largest Contentful Paint time. Your critical rendering path might be short and sweet, and your pages might start to render reasonably quickly, but what about the user experience during the entire rendering lifecycle of the page? Everyone hates jank, and too much of it hurts your UX and your business.
How to prioritize page speed optimizations
1. Consider how many pages on your site are affected by each optimization recommendation
Run some synthetic tests on your key pages and see which optimizations are recommended. If you're a SpeedCurve user, you can use your Improve dashboard to see how many pages on your site are affected by each audit. If a large number of your pages would benefit from an optimization, then you may want to take the approach of tackling improvements one audit at a time.
2. Validate that an optimization will help your page and UX in a measurable way
You don't want to spend a lot of developer time implementing an optimization that won't ultimately benefit your users. Understanding the critical rendering path for your pages is the best way to know if optimizing a resource will make a difference in how the page feels from an end-user perspective.
3. Grab the easy fixes first
Sometimes it's easier to get yourself – and other folks – in your organization excited about performance fixes is to score some easy wins early on. Later, you can work your way up to the more time-consuming ones.
Some easy(ish) recommendations:
- Tweaking your cache policy
- Enabling bfcache
- Setting height and width attributes on images
- Optimizing image and video sizes
- Serving third parties asynchronously or deferring them
Start somewhere and keep moving
If you've tested your pages and get a long list of recommended fixes, it can be a bit overwhelming – and more than a bit demoralizing. Start with the small, easy wins first. Speeding up your pages doesn't (usually) happen overnight. The important thing is to show up, do the work, and always be monitoring. Remember: you can't fix what you don't measure!

