Annotate your graphs

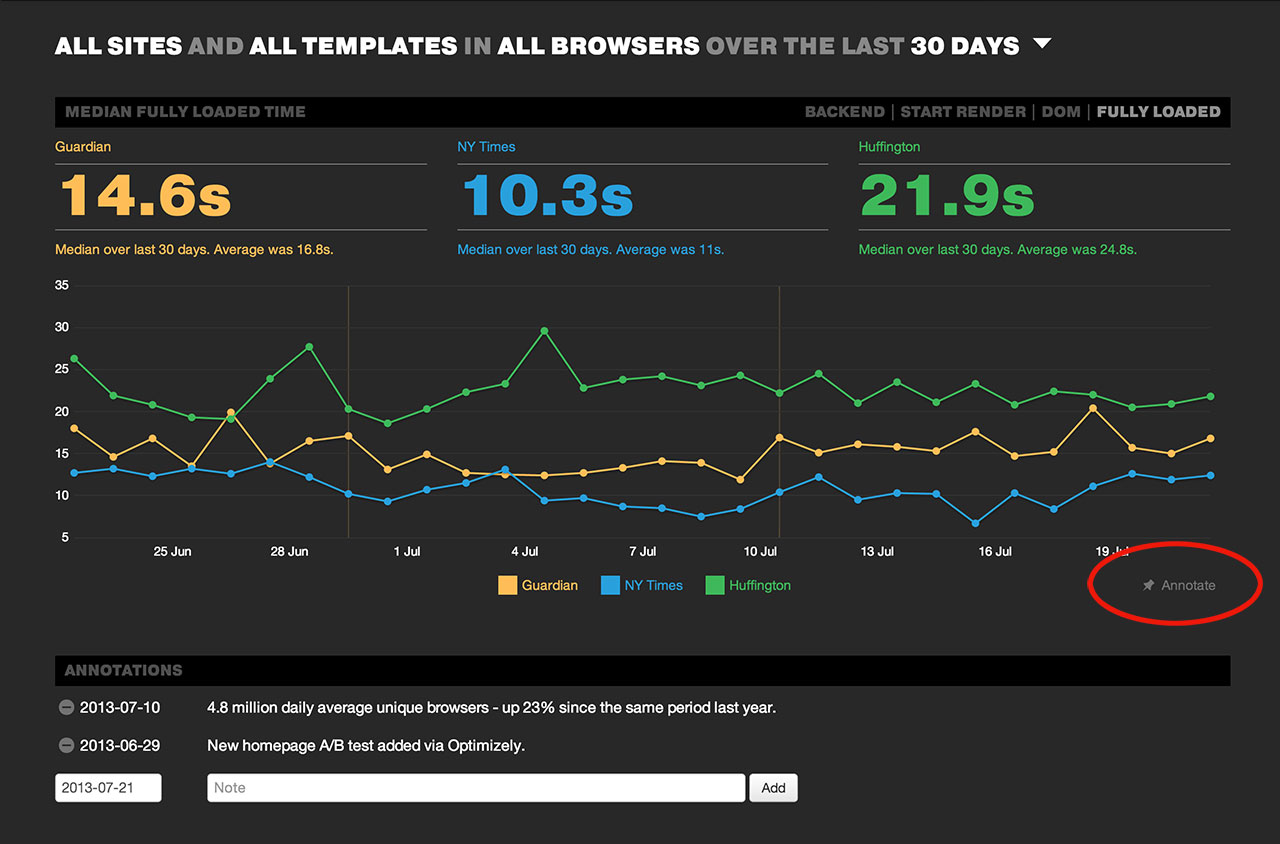
You can now annotate the main graph on SpeedCurve with notes about deployments or specific performance optimizations you may have put live. Just click on the "Annotate" link at the bottom right of the main graph to start adding them and comparing the before and after performance of your website. A vertical line will be placed on the graph where ever a note has been added.