Critical Blocking Resources

At SpeedCurve, we focus on metrics that capture the user experience. A big part of the user experience is when content actually appears in front of the user. Since stylesheets and synchronous scripts are the culprits when it comes to blocking rendering, we've rolled out some new metrics that focus on these critical blocking resources.
The most helpful innovation we made is to highlight the critical blocking stylesheets and synchronous scripts in our waterfall charts. In the following example waterfall chart for ESPN, notice how the critical stylesheets (green) and synchronous scripts (orange) have a red hash pattern. Not surprisingly, the Start Render metric is delayed until after the last of these critical blocking resources is done loading. The "scrubber" at the bottom of the waterfall (showing the screenshot at that point in time) confirms that rendering has been blocked up to this point. Explore an example of a interactive waterfall chart.
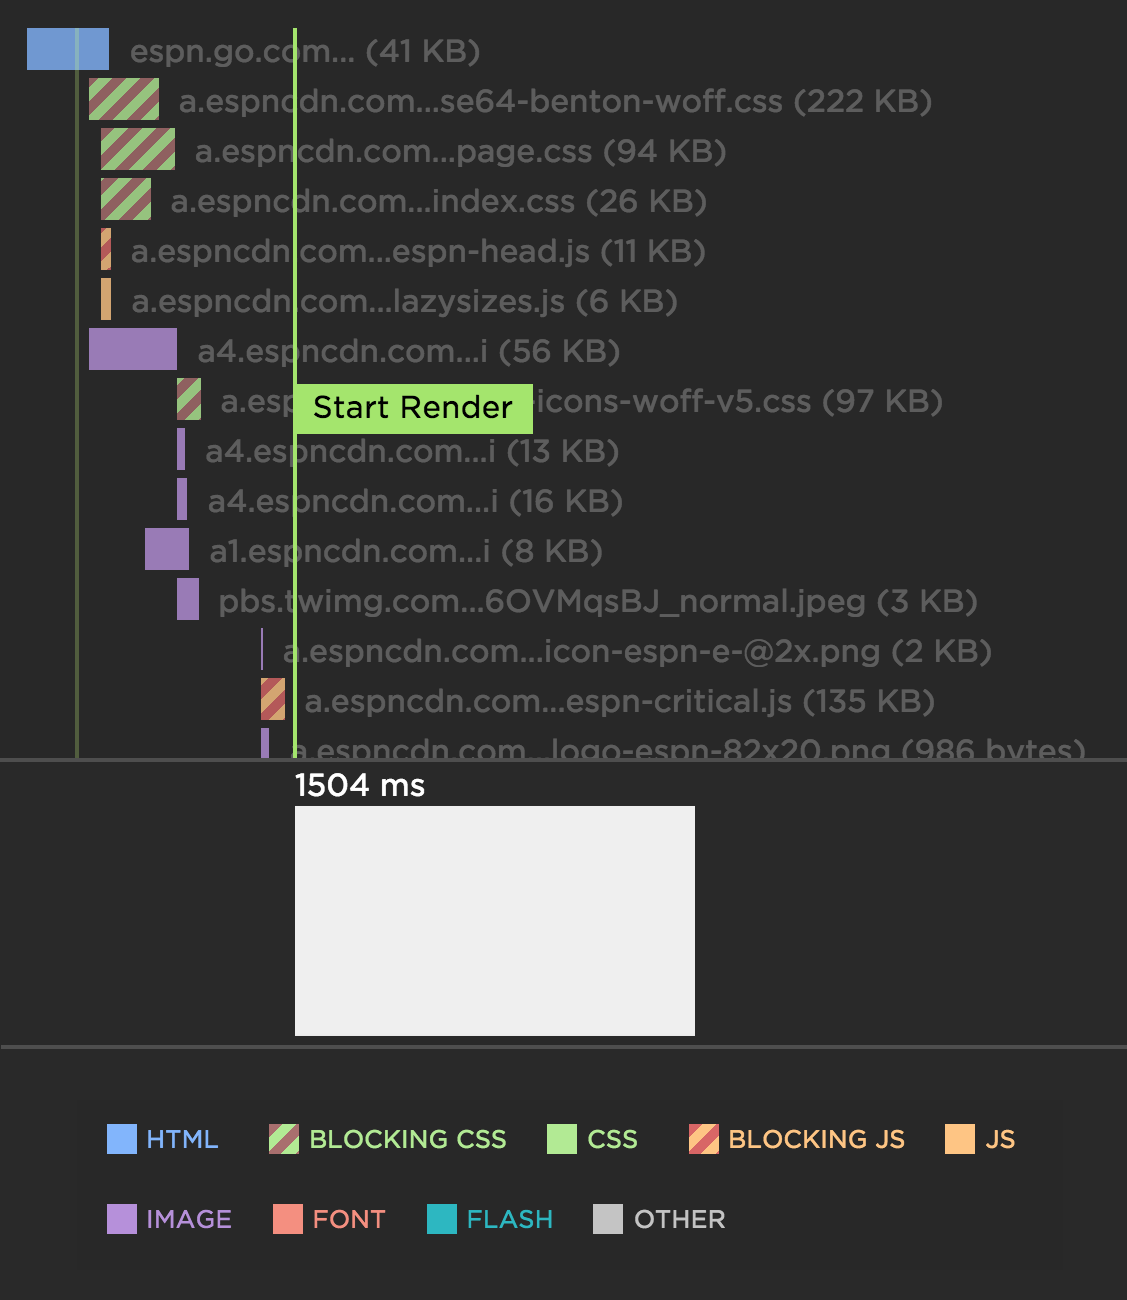
Not all scripts and stylesheets necessarily have a big impact on performance, so it's important to be able to tell the blocking requests when trying to improve the user experience. In the waterfall above we see that there's an early script (request #6, "lazysizes.js") that is not marked as a critical resource. That's because this script is loaded asynchronously and thus doesn't block rendering of the page. Since we only want to highlight resources that block rendering, asynchronous scripts are not highlighted.
Similarly, in some cases it's possible to have stylesheets that don't block rendering of the main page. This typically happens with third party widgets that are loaded in an iframe, like the Twitter widget. Since stylesheets in iframes do not block the main page from rendering, they're not marked as critical resources.
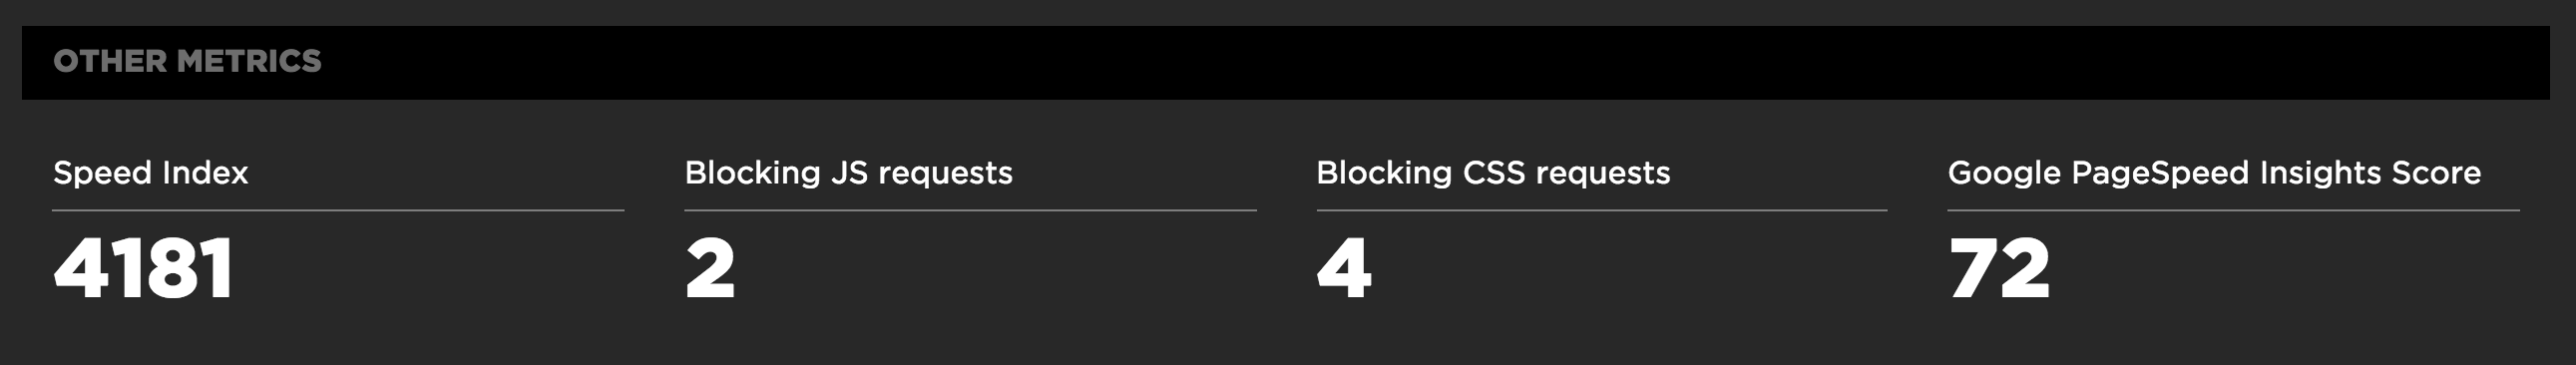
In addition to highlighting critical resources in the waterfall, the number of blocking stylesheets and synchronous scripts is shown under Other Metrics.
Once we have a month of historical data for critical requests, we'll add charts to track this metric over time. This new visibility into the number of blocking requests, and which ones they are, will help teams create fast, enjoyable experiences for their users.
The critical rendering path
For more on what the critical rendering path is, why it matters so much and how to optimize asset delivery to ensure you don't block it IIya Grigorik gave a great overview of the topic at Velocity Conf 2014.