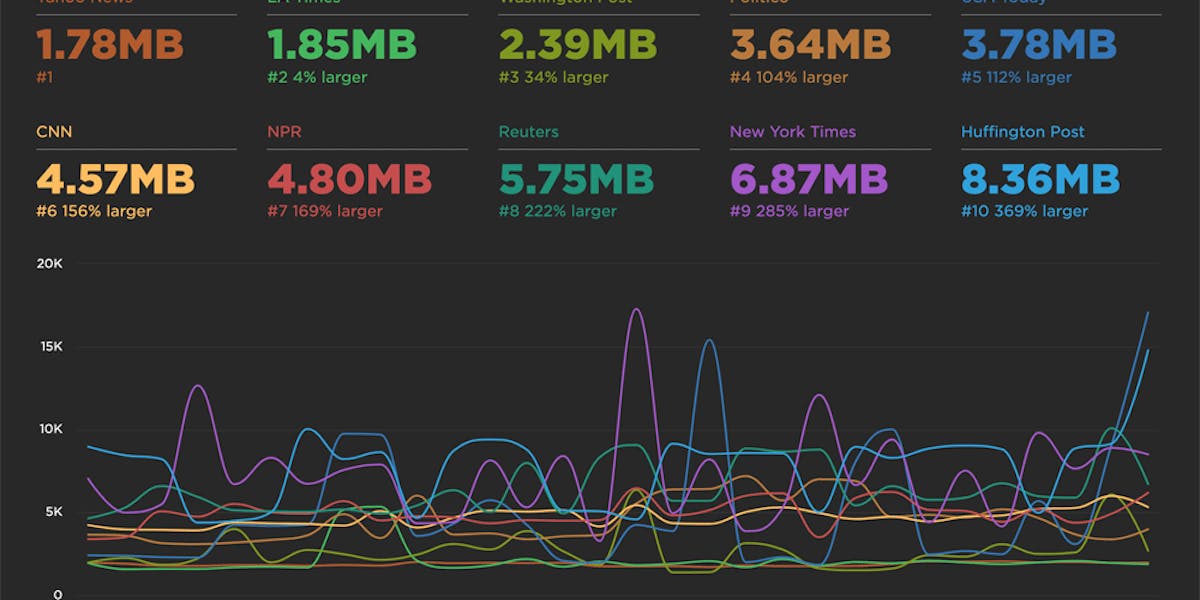
Improved Favorites
We've improved the "Favorites" dashboard which now lets you build your own charts which:
- Combine synthetic tests and LUX (real user monitoring) in one chart.
- Choose average, median, or 95th percentile.
- Create charts that have multiple metrics.
- Select multiple values for a filter, eg, browser = Chrome or Firefox, country = UK or US.
- Compare A/B tests in a single chart.
Here's a walkthrough showing you some of the new features:
We've also improved the performance and user experience of the Favorites charts. There are a lot more filter options and each chart loads individually getting charts to you faster.
We'd love your feedback. Let us know what else you'd like to see added to the Favorites dashboard. Here's a few of the things we're considering adding like filmstrips and histograms.


