NEW: Improving how we collect RUM data

We've made improvements to how we collect RUM data. Most SpeedCurve users won't see significant changes to Core Web Vitals or other metrics, but for a small number of users some metrics may increase.
This post covers:
- What the changes are
- How the changes can affect Core Web Vitals and other metrics
- Why we are making the changes now
What's changing?
By default, SpeedCurve RUM used to send its main beacon shortly after the load event fires, another soon after the visitor first interacts with the page, and then further beacons as User Timing marks and measures (AKA custom metrics) are added.
This approach was sound when our main focus was measuring how quickly pages loaded or routes changed. But newer metrics – such as Cumulative Layout Shift (CLS) and Interaction to Next Paint (INP) – don't stop at page load or first interaction. As a result, they need to be measured throughout the entire lifecycle of the page.
To work around some of the limitations of the current approach, we've added options that allow sites to delay when they send the beacon, but these must be implemented on a site-by-site basis – which isn't ideal.
Starting August 7, 2024, we've improved our defaults. Now performance metrics will be captured for longer and beacons will be sent at the earliest of 60 seconds after page load starts, or when the visitor leaves the page if that happens sooner.
Sites such as SPAs, which use LUX.auto = false to control when they send the beacons themselves, are opted out of our default behaviour and won't see any changes.
To understand which metrics are affected and how much they change, we've run the old and new measurement pipelines in side-by-side and compared the data each produces.
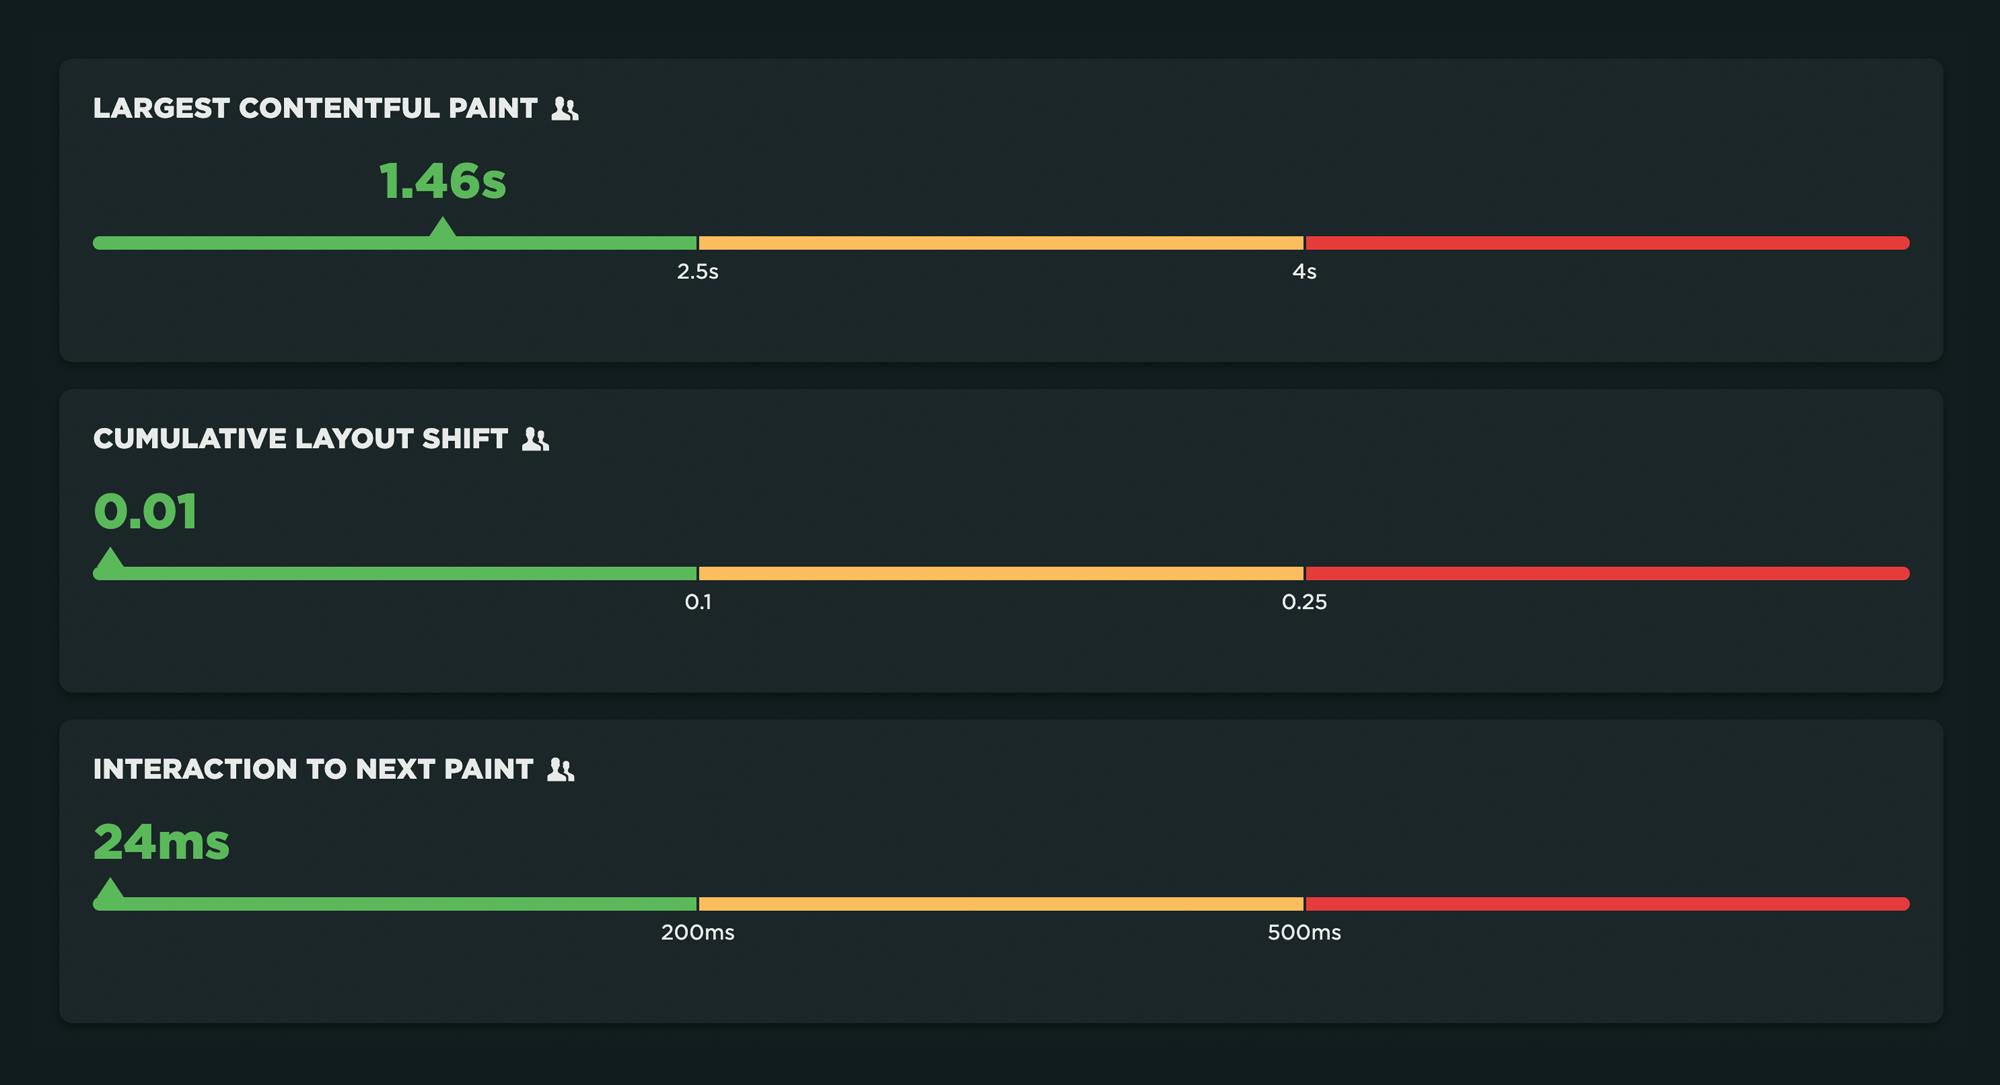
How your Core Web Vitals may change
Most customers won't see significant changes to Core Web Vitals or other metrics, but for a small number of customers some metrics will increase.
Some metrics are fixed at the point they're measured, while others can change with time or as a result of user interaction.
First Contentful Paint is an example of a metric that's fixed in time. It's the timestamp of when the browser first displayed content. Because there is only ever one first paint, it can't change after that point.
Other metrics can change. A page can display a larger image, content can move around, and visitors can trigger slower interactions.
Sending the beacon later means we have a longer window to watch for changes to these metrics, and in some cases we can capture changes that we could not detect previously.
The metrics that we've seen increase for some customers are:
- Largest Contentful Paint (LCP)
- Cumulative Layout Shift (CLS
- Interaction to Next Paint (INP)
Here are some examples of things we've come across that can lead to metrics increasing as a result of sending the beacon later:
Largest Contentful Paint (LCP)
LCP stops being measured when there's an Input Event (click, tap or keypress) or the visitor scrolls the page.
Hover Events aren't classed as Input Events. If a Hover event triggers a larger image to be loaded or a larger text paint, that can cause LCP to increase.
Two examples where we've seen LCP increase due to visitor interaction:
- Product pages that show zoomed product images on hover
- Desktop 'mega-menus' where the images embedded in it are larger than the main images on the page
Here's an example from a retailer's category page. The promotional banner at the bottom of the menu is larger than the product cards. As a result, the banner will become the LCP element when the menu is shown.
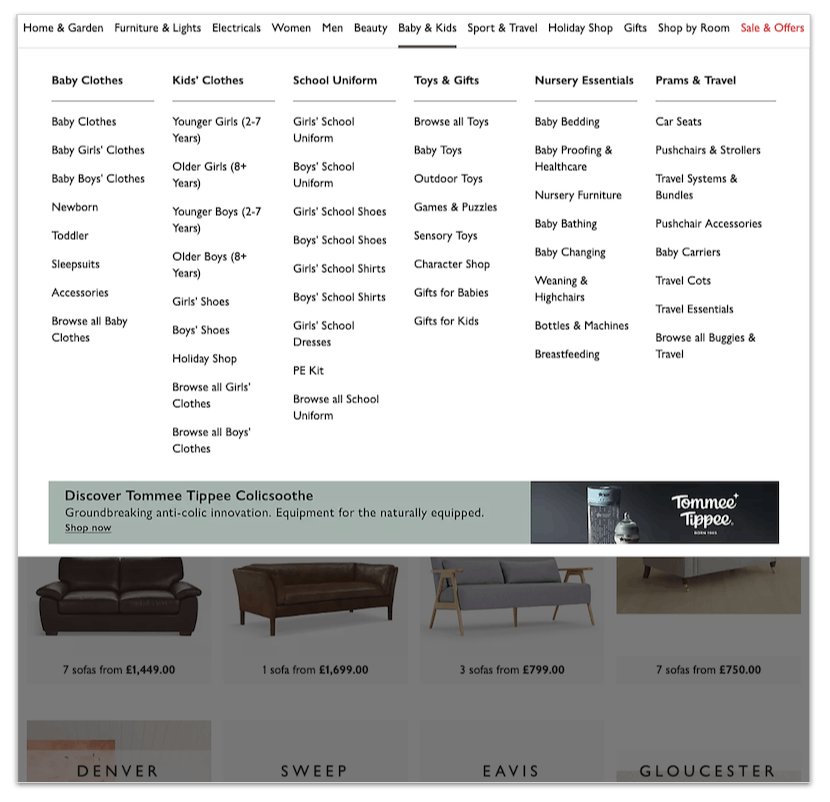 Promotional banner becomes LCP element when a visitor hovers on the menu
The hover behaviour is a known 'gotcha' for LCP. If you're interested in following how it might change in the future, there's an issue against the specification that discusses it further.
The other common case where we've seen LCP increase is when a script triggers a late large paint, for example by displaying a dialog for a consent manager or an email subscription popup.
These examples highlight that LCP doesn't always measure the most important content. This is why I encourage sites to use Element Timing to measure the visual elements that really matter to their user experience.
Cumulative Layout Shift (CLS)
Layout shifts that are triggered within 500ms of a user's interaction are ignored for CLS; however, scrolling is not considered an interaction for CLS purposes, so content that moves around or changes size as someone scrolls will create new layout shifts and potentially a higher CLS score.
News sites – where advertisements are lazy-loaded or refreshed as the page scrolls and the advert creative is larger than the space reserved for it – are an example where CLS scores can get worse due to the longer measurement time.
Here's a news article where an ad creative loads on scroll. The publisher has reserved space for the ad unit, but the creative that loads is larger than the space. As a result, there's a layout shift as the content below the ad is pushed down.
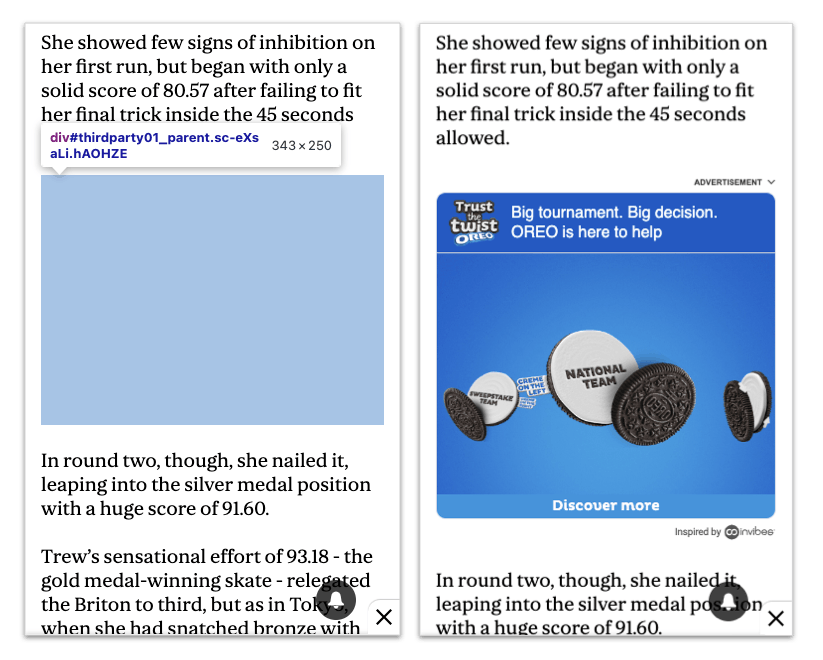
Layout Shift triggered by an lazy loaded advert whose creative is larger than the space reserved for it
Scripts that are triggered by the load event, or a long timer and insert content into the page, are another example where CLS may increase.
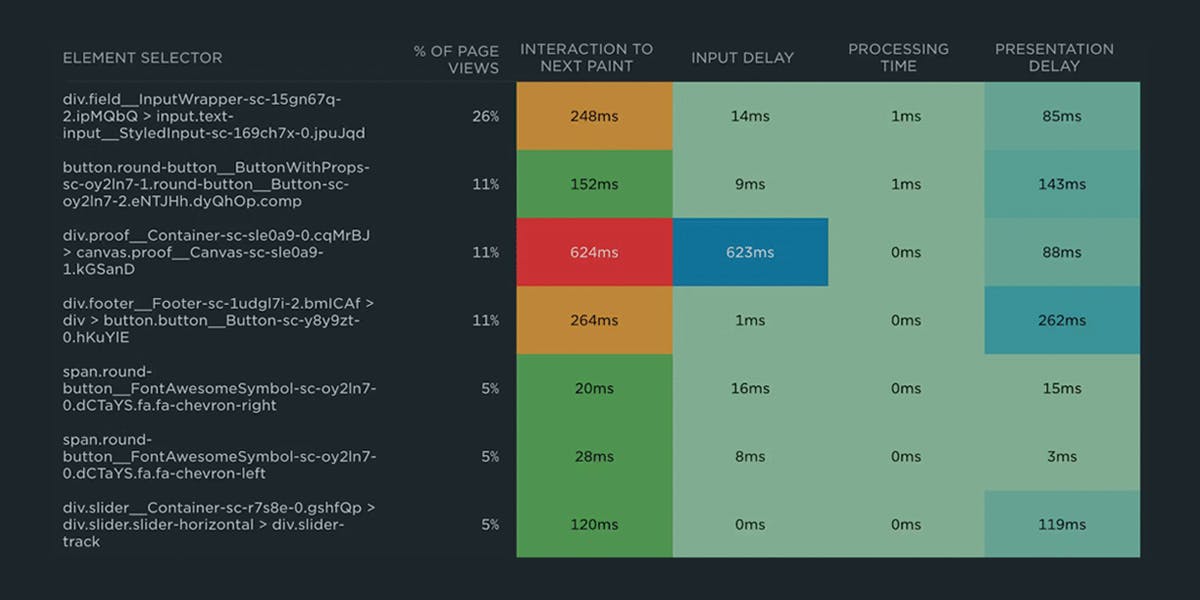
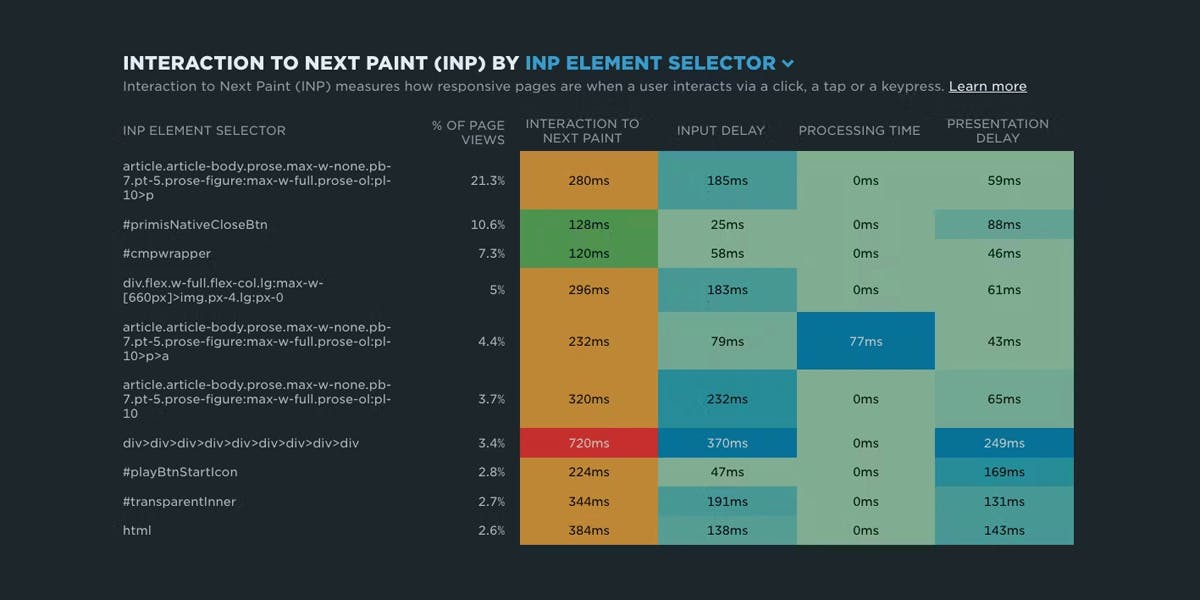
Interaction to Next Paint (INP)
Visitors may interact with a page more than once. A shopper might examine different images of an item before adding it to their basket. Someone might like multiple posts on a social network before responding to one of their friends. There's no guarantee which of these interactions will generate the highest INP time.
By extending the wait before we send the RUM beacon, we're more likely to capture the slowest and most annoying interaction on the page.
Why we changed our approach
We identified that we needed to capture data for a longer time a while ago, but constraints in our RUM processing pipeline made it difficult to implement.
Our existing pipeline has served us well. Using Fastly's beacon termination service to capture and forward RUM data, and VCL to enrich it, has proved really robust over the last eight years. But as our product has grown and new metrics have been introduced, the pipeline has become more complex. As a result, we've started to run into the pipeline's limitations more frequently.
We knew that sooner or later we'd need to re-engineer the pipeline. As part of adding diagnostics for Core Web Vitals, we've re-implemented the pipeline using Fastly's edge compute. (We're saving a deeper overview of our new pipeline for another post.)
Sending the beacon later has a number of benefits, now and down the road:
- Improves the accuracy of the metrics we're capturing
- Allows us to simplify our RUM processing pipeline
- Made it easier to implement attribution for INP and LCP
- Smooths the way for adding other features we have planned for the future
That sounds like a win for everyone.
If you've any questions about the changes, or notice something in your data that you can't explain we'd love to hear from you. Send us a note at support@speedcurve.com.