July 2022 product update: Web Vitals support, more synthetic test agents & performance heat maps

It's been another busy month here at SpeedCurve! Check out our latest product updates below.
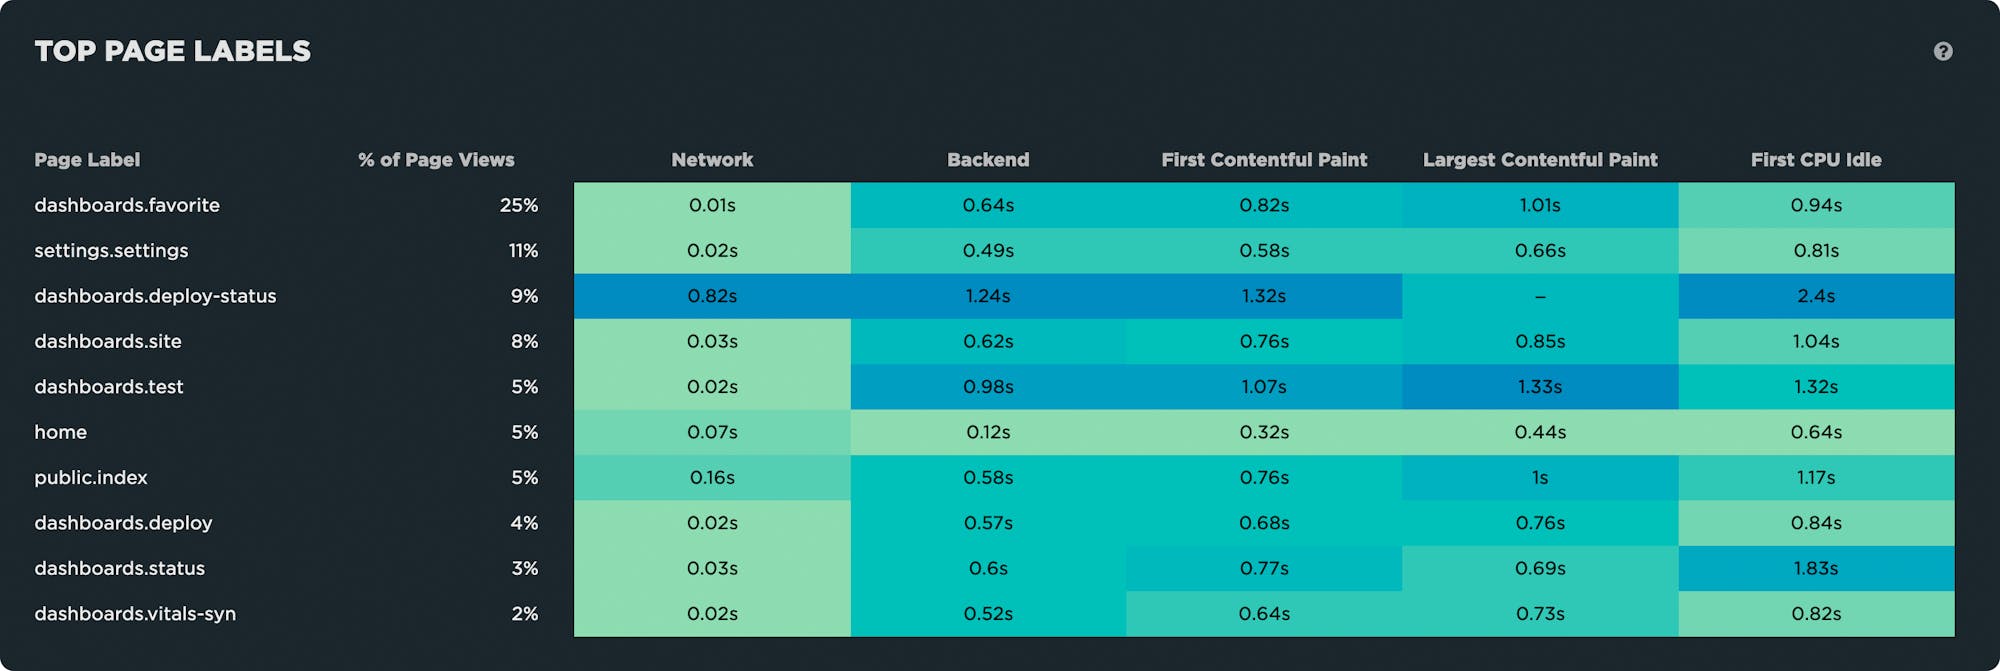
RUM: Performance heat maps

Fixing high-traffic but poorly performing areas of your site will improve your overall metrics – and create a faster, better experience for more of your users. To help you do this, we've added heat maps to your RUM Performance dashboard that let you quickly spot which page labels or paths are experiencing performance issues. You can then prioritize and focus on these areas to improve important metrics like Largest Contentful Paint.
Synthetic: New test regions in Italy, Bahrain, South Africa, and Indonesia
Based on your feedback and requests, we've added four new regions from which you can run your synthetic tests:
- Italy (Milan)
- South Africa (Cape Town)
- Bahrain (Manama)
- Indonesia (Jakarta)

If none of our current test regions gives you the testing locations you need you can also run your own private agent.
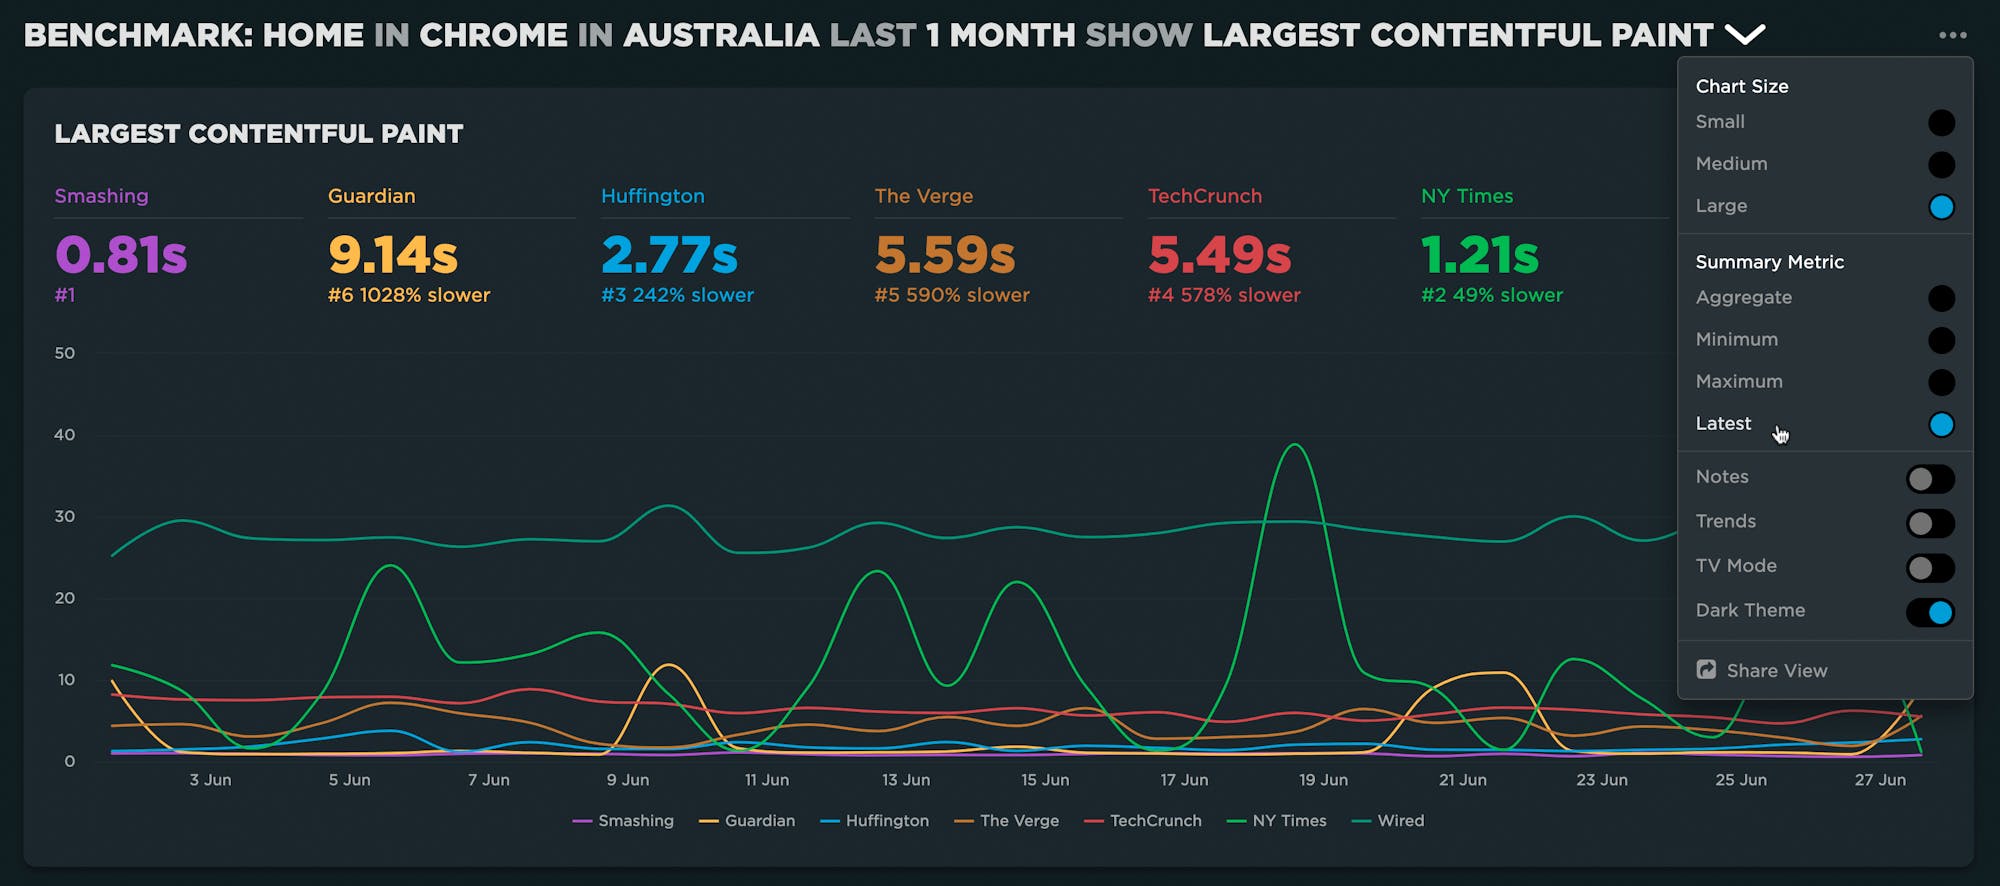
Change summary metrics on your charts

We've added a new display option that lets you change the summary metrics shown at the top of each chart. You can now choose between Aggregate, Minimum, Maximum or Latest. Hovering over any metric will give you a tooltip with more context.
In case you missed it...
Here are some other features we've released in recent months:
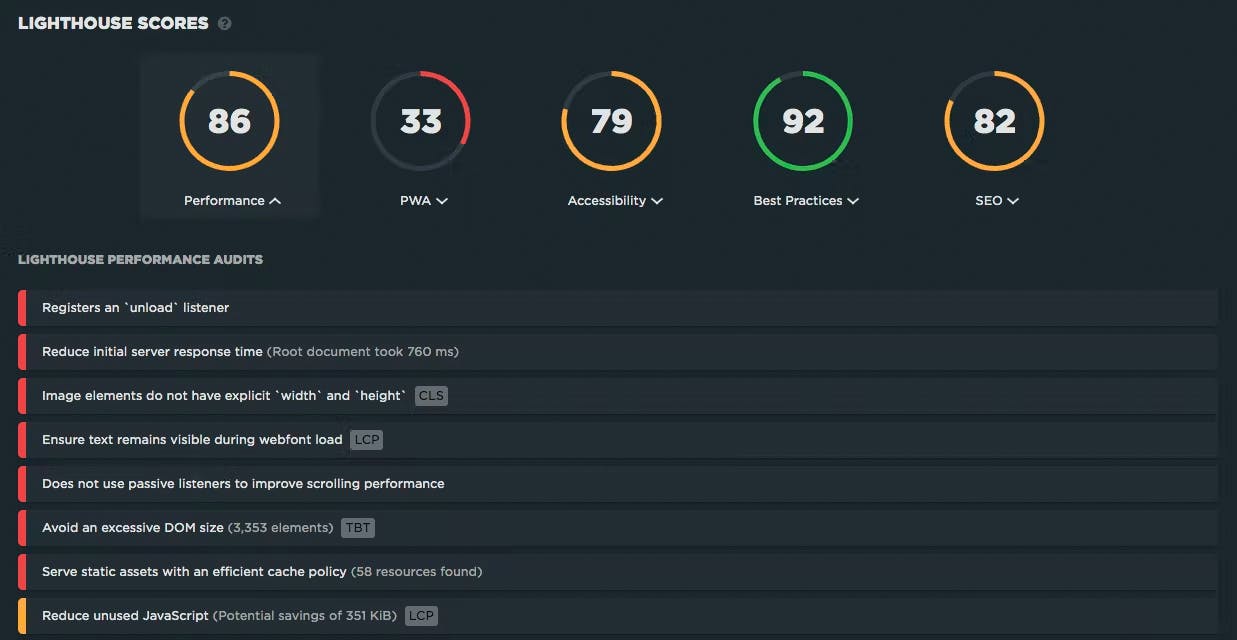
Core Web Vitals badges in performance recommendations – Identify exactly which performance issues you need to fix to improve your Lighthouse and CWV metrics. All performance recommendations are badged, so you can see which Core Web Vitals you're improving when you fix performance issues. (You can find recommendations in your Vitals and Improve dashboards, as well as test details.)

Compare third parties – When comparing two synthetic tests, see a comparison of common third parties and identify which third parties are unique to each test.
Bookmarks dashboard for both Synthetic and RUM – Compare any two synthetic tests or RUM sessions.
RUM path filters – Monitor popular or custom user paths in your data.
Most-watched help videos
We've created two video series – dashboard tours and how-to videos – to help you find and fix performance issues on your site. Here are the current top five most-watched videos:
- Vitals Dashboard tour
- First and Third Party Dashboard tour
- Track Google's Core Web Vitals (and create performance budgets for them)
- Diagnose Cumulative Layout Shift (CLS) issues
- Investigate why your Time to Interactive (TTI) is slow
Most-read support articles
We take a lot of pride in maintaining a comprehensive Support Hub. These are the most popular articles users looked up in the past month:
- Understand medians, averages, and percentiles
- Get started with Core Web Vitals
- Get started with real user monitoring (RUM)
- Synthetic test scripting
- Glossary of performance metrics
Questions? Feedback? Suggestions?
We'd love to hear from you! Leave a comment below or email us at support@speedcurve.com.


