By popular demand: Multiple Favorites dashboards!

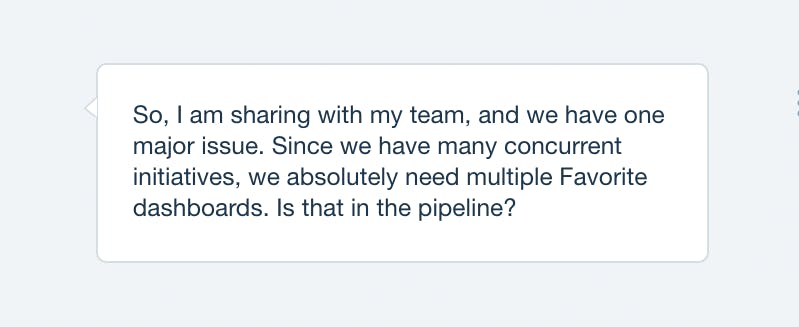
Rolling out new features is always a blast, and it's extra rewarding when the new feature is a response to a customer request. We've had many conversations with SpeedCurve users who've told us that multiple Favorite dashboards would be a huge benefit for their teams.
Today, we're very excited to announce that multiple Favorites dashboards are now available. Here's why you need them and how to create them.
Who needs multiple Favorites dashboards?
The ability to create multiple Favorites dashboards is a huge boon for organizations that have many different teams and projects on the go at any given time. They're also helpful if you need to curate charts for different audiences.
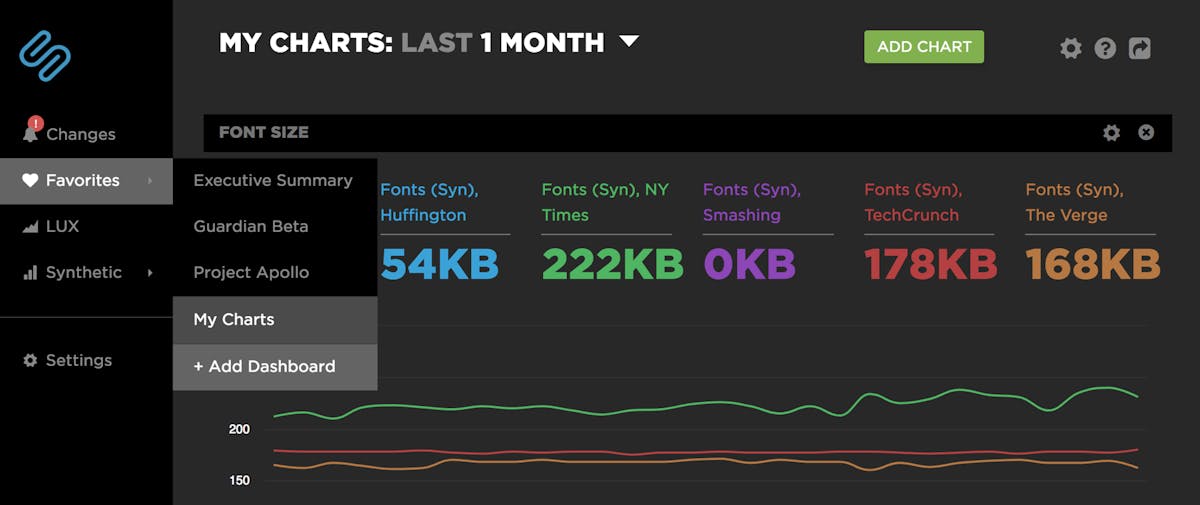
For example, if you need to do regular performance presentations at monthly management meetings, you can curate high-level charts in an "Executive Summary" dashboard. Each dashboard also allows you to generate a "share" URL – which can be sent to non-users as well – so you can also share individual dashboards via email or on a display monitor.
Within your performance team, you can create specific dashboards for separate projects. For example, if you're using custom timers to track ads on your pages, you can create a dashboard called "Third Party Ads". And so on.
Why you need custom charts
We think our curated charts, which are available by default with your SpeedCurve plan, are pretty great. We've put a lot of thought into creating visualizations that are as meaningful as possible.
But you know your own business better than we do. By building custom charts, you can cherry pick the metrics and data that are most important to your business and track them over time.
Custom charts let you do things like:
- Combine multiple metrics
- Combine synthetic and LUX (real user monitoring) data in one place
- Choose average, median, or 95th percentile
- Select multiple values for a filter (e.g., browser = Chrome or Firefox, country = UK or US)
- Compare A/B tests in a single chart
Getting started
If you’re already a SpeedCurve user: Creating multiple Favorites dashboards is easy! You can get started in minutes. Check out our short tutorial that walks you through the process for creating custom dashboards and charts.
If you’re not a SpeedCurve user: Sign up for your free trial and start creating your own custom charts and dashboards.
How have custom performance charts helped you?
We'd love to know what kind of custom charts you've created, and how they've helped your performance team and your company. Let us know in the comments, or email us at support@speedcurve.com.
Read Next

See how customers are using SpeedCurve to make their sites faster.

See industry-leading sites ranked on how fast their pages load from a user's perspective.