NEW: Vitals dashboard updates and filter improvements

Our development team recently emerged from an offsite with two wonderful improvements to SpeedCurve. The team tackled a project to unify our filtering, and then they over-delivered with a re-Vital-ized dashboard that I'm finding to be one of the most useful views in the product.
Take a look at the recent updates – and a big thank you to our amazing team for putting so much love into SpeedCurve!
Start simple, go deep...
Performance is hard, complex, and riddled with nuance. There is a sea of data collected by SpeedCurve and endless ways to interpret that data.
New users of the product crave good design and simplicity in an effort to make sense of this firehose of performance information.
Power users desire diagnostic capabilities that require extensive use of the latest and greatest browser APIs.
Sometimes it's hard to do both and still provide meaningful information to both audiences. We embrace this challenge and, wherever possible, adopt the principle of starting with a simplistic overview and progressing into meaningful, actionable data.
Vitals dashboard improvements
When we first launched the Vitals dashboard back in December of 2020, we focused on keeping it simple. Core Web Vitals were still a new concept, and educating folks was the primary goal.
In the last four years, a lot has changed:
- First Input Delay (FID) was given the boot in favor of Interaction to Next Paint (INP).
- Chrome exposed browser APIs providing attribution of element selectors and timing subparts for LCP and INP.
- Finally, we heard from many of you who wanted to expand the scope of the dashboard to include other meaningful metrics that were not technically considered Core Web Vitals.
More metrics: Backend Time and First Contentful Paint
We've added Backend Time and First Contentful Paint (FCP) to the Vitals dashboard. We also continue to show Total Blocking Time (TBT).
Those three metrics tell us a lot about potential causes of a poor user experience:
- Backend Time isn't always a black box. RUM can tell you where that time is being spent, whether its network related or due to CDN or origin issues.
- First Contentful Paint tells us when the page begins to render and effectively become consumable by an end user.
- Total Blocking Time gives us clues around CPU-intensive tasks that block rendering and interactivity with the page.
Vitals Dashboard walkthrough
The following assumes you are leveraging both Synthetic and RUM. If you aren't using our RUM, you'll still get a look at your synthetic data. (If you'd like to add RUM to your monitoring, contact us at support@speedcurve.com and we'll set you up with a free trial!)
Focusing on Largest Contentful Paint (LCP), let's walk through an example of how to leverage your Vitals dashboard to find and fix issues with your Vitals.
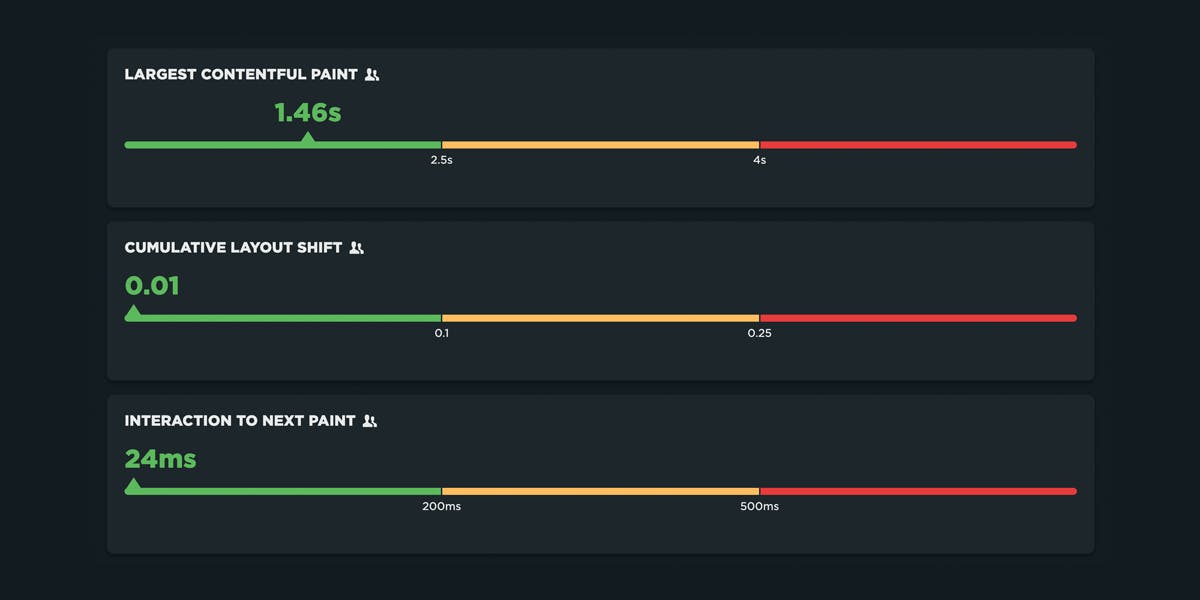
1. Review the color-coded tabs to see which metric needs attention
Beginning with the overview at the top of the dashboard, you can look at the tab for each metric to see what needs attention. Each tab is color-coded so you can see if it's Good (green), Needs Improvement (orange), or Poor (red). These thresholds are aligned with Google's recommended thresholds.
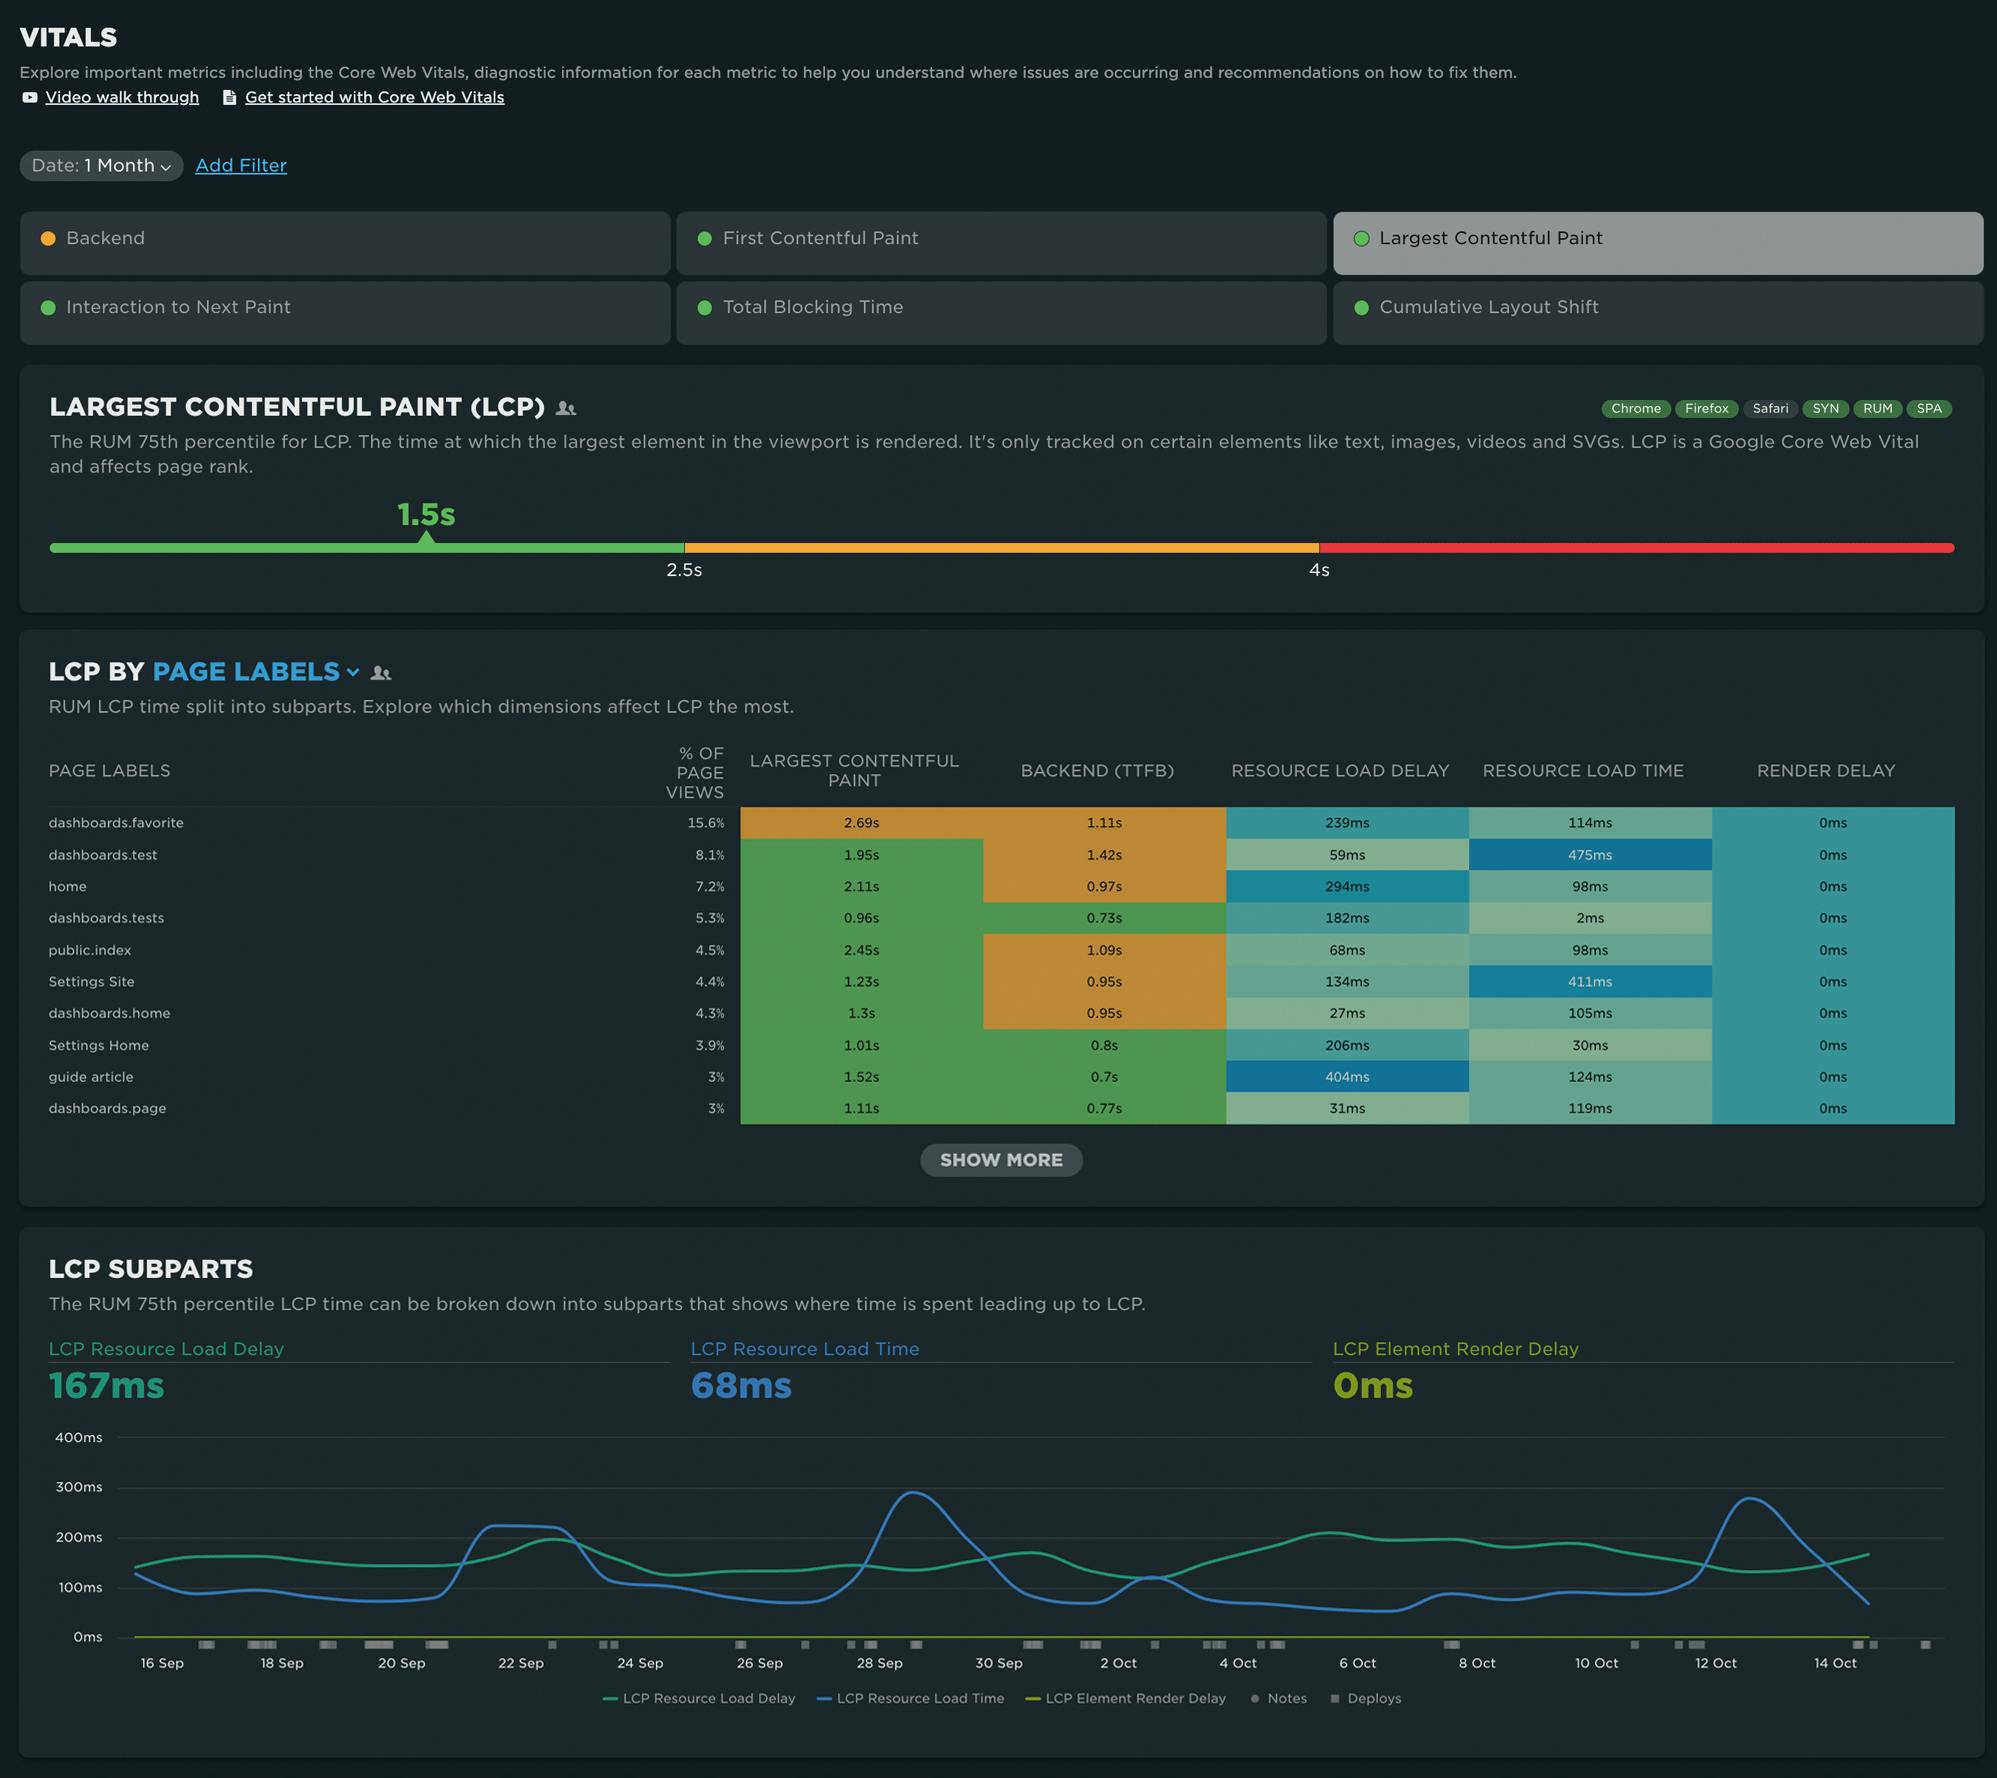
2. Select a tab to drill down into a metric
Selecting the LCP tab lets us know just where we sit for the population we are investigating. We've also included badges to make it clear which browsers support each metric. (That's right – Safari doesn't support LCP, so you can't track performance for your iPhone users.)

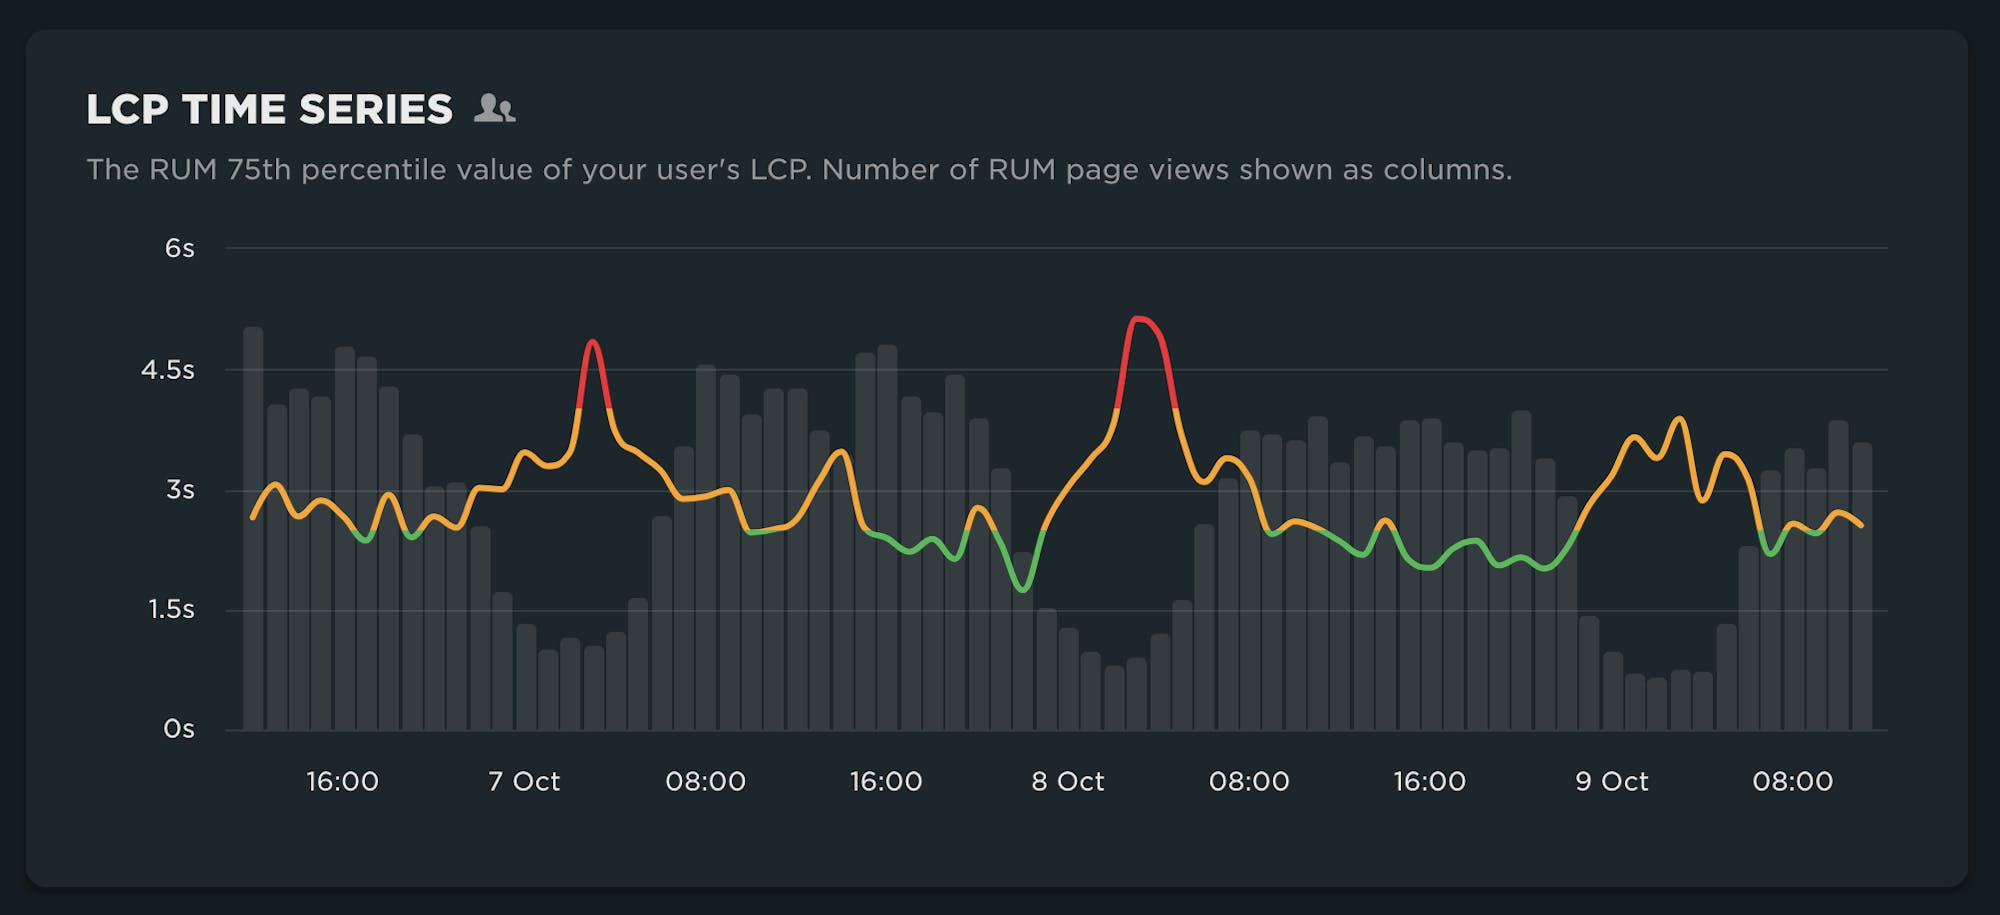
3. View historical performance
Further down the dashboard, a time series chart provides a historical look at the metric, with added context around volume (for RUM customers only). If your LCP is poor in the middle of the night, should you care? Maybe!
4. Get a high-level view of historical performance for Good, Needs Improvement, and Poor cohorts
For added context, the distribution charts show a historical view of the experience of a population – and, of course, a histogram representing the entire population of experiences for LCP.
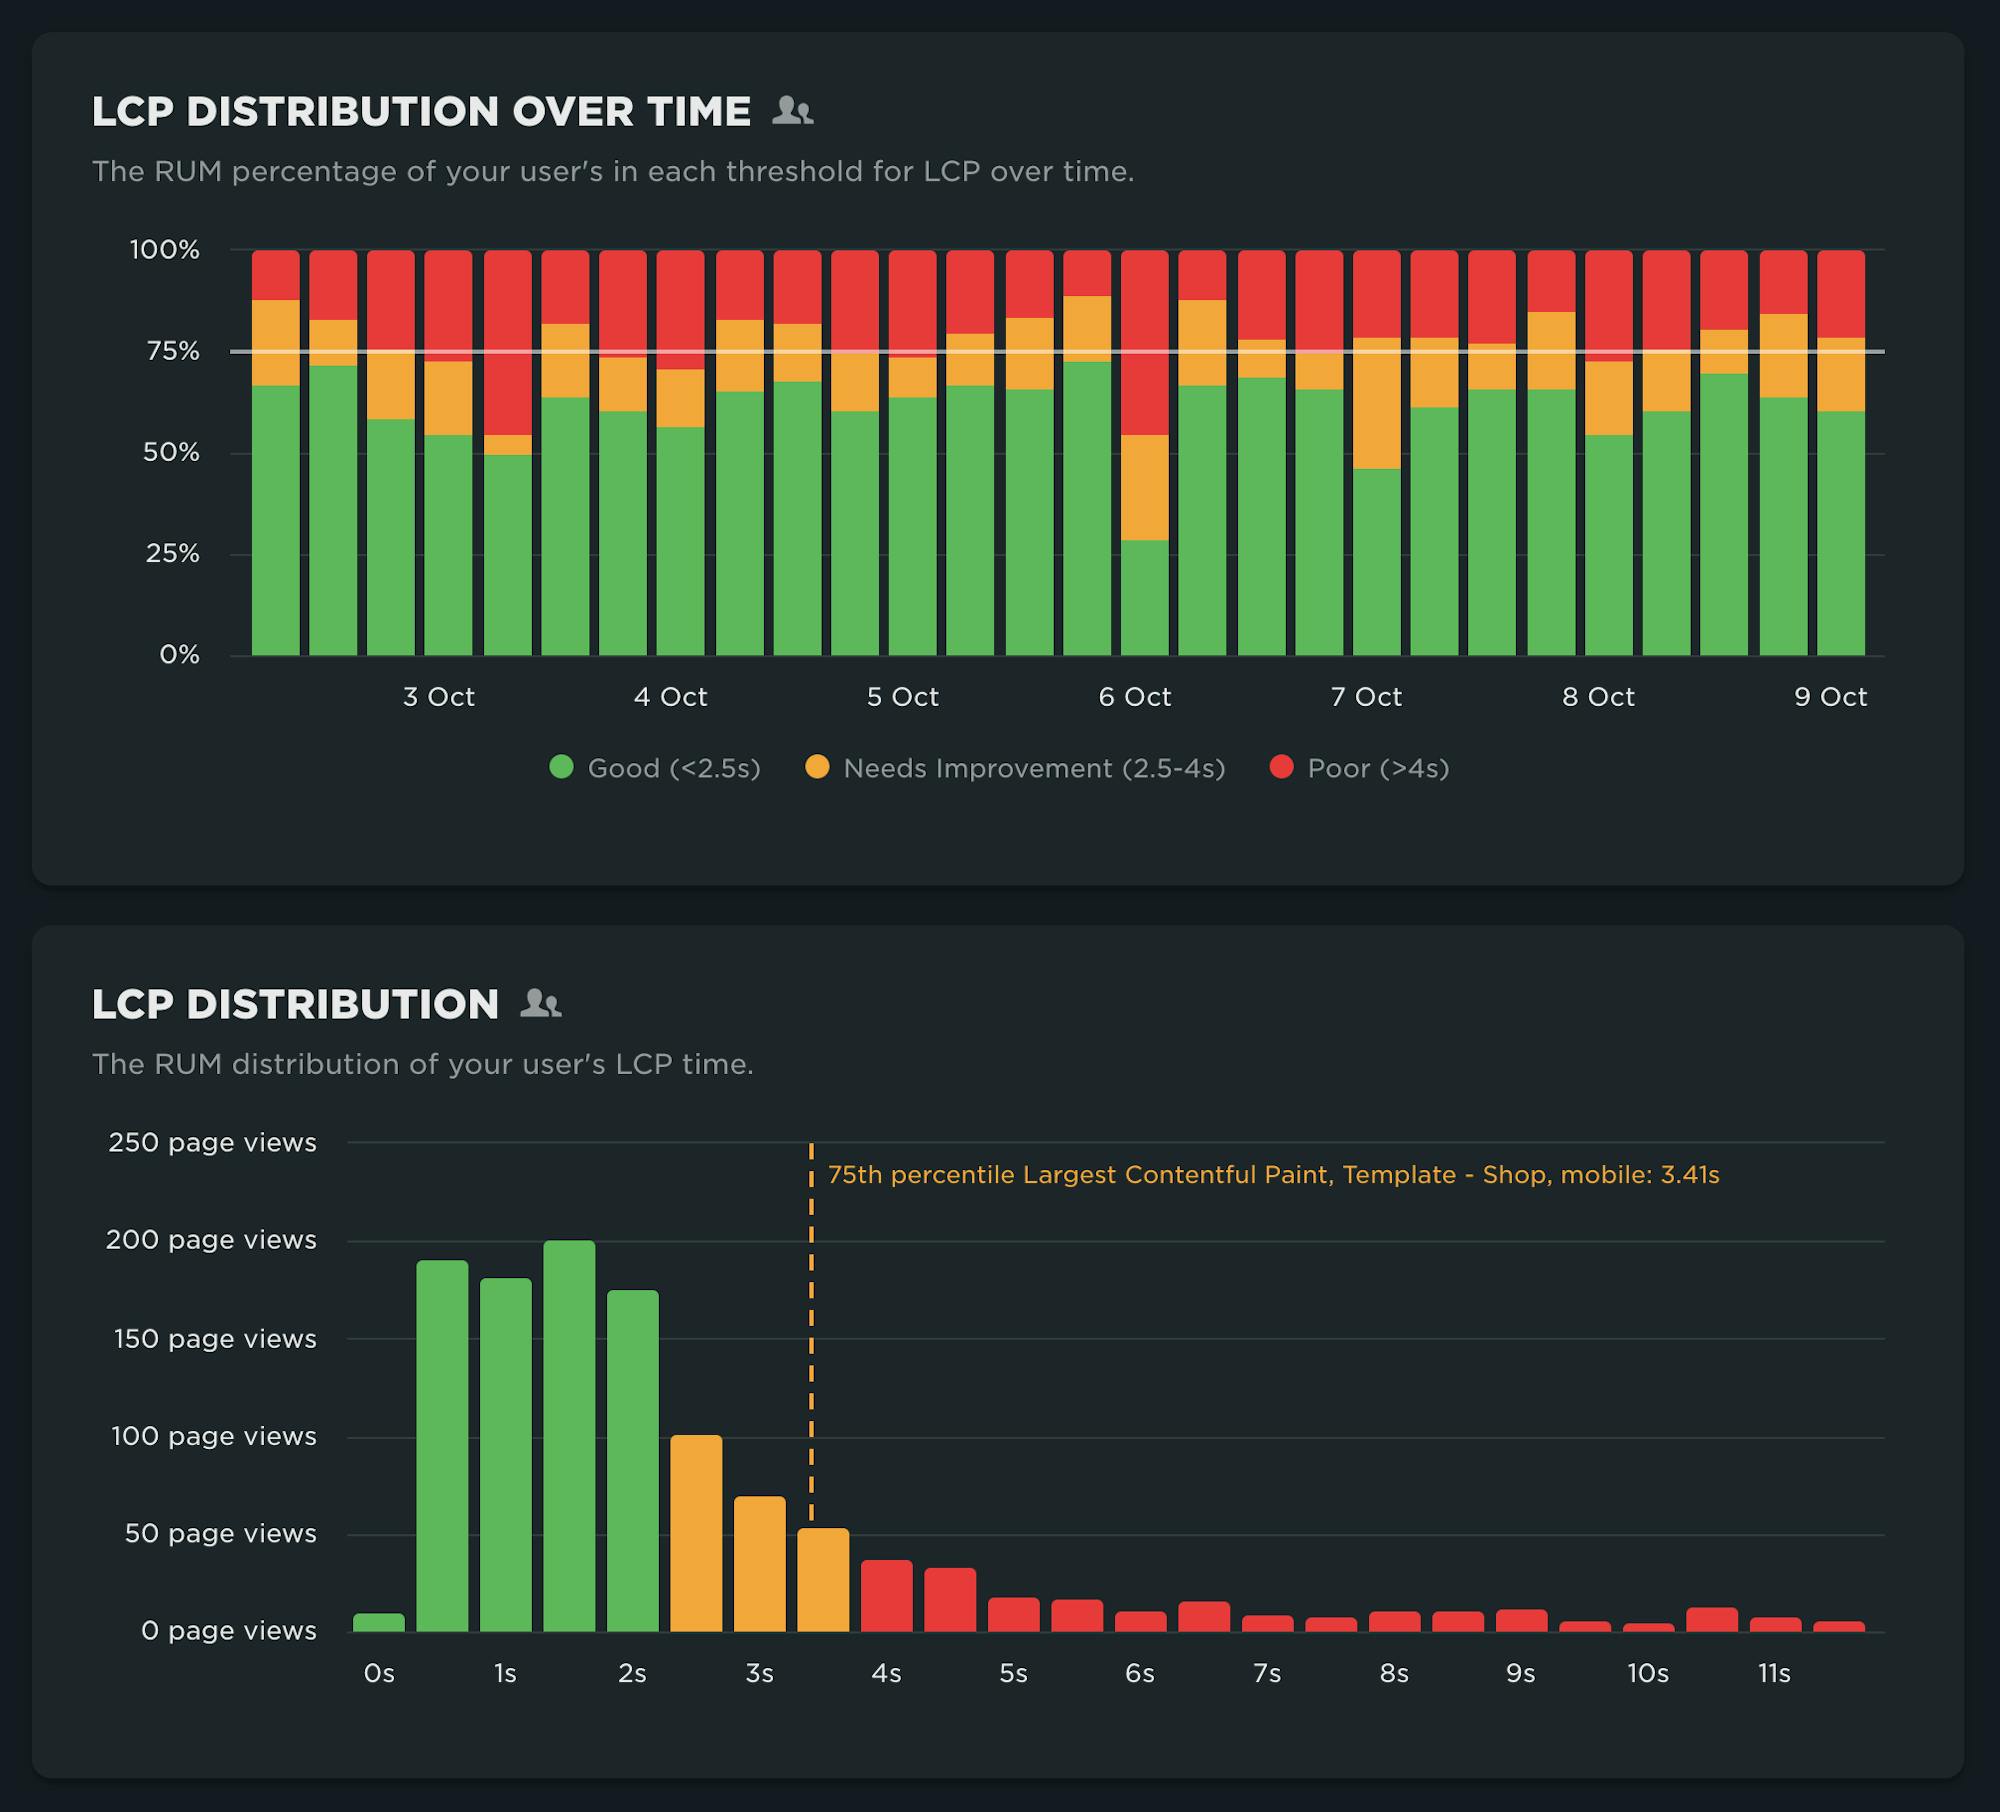
Clearly there's room to improve LCP. Now what?
5. Identify problem pages
Seeing tabular data for LCP (below) allows us to identity problematic pages that need attention.
In this case, Home seems to be the only page getting a 'poor' rating for LCP. It's also the most popular page by volume, as indicated by the % of page views.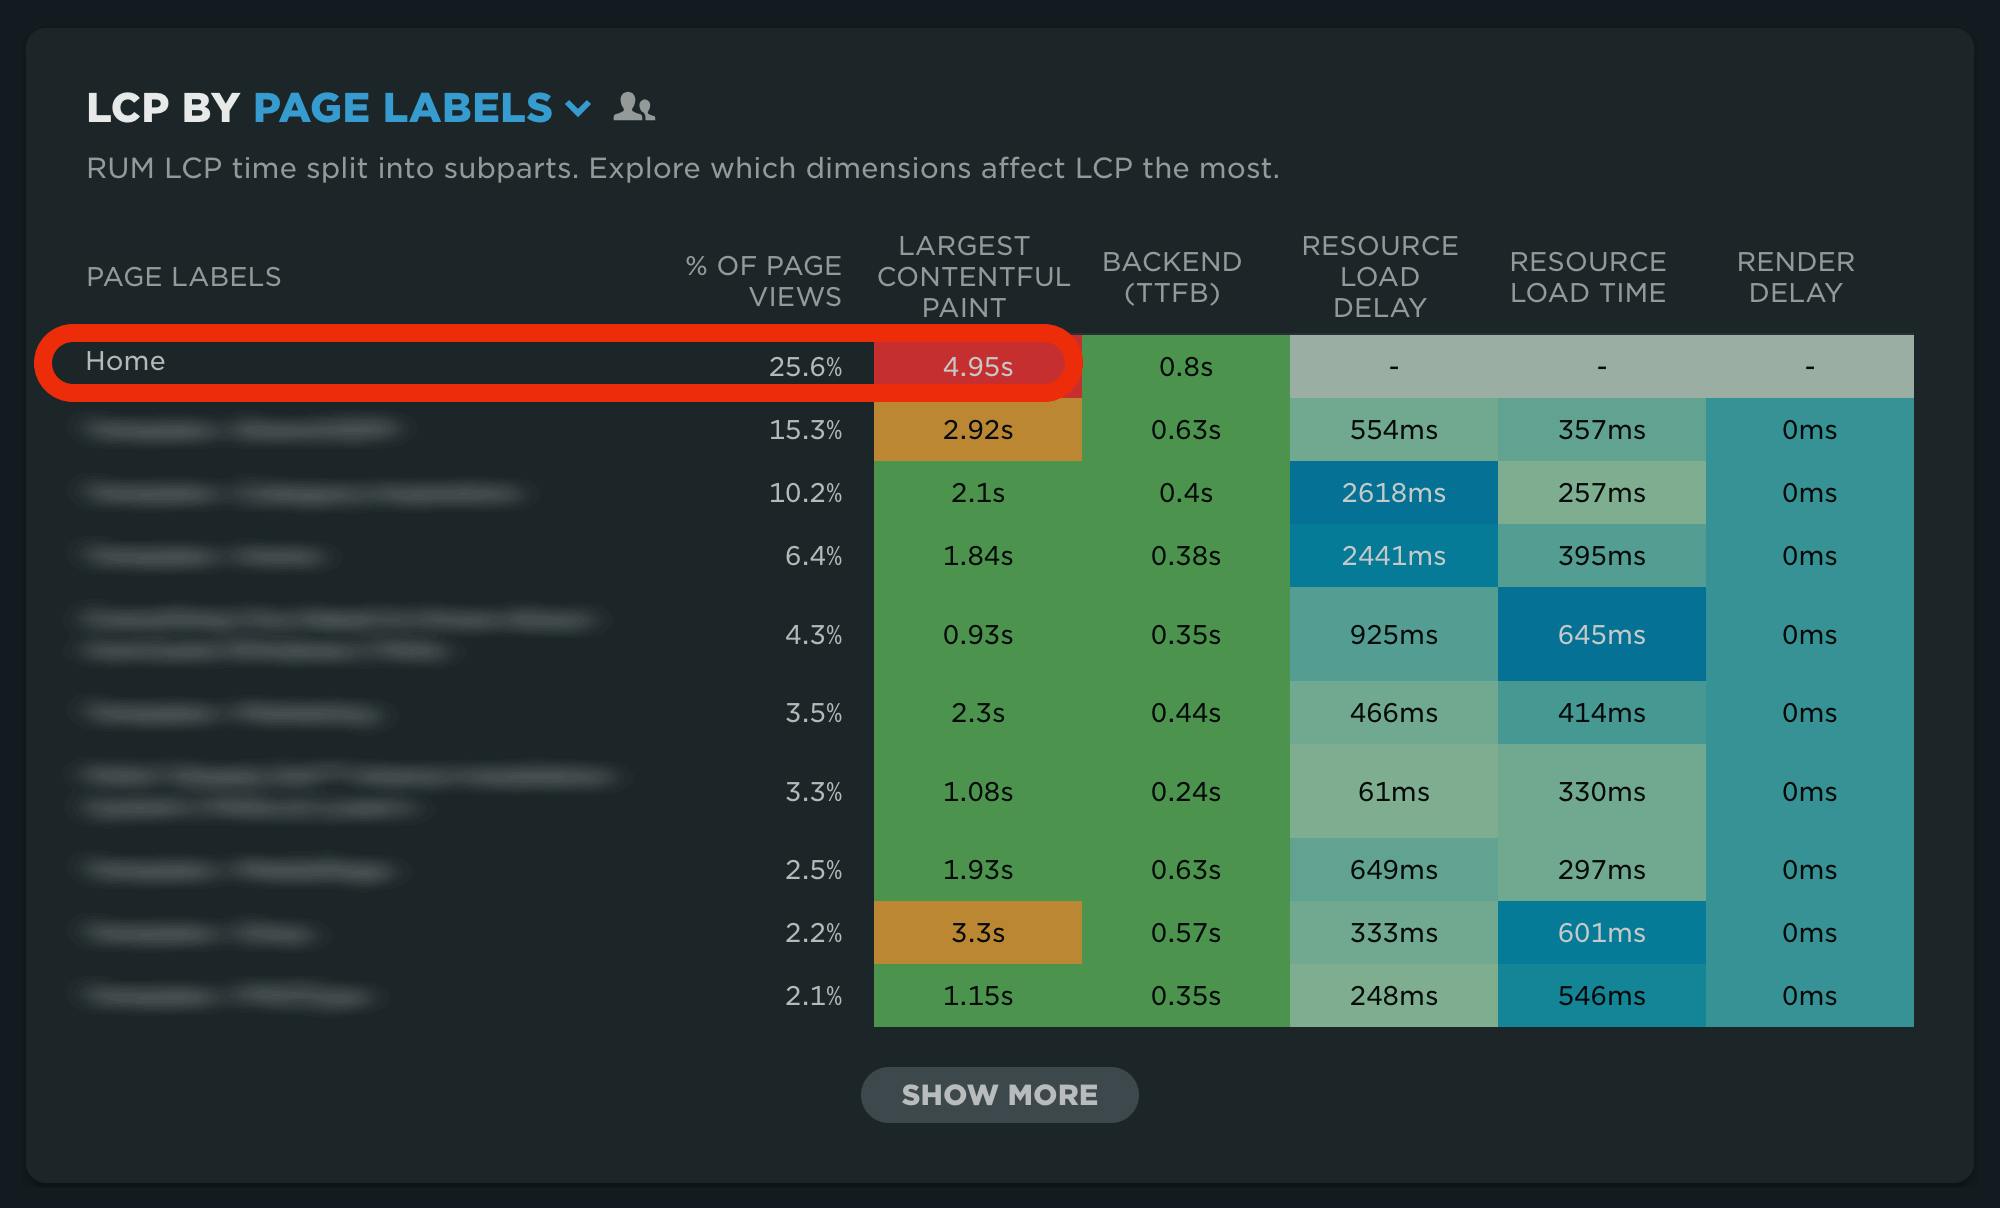
6. Identify the most problematic elements on the page
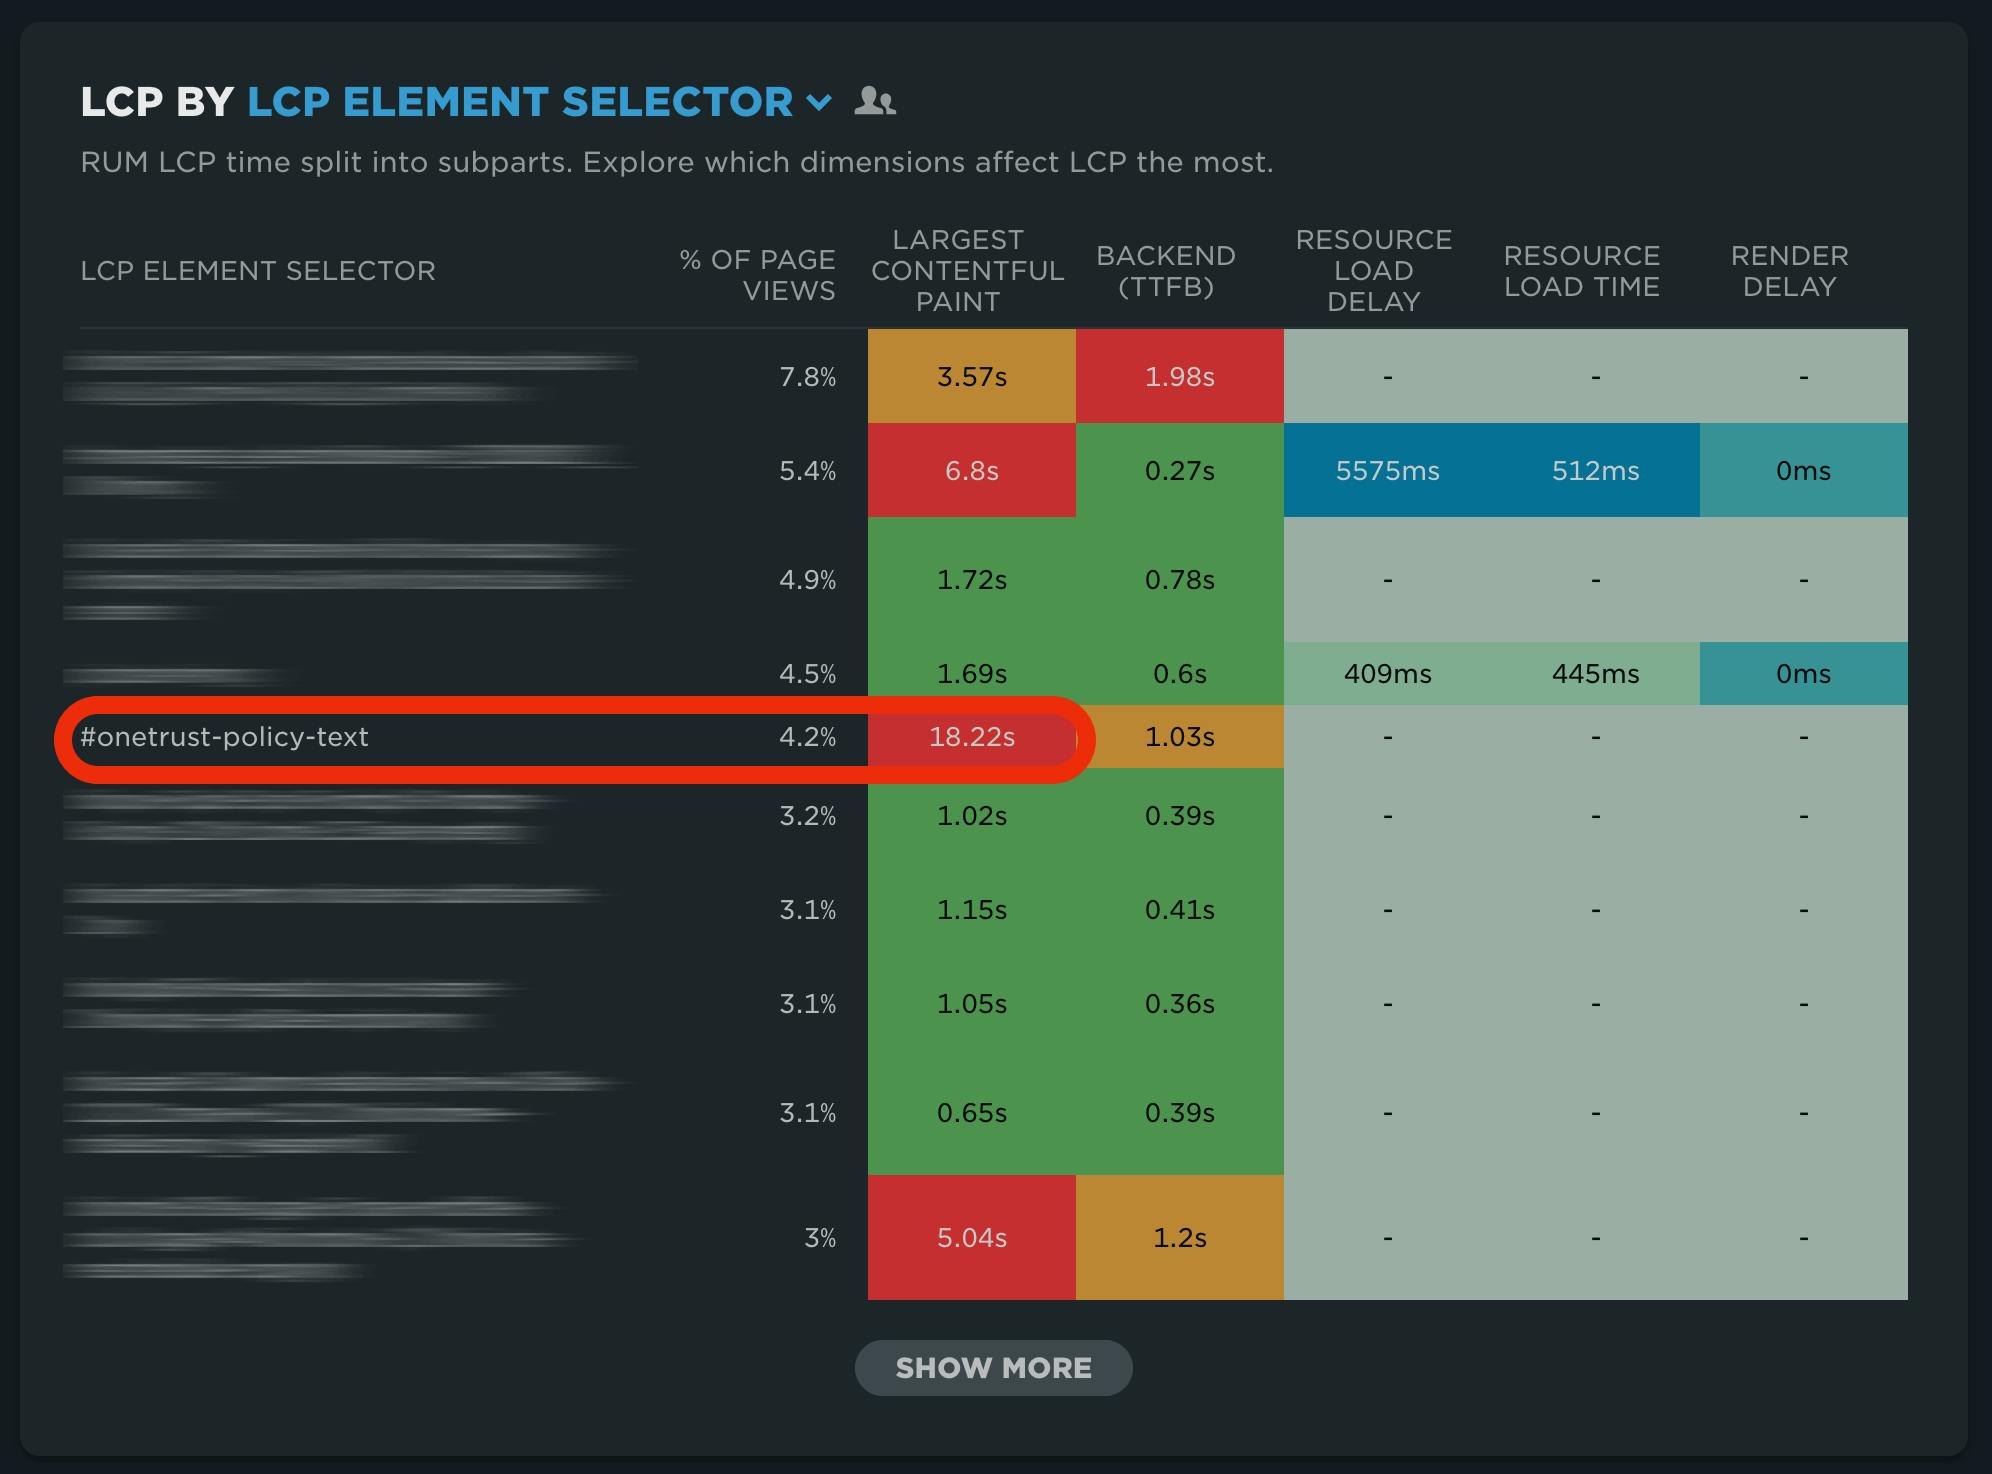
After re-filtering the dashboard to the home page, the updated heat map (below) shows the most problematic LCP elements on the page. Surprise, there are many!
The LCP element is not necessarily going to be consistent across experiences, even for the same page. As shown, the text element for the cookie consent dialog is the biggest offender, but this might not always be the case (when users are already opted-in, for example).
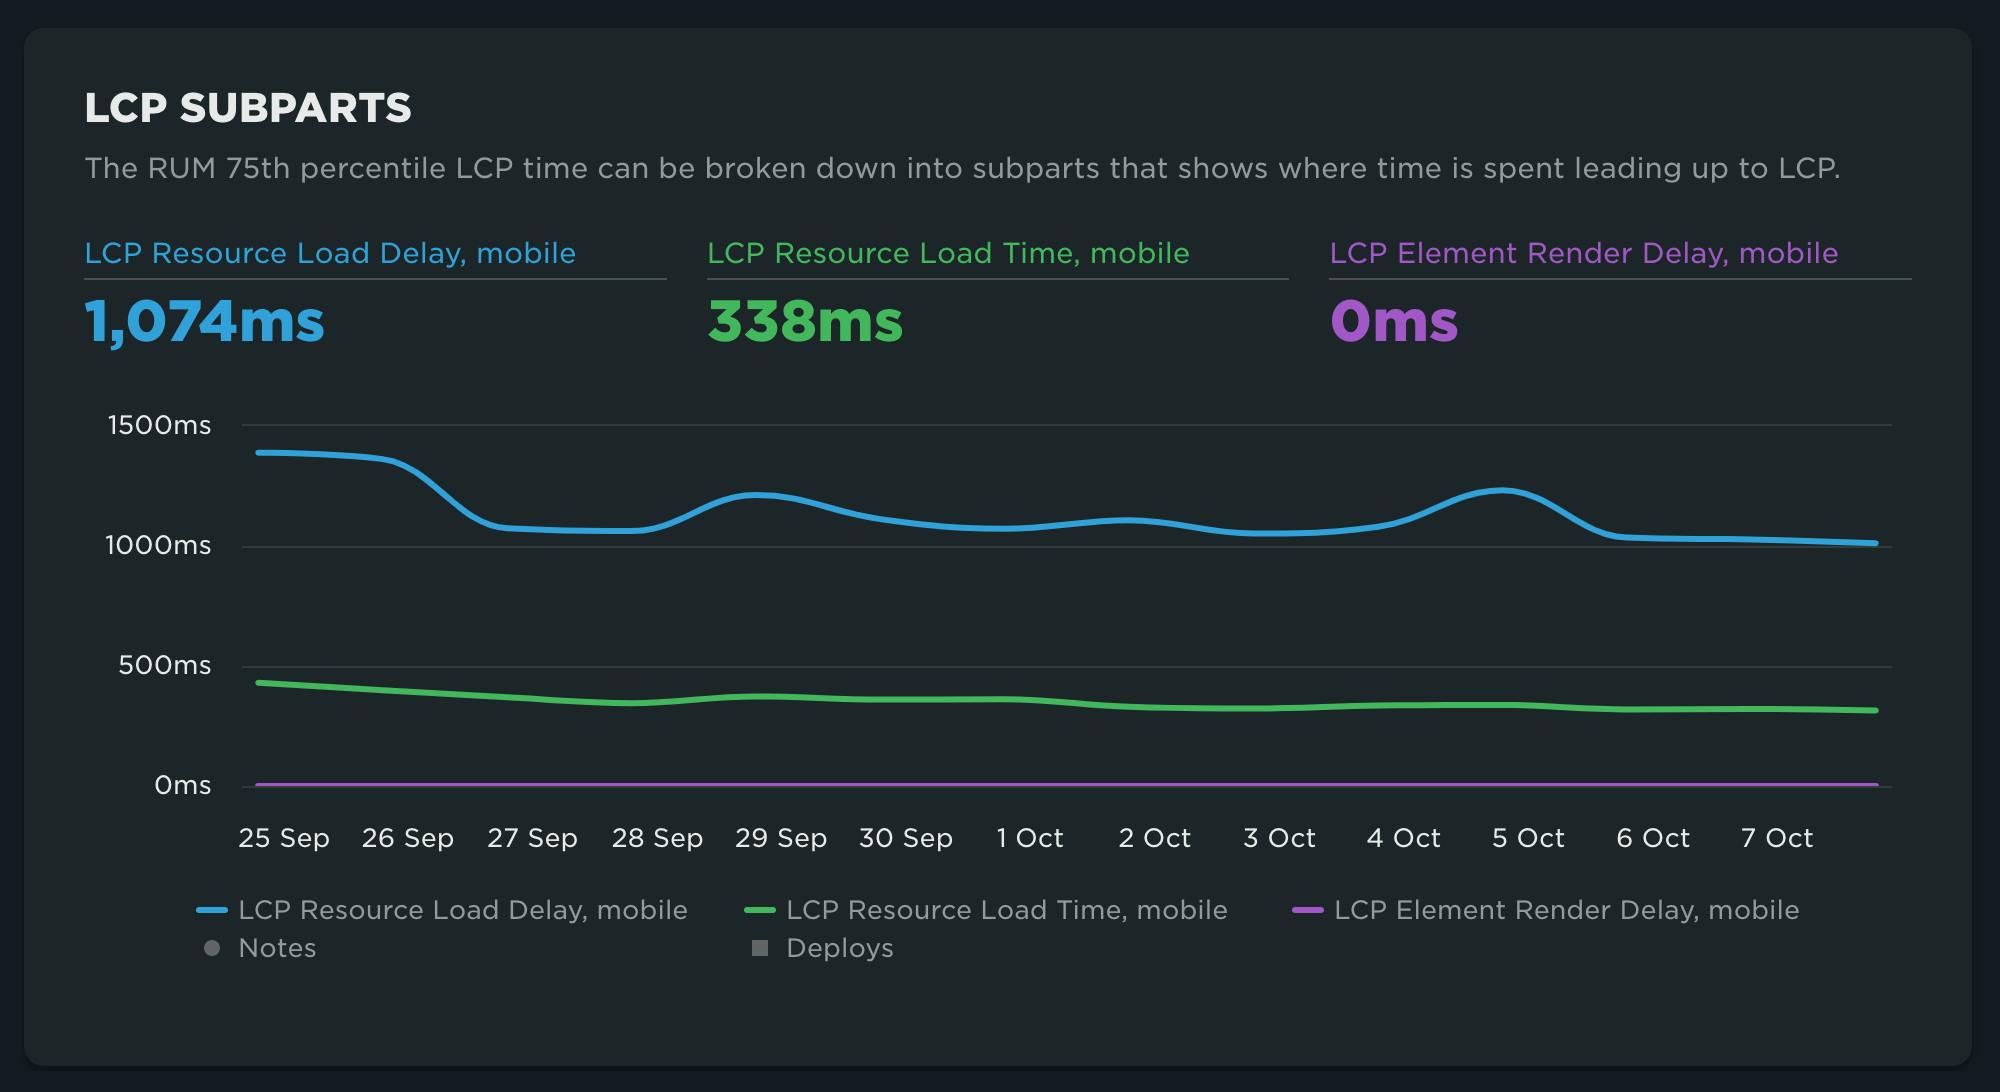
7. View data for subparts
The subparts data isn't necessarily relevant for the text element identified above, but for other elements, such as images, we can see how each subpart is trending over time to identify any regressions that may have been introduced by a recent change.
8. See visualizations of problem areas on the page
Our synthetic data gives us even more diagnostic detail, including visual identification of the LCP element, framed in red below.

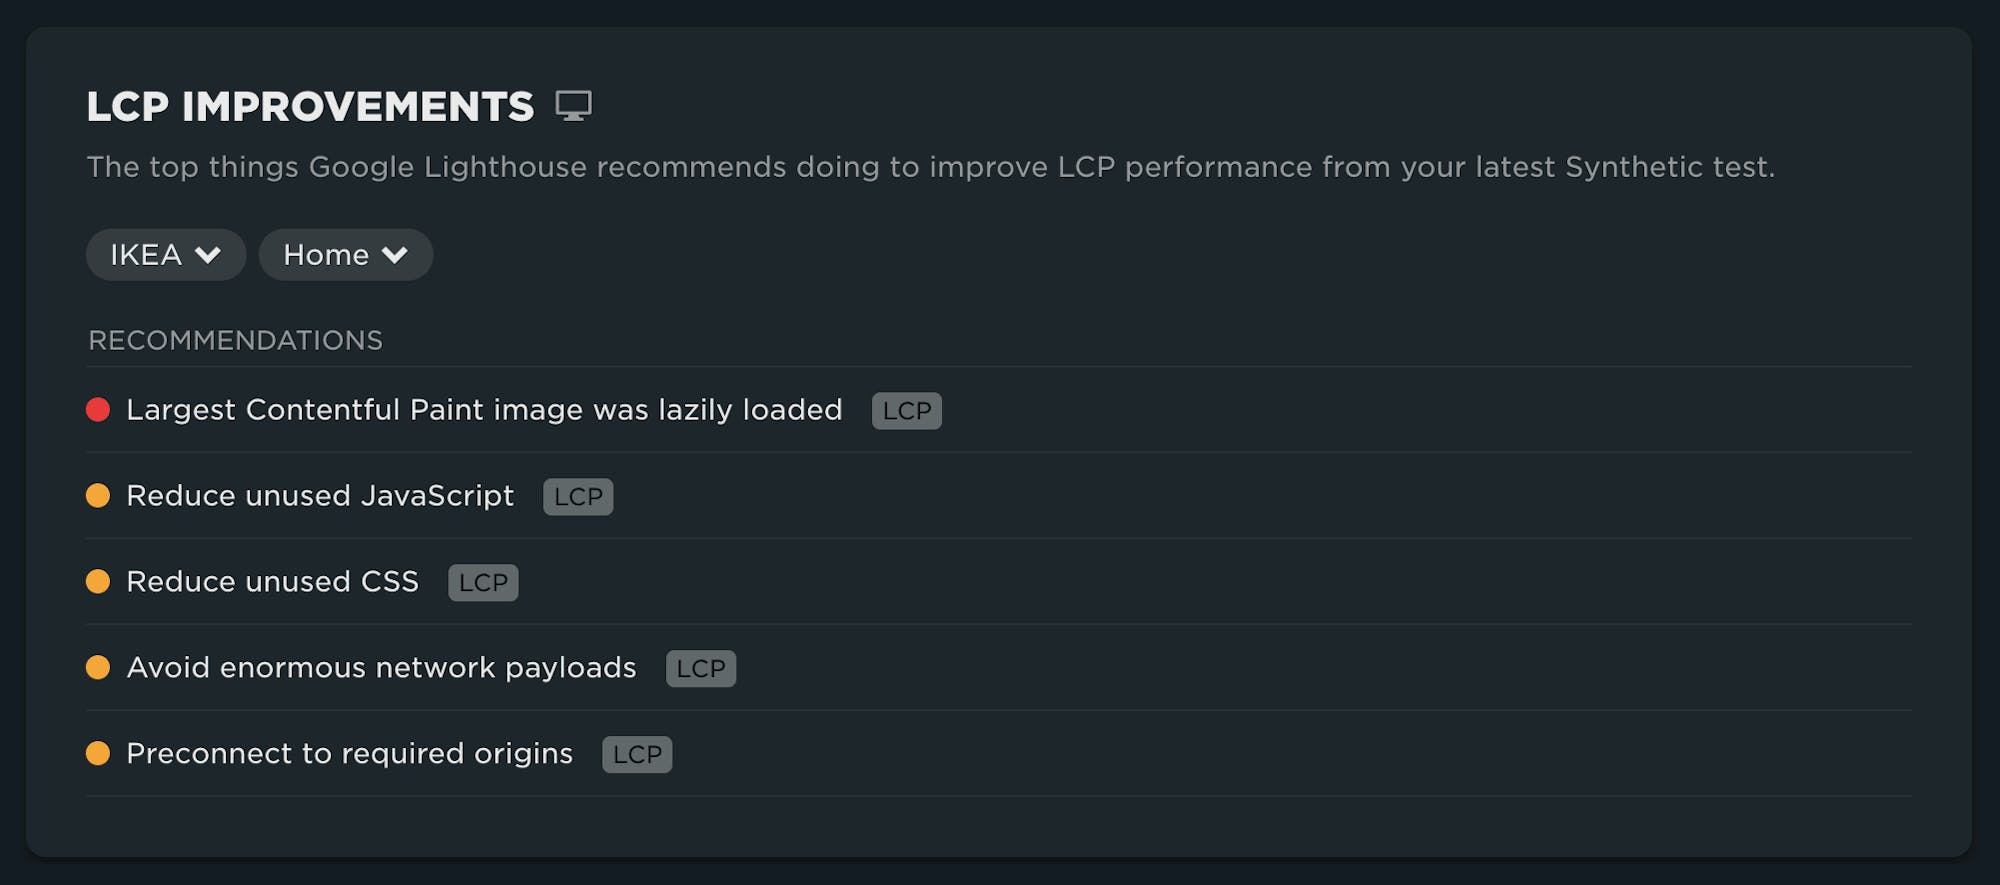
9. Get detailed diagnostics, so you know HOW to fix issues
Finally, the improvements specific to LCP for this page are shown. Maybe there is some low-hanging fruit here. (I'm looking at you, lazy-loaded LCP image!) This list of optimization suggestions – each of which can be expanded to get more information – is a good jumping-off point for making improvements.
Unified filtering
“Consistency is one of the most powerful usability principles: when things always behave the same, users don’t have to worry about what will happen.” - Jakob Nielson
SpeedCurve is now eleven years old. One of the things we love so much about our product is how it's evolved over time. However, in some cases, parts of the UI didn't come along for the ride. This was the case with our dashboard filters. This has been a nagging 'to-do' that we've finally checked off our list, courtesy of our awesome dev team.
You'll find that our filters now work the same way across ALL of your dashboards.
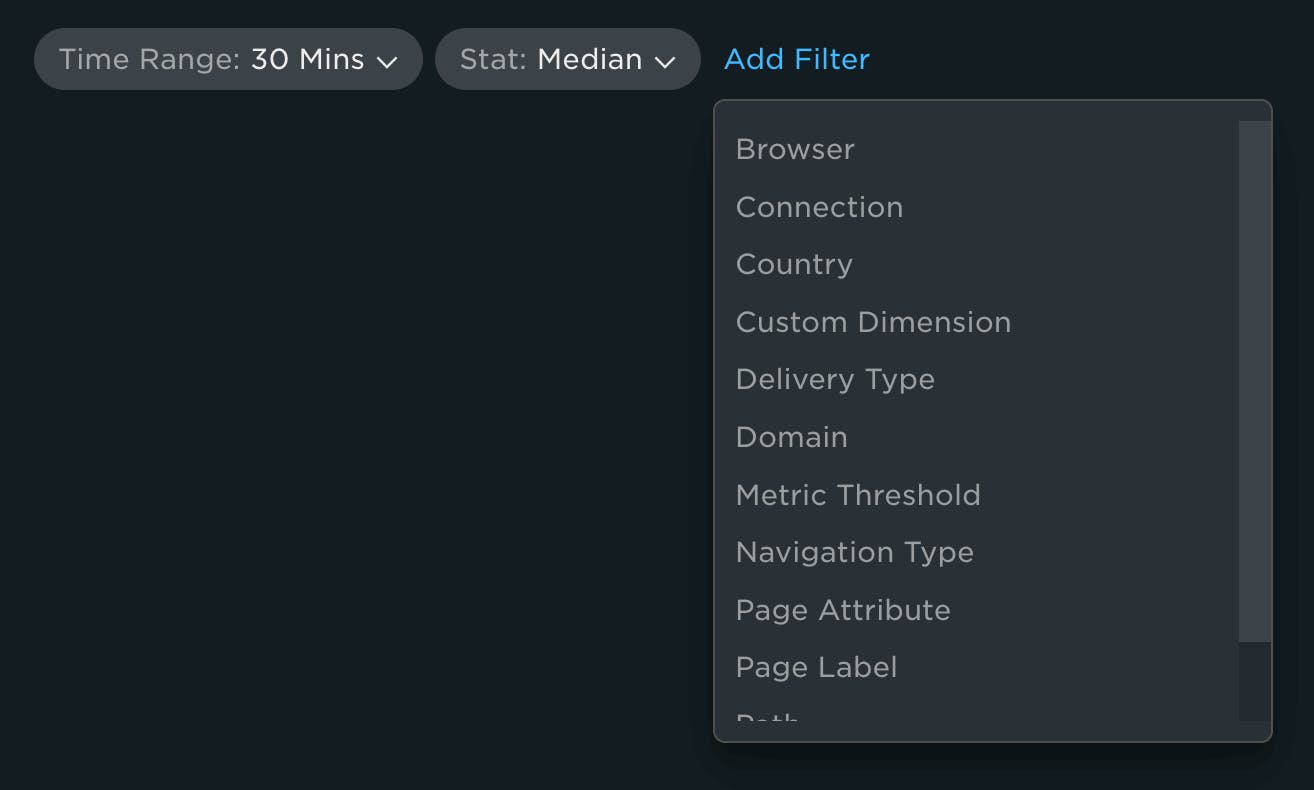
As a VERY big bonus, you'll find more options available on most dashboards, including Favorites.
There have been many user requests for filter option updates to specific dashboards. We think we've hit them all, but if we missed anything, let us know!
We hope you enjoy the latest updates. Keep the feedback coming – and go hug a developer today!