NEW: Paper cuts update!

Paper cut: (literal) A wound caused by a piece of paper or any thin, sharp material that can slice through skin. (figurative) A trivial-seeming problem that causes a surprising amount of pain.

We all love big showy features, and this year we've released our share of those. But sometimes it's the small stuff that can make a big difference. We recently took a look at our backlog of smaller requests from our customers – which we labelled "paper cuts" – and decided to dedicate time to tackle them.
Are they all glamorous changes? Maybe not, though some are pretty exciting.
Are they worthy of a press release? Ha! We don't even know how to issue a press release.
Will they make your day better and put a smile on your face? We sure hope so.
In total, our wonderful development team tackled more than 30 paper cuts! These include:
- Exciting new chart types for Core Web Vitals and User Happiness
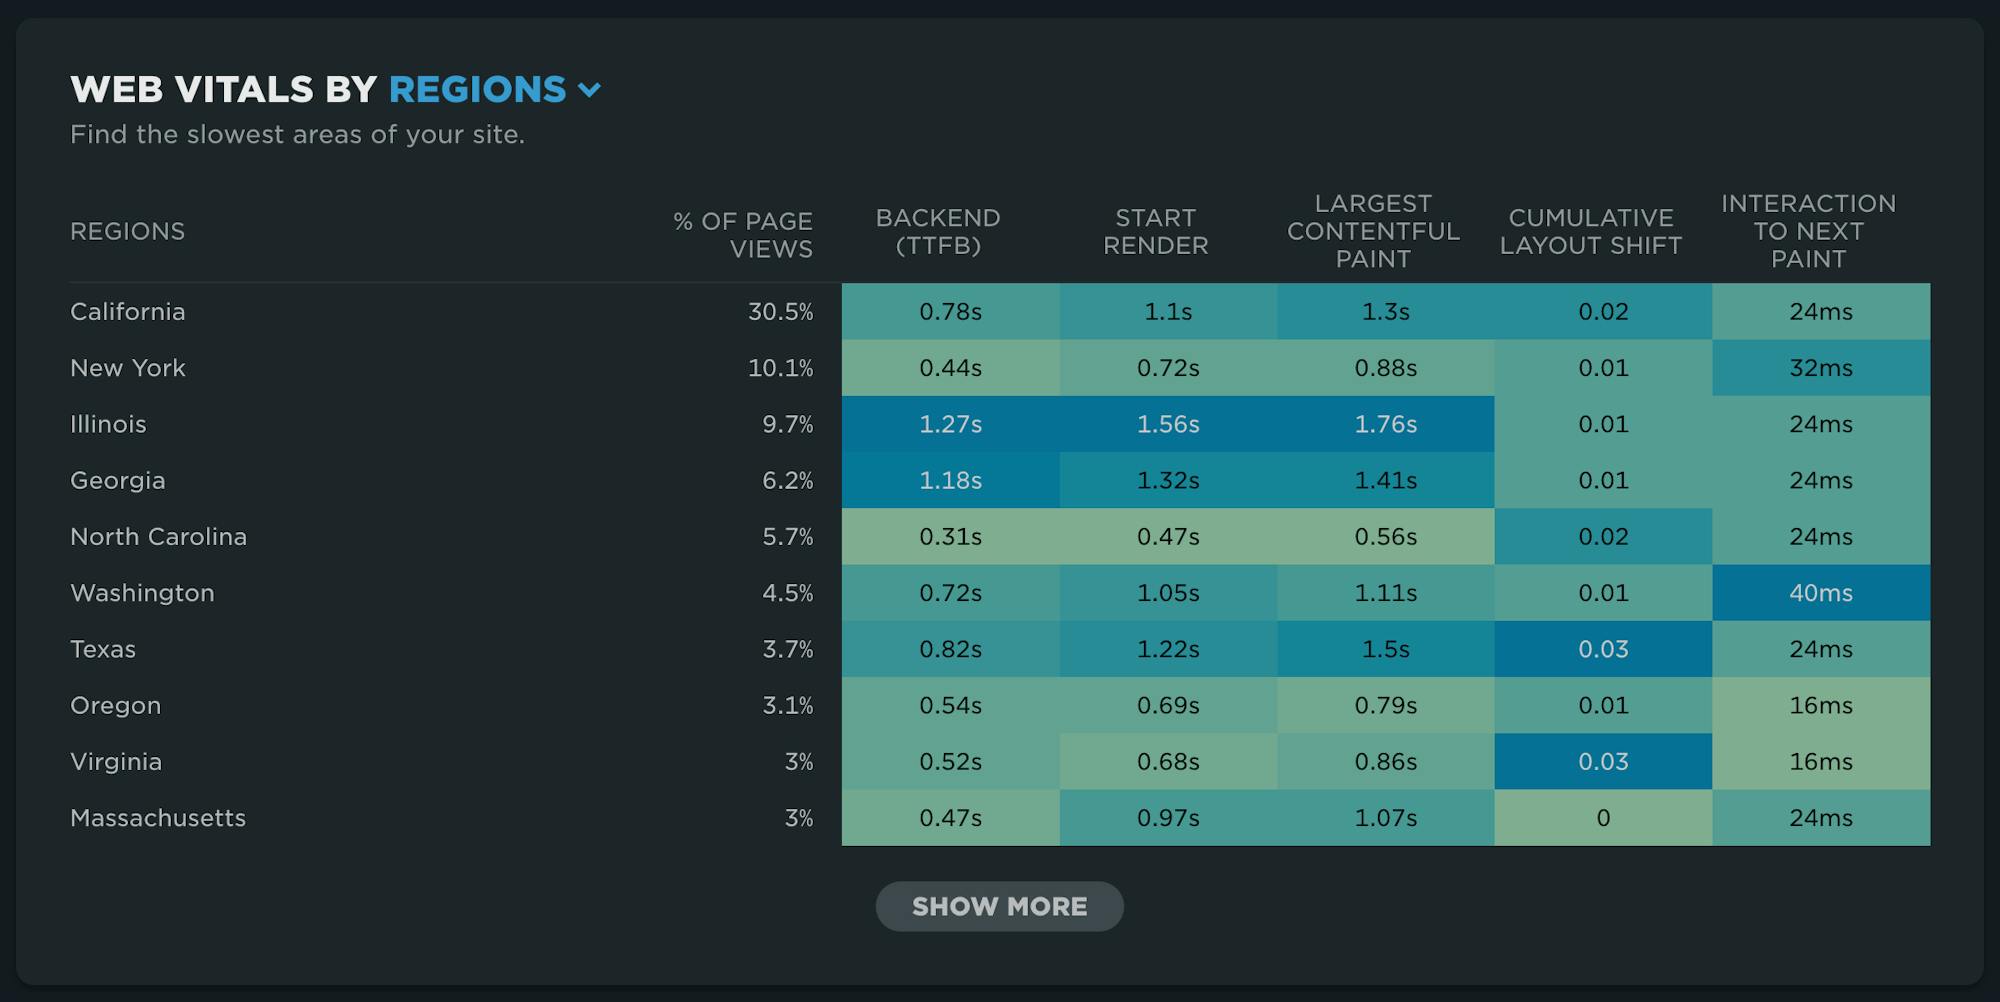
- Filter RUM data by region
- Create a set of tests for one or multiple sites or custom URLs
- Test directly from your site settings when saving changes
- Usability improvements
- Better messaging for test failures
- And more!
Keep scrolling for an overview of some of the highlights.
On-demand testing updates
This has been an area we've focused on a lot this year. We made a lot of updates to the Test Now functionality back in February of this year. One of the biggest requests from our users was the ability to test a single url within a site. Using the 'Test Now' modal, you can now select anywhere from one to many URLs to test on demand.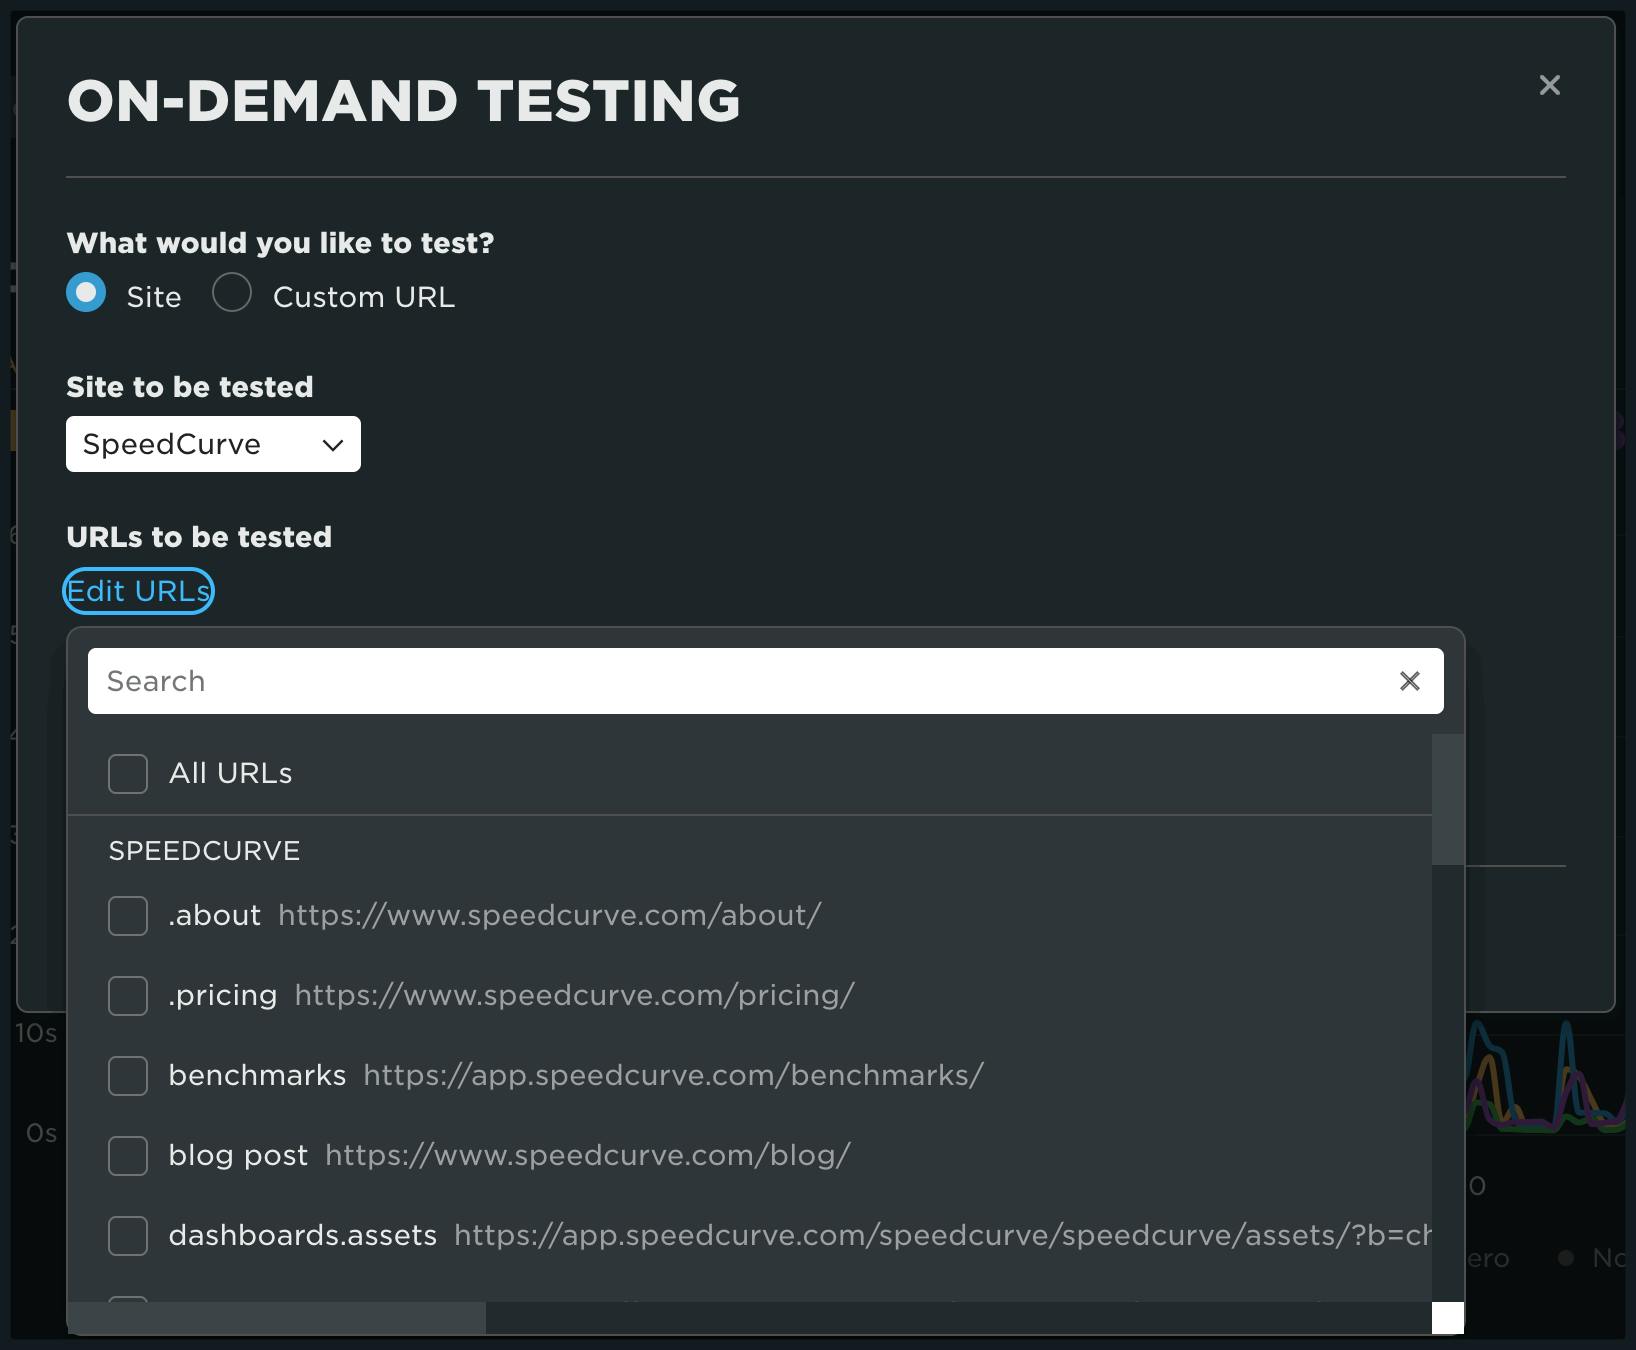
In addition, we've given you the ability to test directly from your site settings when saving changes.

If you are a user of our API, make sure you check out the new snapshots endpoint in our v2 API (currently in beta). This endpoint provides the ability to create a set of tests for one or multiple sites or custom URLs.
UI updates
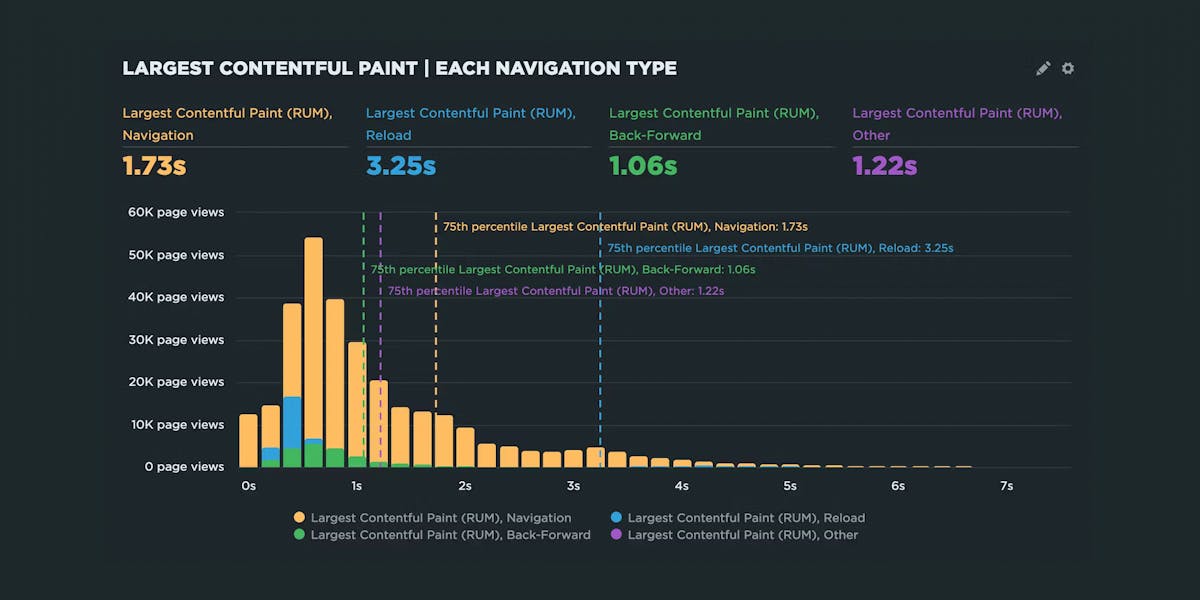
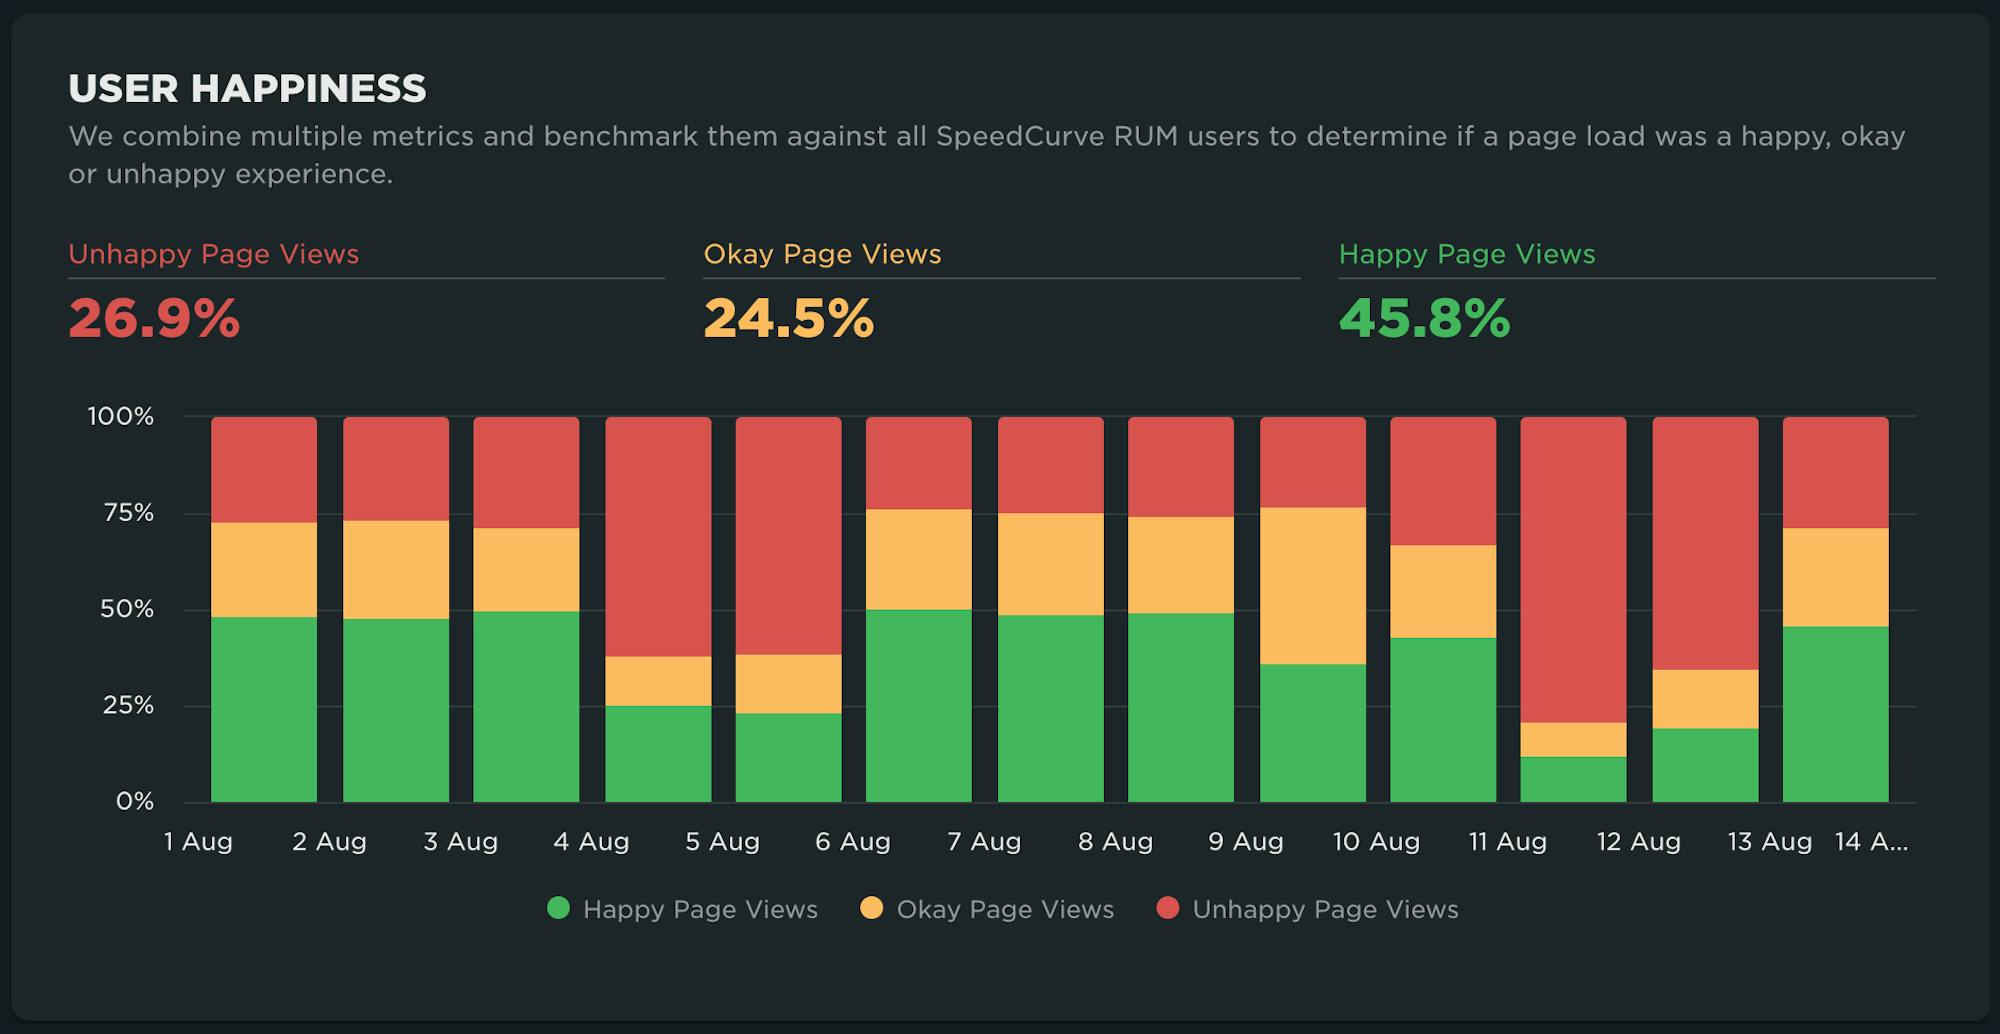
Okay, so maybe this one is a little more flashy than we let on. We've updated our User Happiness and Core Web Vitals RUM time series charts to 100% stacked column charts in our Performance and Users dashboards. This gives you the ability to see the distribution of users in each bucket of User Happiness, as well as thresholds for Core Web Vitals.
In addition, we've added page views time series data to our Core Web Vitals time series charts. This is incredibly helpful and adds a layer of context to the data. A common pattern is seeing metrics degrade during low traffic times due to the size of the sample, caching inefficiency (for example, cold CDN cache), and routine maintenance.

Regional performance
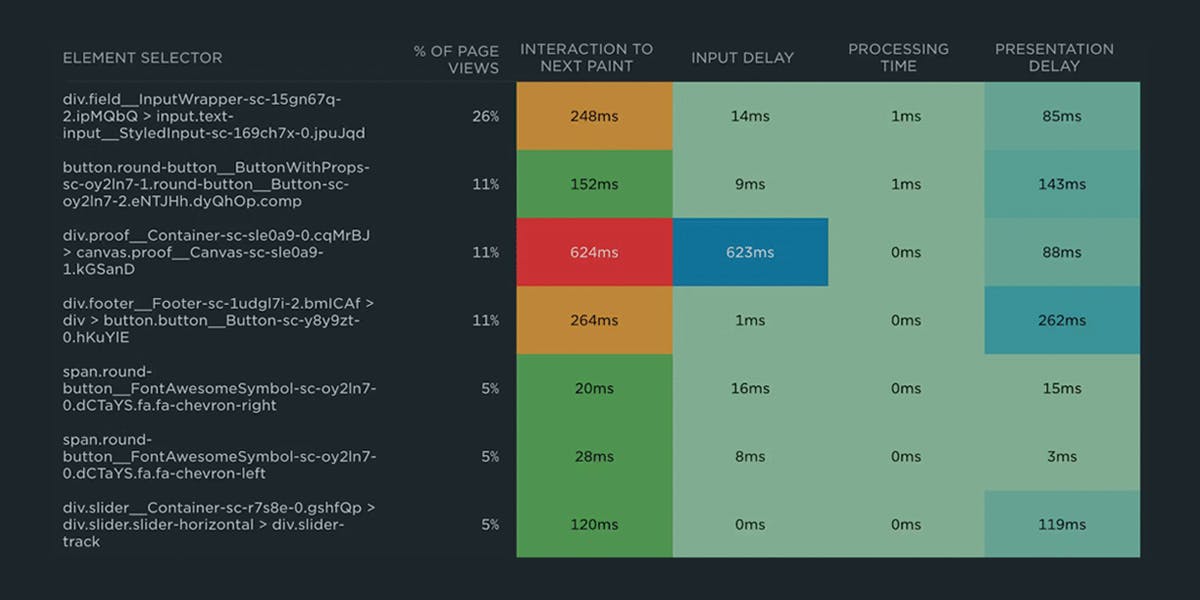
We've had the ability to segment data by country since the inception of RUM. We are now exposing the second-level geography (region) in our tables in the Performance dashboard. For customers looking to move more to the edge and get the most from their investment in distributed computing and content delivery networks, having an understanding of how pages perform within the borders of a country is extremely useful.
A whole lot more...
There were more than 30 paper cuts tackled by our wonderful development team. These included usability improvements, better messaging for test failures additional filtering options and more. We hope you enjoy these updates. We really enjoyed tackling them.
Have a paper cut you'd like us to tackle? Let us know!