Six things that slow down your site's UX (and why you have no control over them)

Have you ever looked at the page speed metrics – such as Start Render and Largest Contentful Paint – for your site in both your synthetic and real user monitoring tools and wondered "Why are these numbers so different?"

Photo by Freepik
Part of the answer is this: You have a lot of control over the design and code for the pages on your site, plus a decent amount of control over the first and middle mile of the network your pages travel over. But when it comes to the last mile – or more specifically, the last few feet – matters are no longer in your hands.
Your synthetic testing tool shows you how your pages perform in a clean lab environment, using variables – such as browser, connection type, even CPU power – that you've selected.
Your real user monitoring (RUM) tool shows you how your pages perform out in the real world, where they're affected by a myriad of variables that are completely outside your control.
In this post we'll review a handful of those performance-leaching culprits that are outside your control – and that can add precious seconds to the amount of time it takes for your pages to render for your users. Then we'll talk about how to use your monitoring tools to understand how your real people experience your site.
Consider this scenario...

Photo by andreas on Freepik
- Someone visits your site on their family computer, which is shared by four people.
- The computer is a MacBook Pro they bought in 2018, so it still feels newish to them. (They have no plans to replace it any time soon. Kids can be rough on laptops!)
- The primary browser is Chrome 108 (circa 2022) with a half-dozen nifty toolbar add-ons, including social widgets and a parental control plugin.
- Each family member has their own browser window with anywhere between 10-20 tabs open at any given time. They keep the same browser window open for days or weeks (sometimes even months) on end.
- They tend to leave all their other applications open, for easy access. This includes MS Word and Excel, PS Elements, Zoom, and Stop Motion Studio (for the kids!). They're concerned about internet security, so they'e also running antivirus software.
- They think they have high-speed internet because they're paying their service provider for it, but they're using an eight-year-old modem.
- They only restart their machine when it's running so slowly that it becomes intolerable — or when it crashes.
If a crash happens when they're on your site, your user doesn't blame any of the factors listed above. Chances are they blame your site. This holds true for slowdowns as well.
Is this fair? Not really.
It's also not fair that those lost seconds and lost visitors could result in lost revenue for your company, but this is the world we live in.
Let's go into more detail about end-user performance culprits.
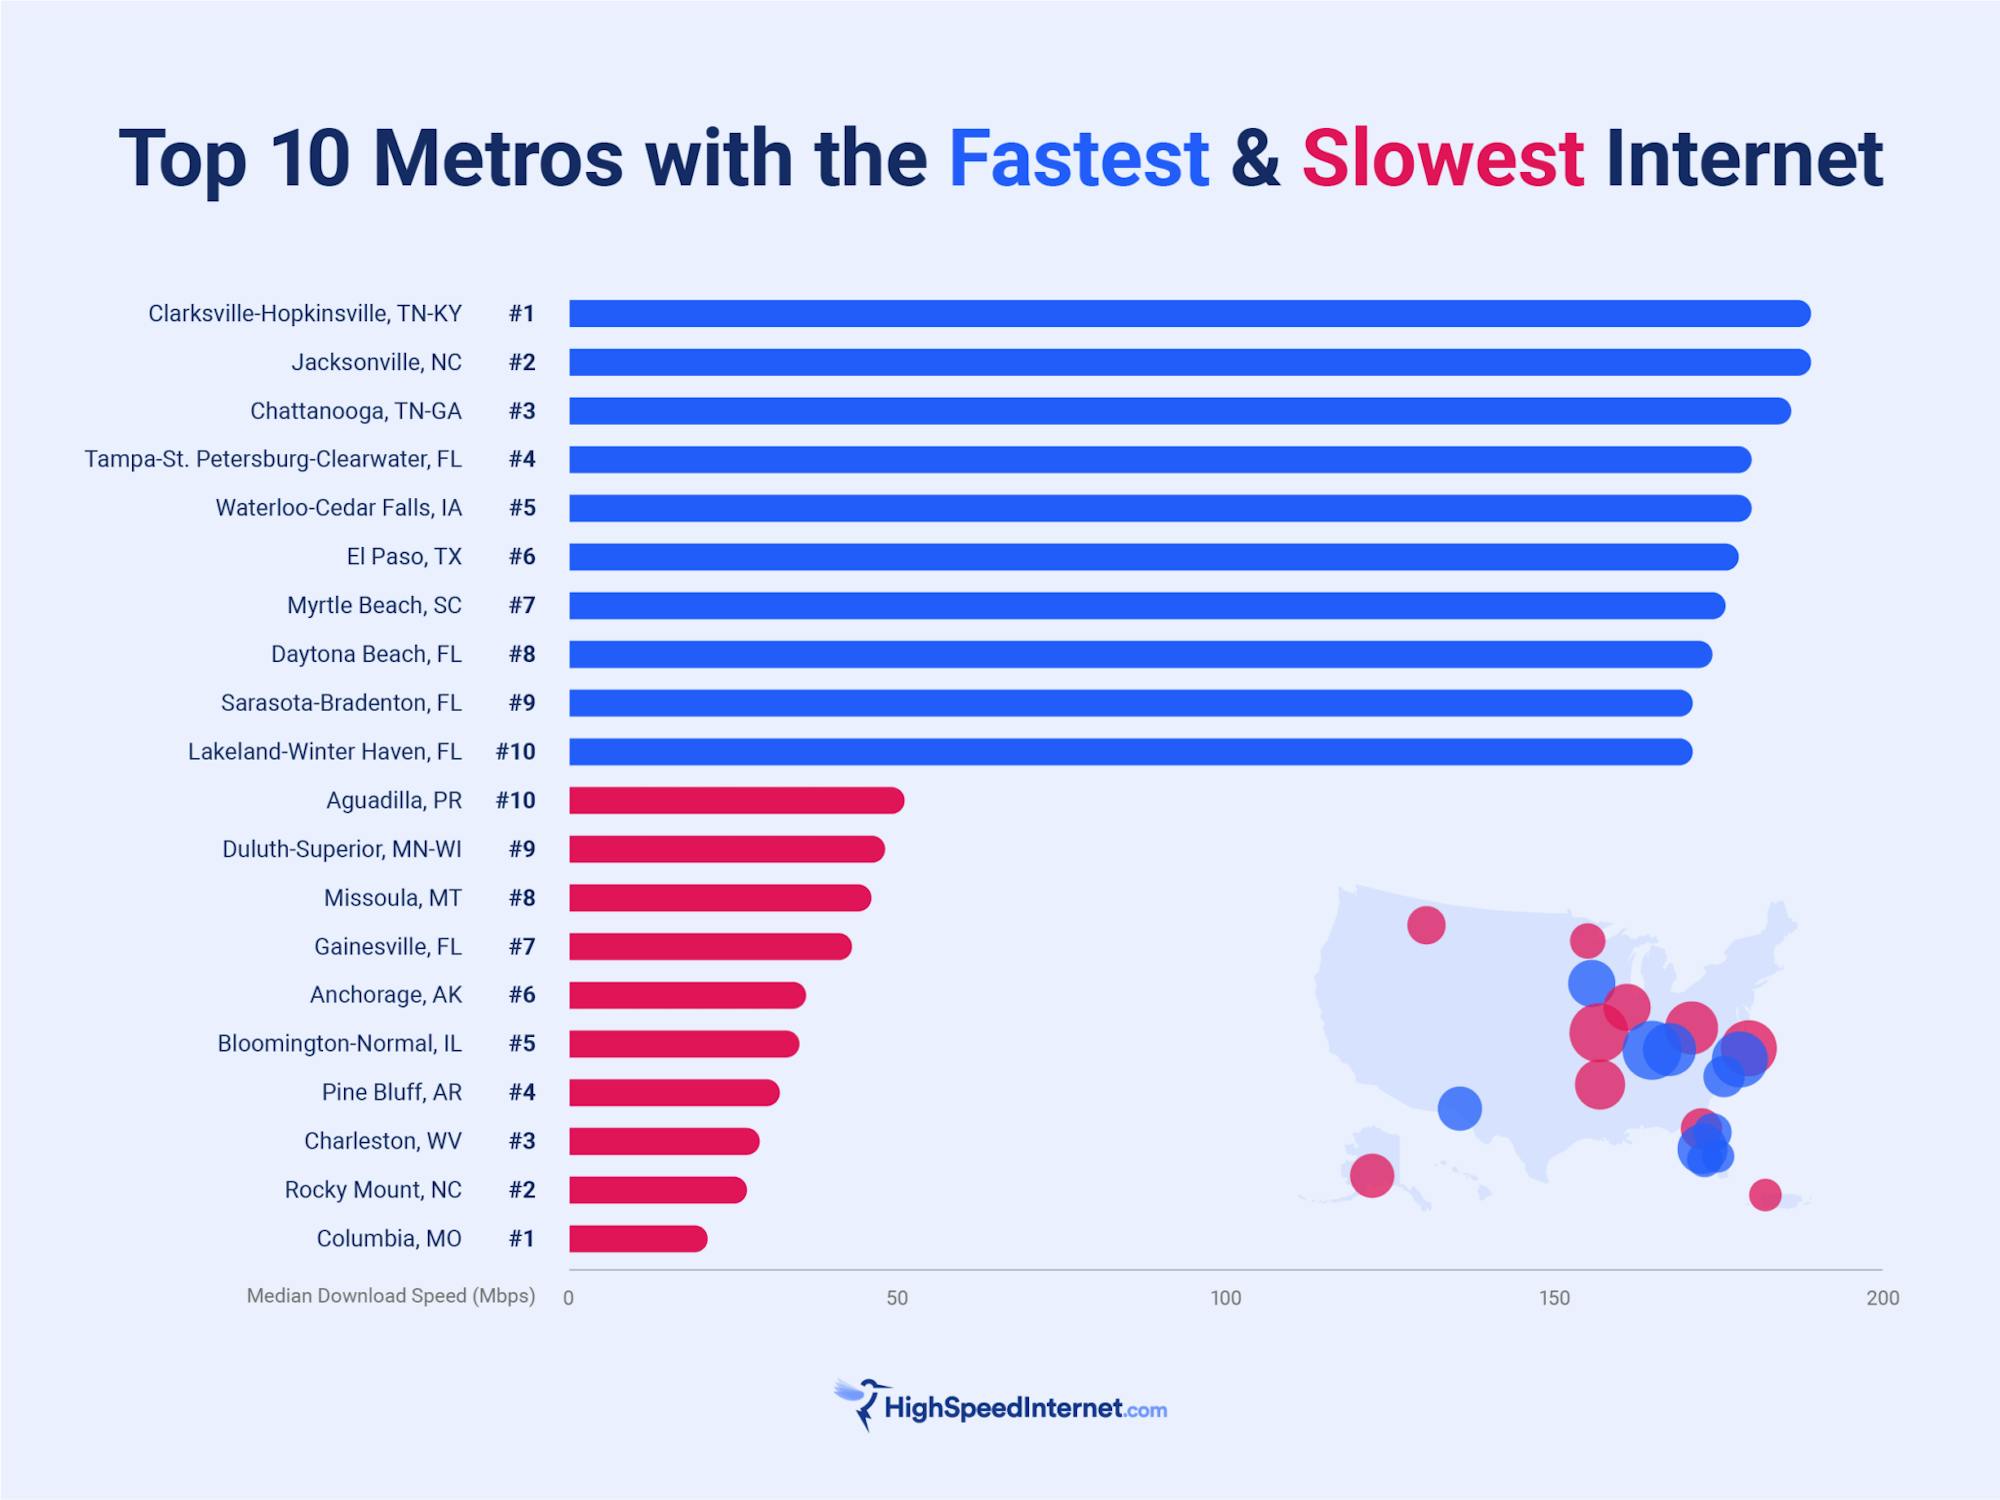
1. End-user connection speed
If you live in an urban centre, you may enjoy connection speeds of 150 Mbps or more. You may find it hard to believe that there are still many rural communities where internet users typically experience connection speeds of just 6-10 Mbps. And as the graph below shows, even some urban centres can suffer download speeds as low as 20 Mbps.
Here are some minimum download speed requirements for common online activities:
- Check email and basic web browsing: 0.5-1 Mbps
- Music streaming: 1-2 Mbps
- SD video streaming: 2-3 Mbps
- Video calls and gaming: 3-5 Mbps
- HD video streaming: 5-25 Mbps
- Stream 4K content and play competitive online games: 25-50 Mbps
Keep in mind that the numbers above are bare minimums. Meeting these thresholds does not guarantee an optimal experience.
The number of internet users in your house could increase your download speed needs by 2X or more. If multiple people are using the connection at the same time – which is more common than not – then your requirements could be double, or even triple, the numbers listed above.
Smart devices also affect connection speeds. The connected devices in your home – such as smart thermostats, lighting, and security systems – are all quietly consuming more bandwidth in the background.
2. Older hardware
If you subscribe to faster service through your ISP, but you're using an older modem and/or an older router, you may not be getting the service you're paying for. For a myriad of reasons, older hardware can't always accommodate faster speeds.
Most people use the same hardware for between five to ten years. It's recommended that you replace your modem and router at least every five years – or even as often as two or three years, depending on the quality of the hardware and how it's treated during its lifespan. (Despite this, I’ve yet to encounter an ISP that proactively reminds customers to upgrade their hardware.)
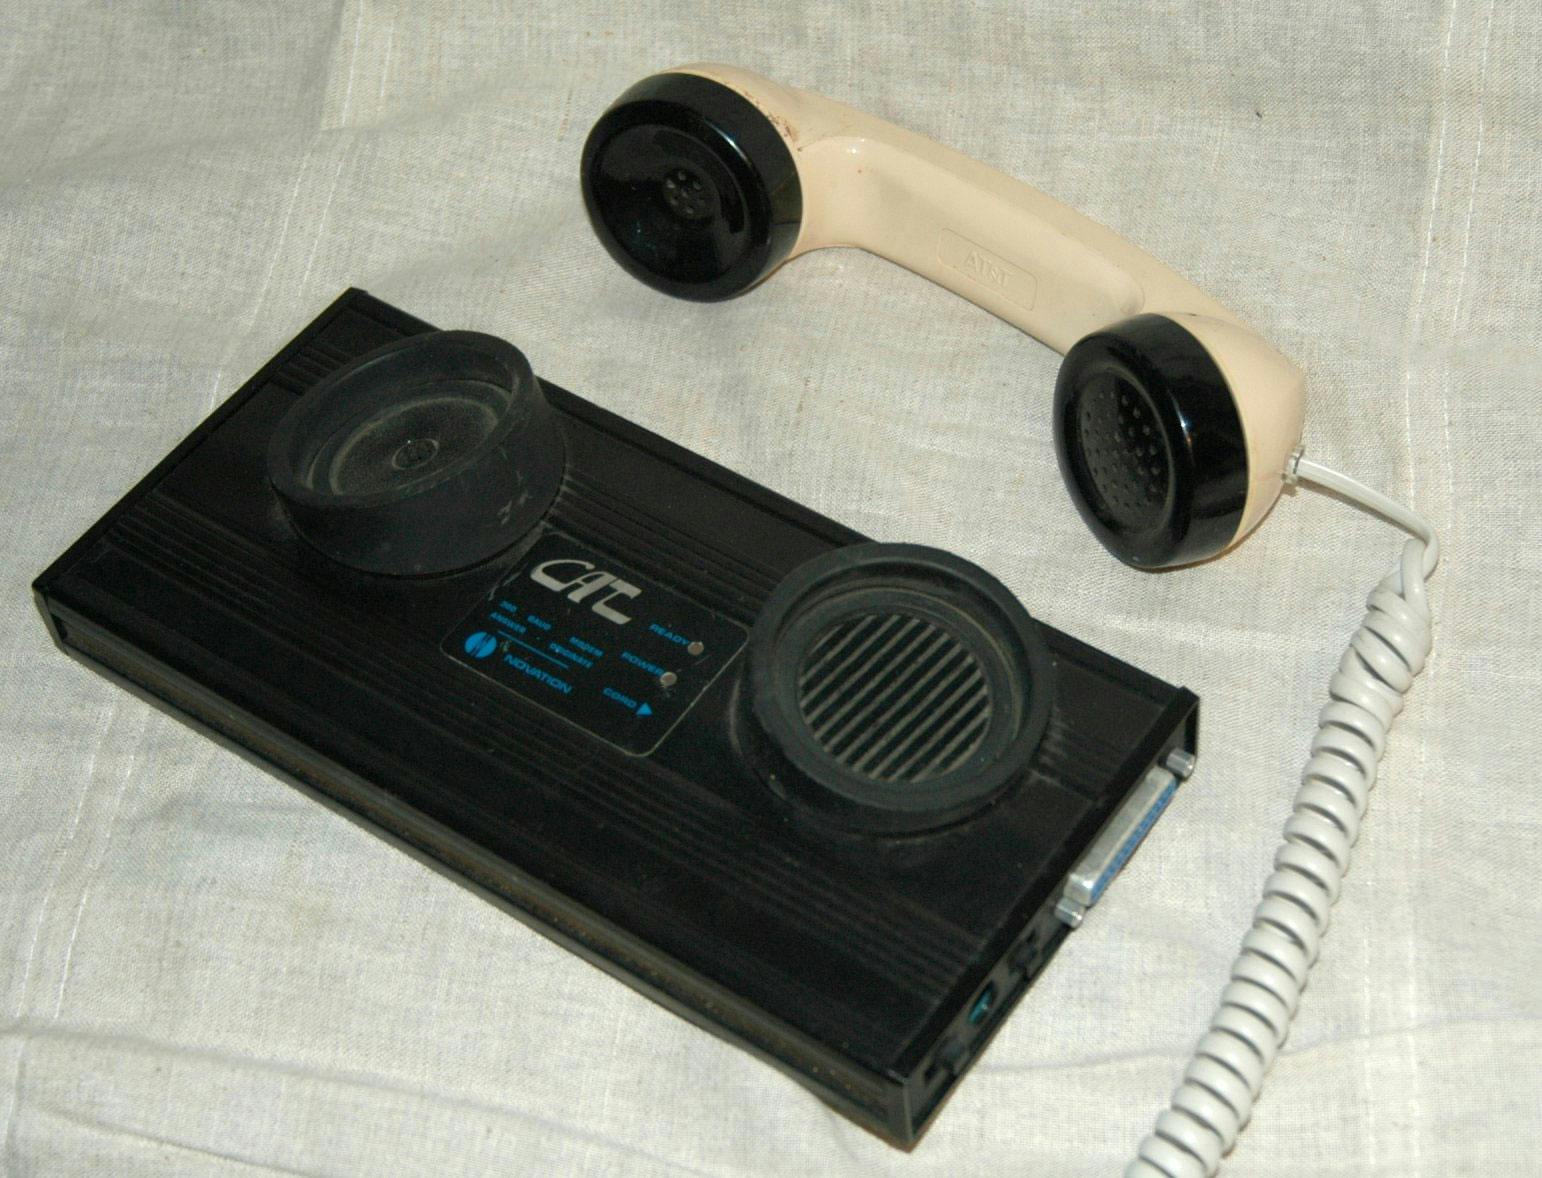
If your modem looks like this, replace it immediately.
Specifications and standards are in flux. Back around 2011, most cable companies made the switch from DOCSIS 2.0 to DOCSIS 3.0. (DOCSIS stands for "data over cable service interface specifications".) If you're not using a DOCSIS 3.0 or 3.1 modem, then you haven't been fully leveraging your high-speed plan.
We don't know how many users are still using DOCSIS 2.0. While it's to be hoped that most internet users are using DOCSIS 3.0 at minimum, there's definitely no guarantee. I searched for numbers on how many people might still be using DOCSIS 2.0, but couldn't find anything. But given that a non-trivial number of people hold on to their modems for 10-15 years, it feels safe to assume that some folks are still using hardware that undermines performance.
(Note that the specs for DOCSIS 4.0 have been released, but DOCSIS 4.0 modems aren't available for retail purchase yet. After DOCSIS 4.0 starts being broadly released – possibly later this year – we should be ready for the same scenario to play out all over again.)
3. Older desktop and mobile devices
While the current "industry standard" sets the lifecycle of a desktop computer at four to five years, data shows that the average person keeps their computer for longer than that.
In the US, the average person replaces their desktop computer every 5.6 years. In those 5.6 years, performance can seriously degrade — sometimes due to viruses or, more commonly, due to simply running low on memory.
5.6 years is just an average. Many people hold on to their computers for much longer. In other words, more than half of the people coming to our sites could be using significantly older devices.
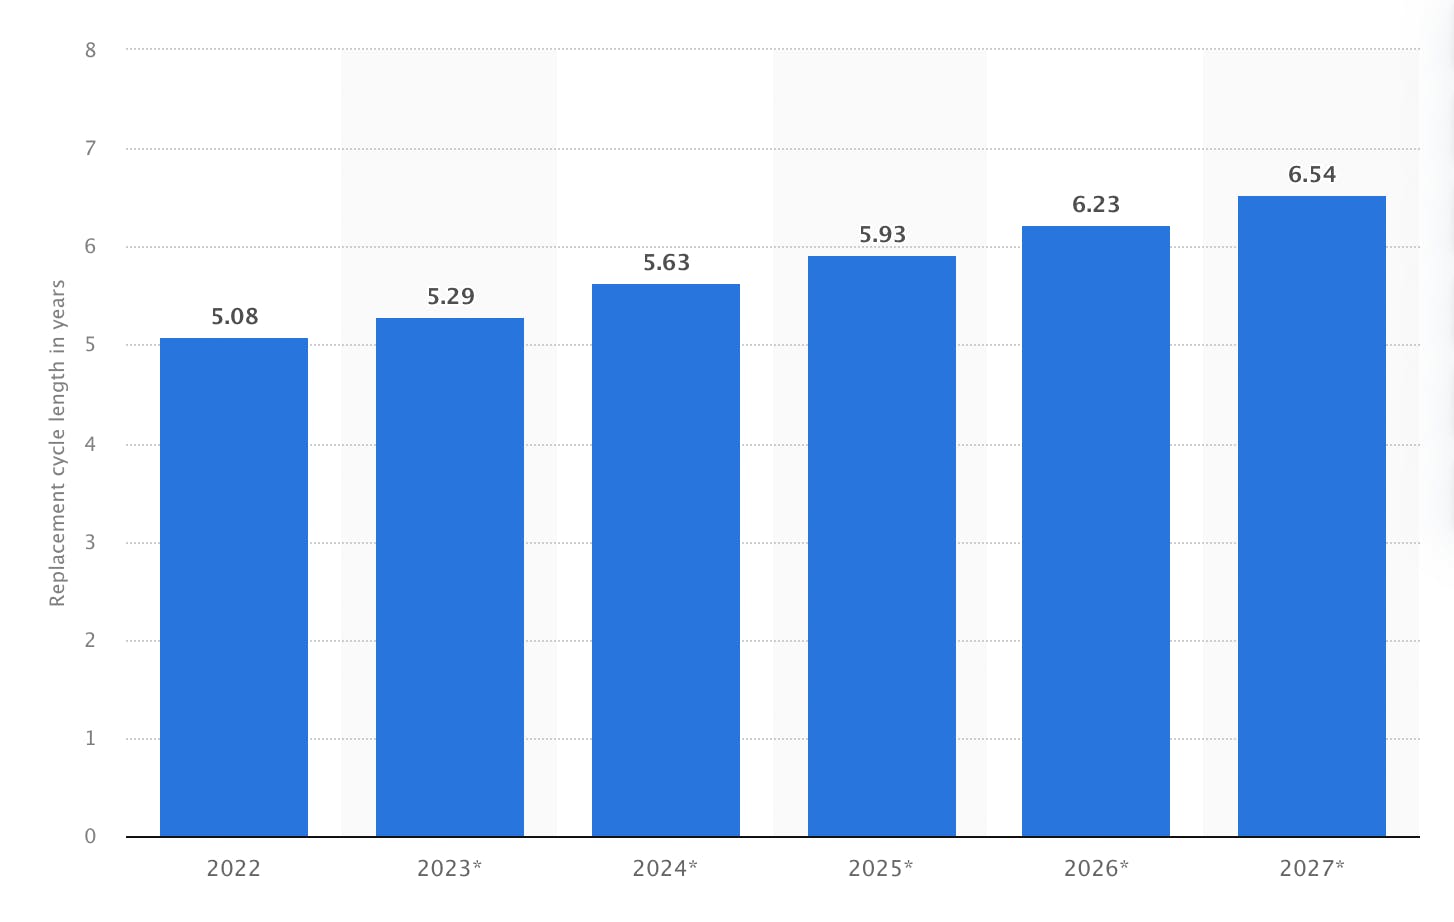
The desktop replacement lifecycle is increasing, not decreasing, over time. According to Statista, the average lifecycle could increase to 6.5 years by 2027.
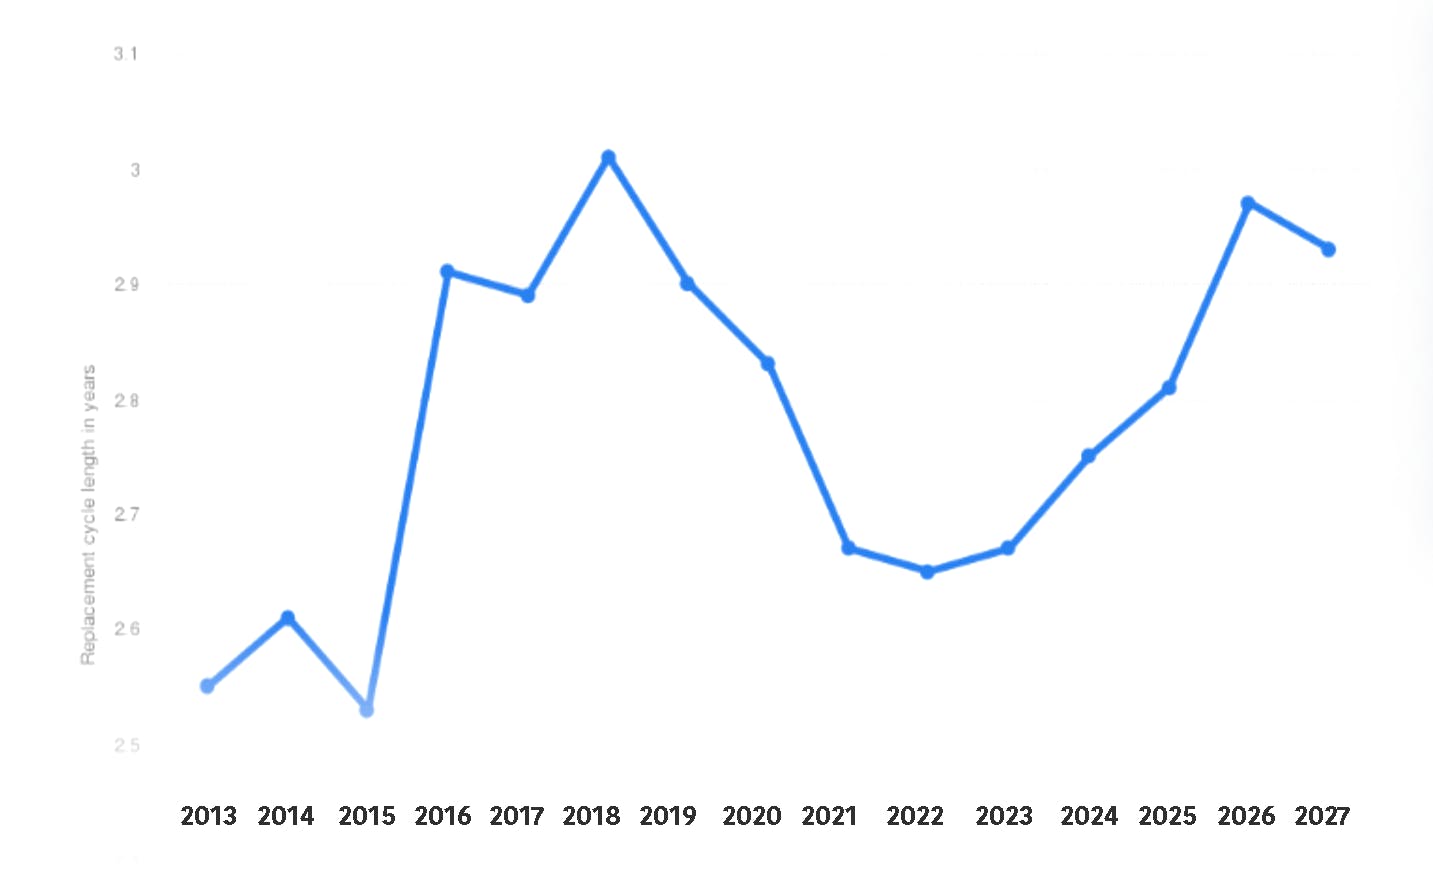
This holds true for smartphones, as well. The smartphone replacement cycle is a fair bit shorter, but the lengthening trend also appears here. In the US, the average expected lifecycle of smartphones is currently around 2.8 years (again according to Statista). In a couple of years, that lifecycle is expected to grow to about three years.
(Personal disclosure: In September 2024, I reluctantly retired my seven-year-old iPhone 7. I mention this for anyone who might not believe that many people choose not to upgrade their phones every couple of years.)
4. Browser version
You upgrade your browser religiously. Many people do not or cannot, so it's unwise to assume that your users are running the latest and greatest version of their chosen browser.
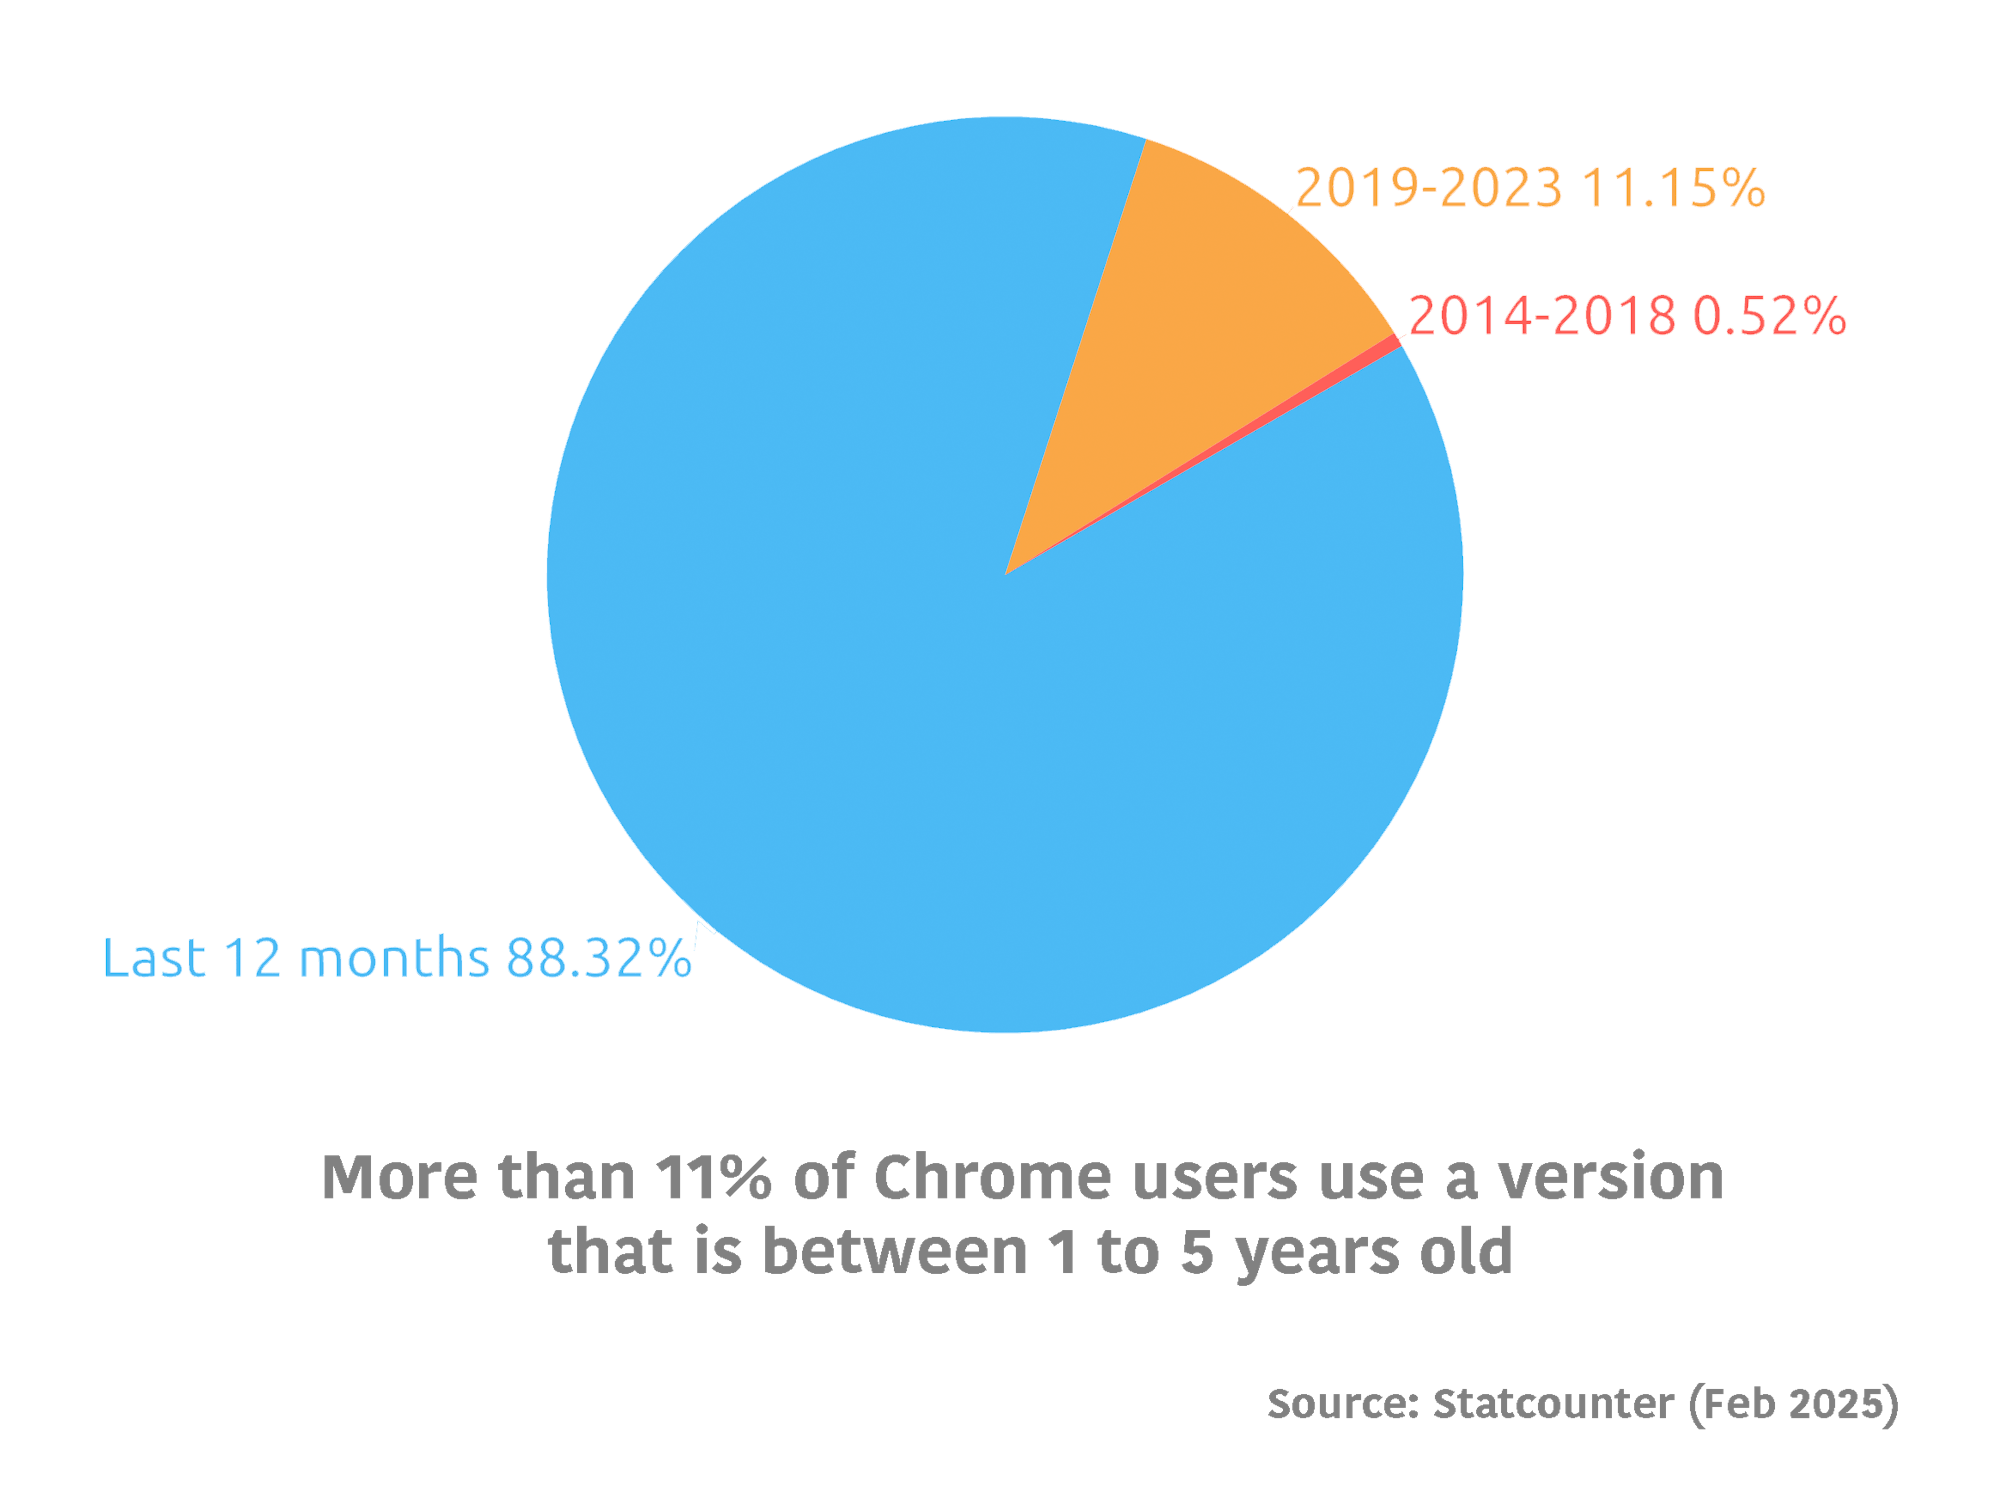
To illustrate, let's look at the latest Chrome stats from Statcounter. Some interesting things to note:
- A small number of users are still using Chrome 39, which was released in 2014.
- Versions 122 to 132 were released over the past 12 months. These are used by 88.32% of Chrome users.
- 11.15% of Chrome users use versions (77 to 120) that were released between 2019 to 2023. In other words, they're using versions that are up to five years old.
- 0.52% of Chrome users are currently using versions that are between 5-10 years old. Does that not sound like much? There are an estimated 3.5 billion Chrome users worldwide, so 0.52% of that is more than 18 million people.
 Why does the age of the browser version matter? Outdated browsers may not support new web technologies and standards, resulting in compatibility issues and slower loading times (not to mention security issues, but that's a whole other problem).
5. Browser use (and abuse)
Browser age is just one issue. There are a number of other variables that can affect browser performance, such as:
- Cache and cookie overload – Most people don't clear their cache and cookies regularly (if at all). Over time, these files pile up and slow down the browser.
- Multiple windows and tabs – Having too many windows and tabs open at once requires more system resources, which leads to slower performance.
- Malware and adware – These can cause a number of problems, including redirects, unwanted popups, and other slowdowns.
- Browser extensions – Not all plugins affect performance, but some definitely do, particularly security plugins. The more plugins, the greater the risk of page slowdowns.
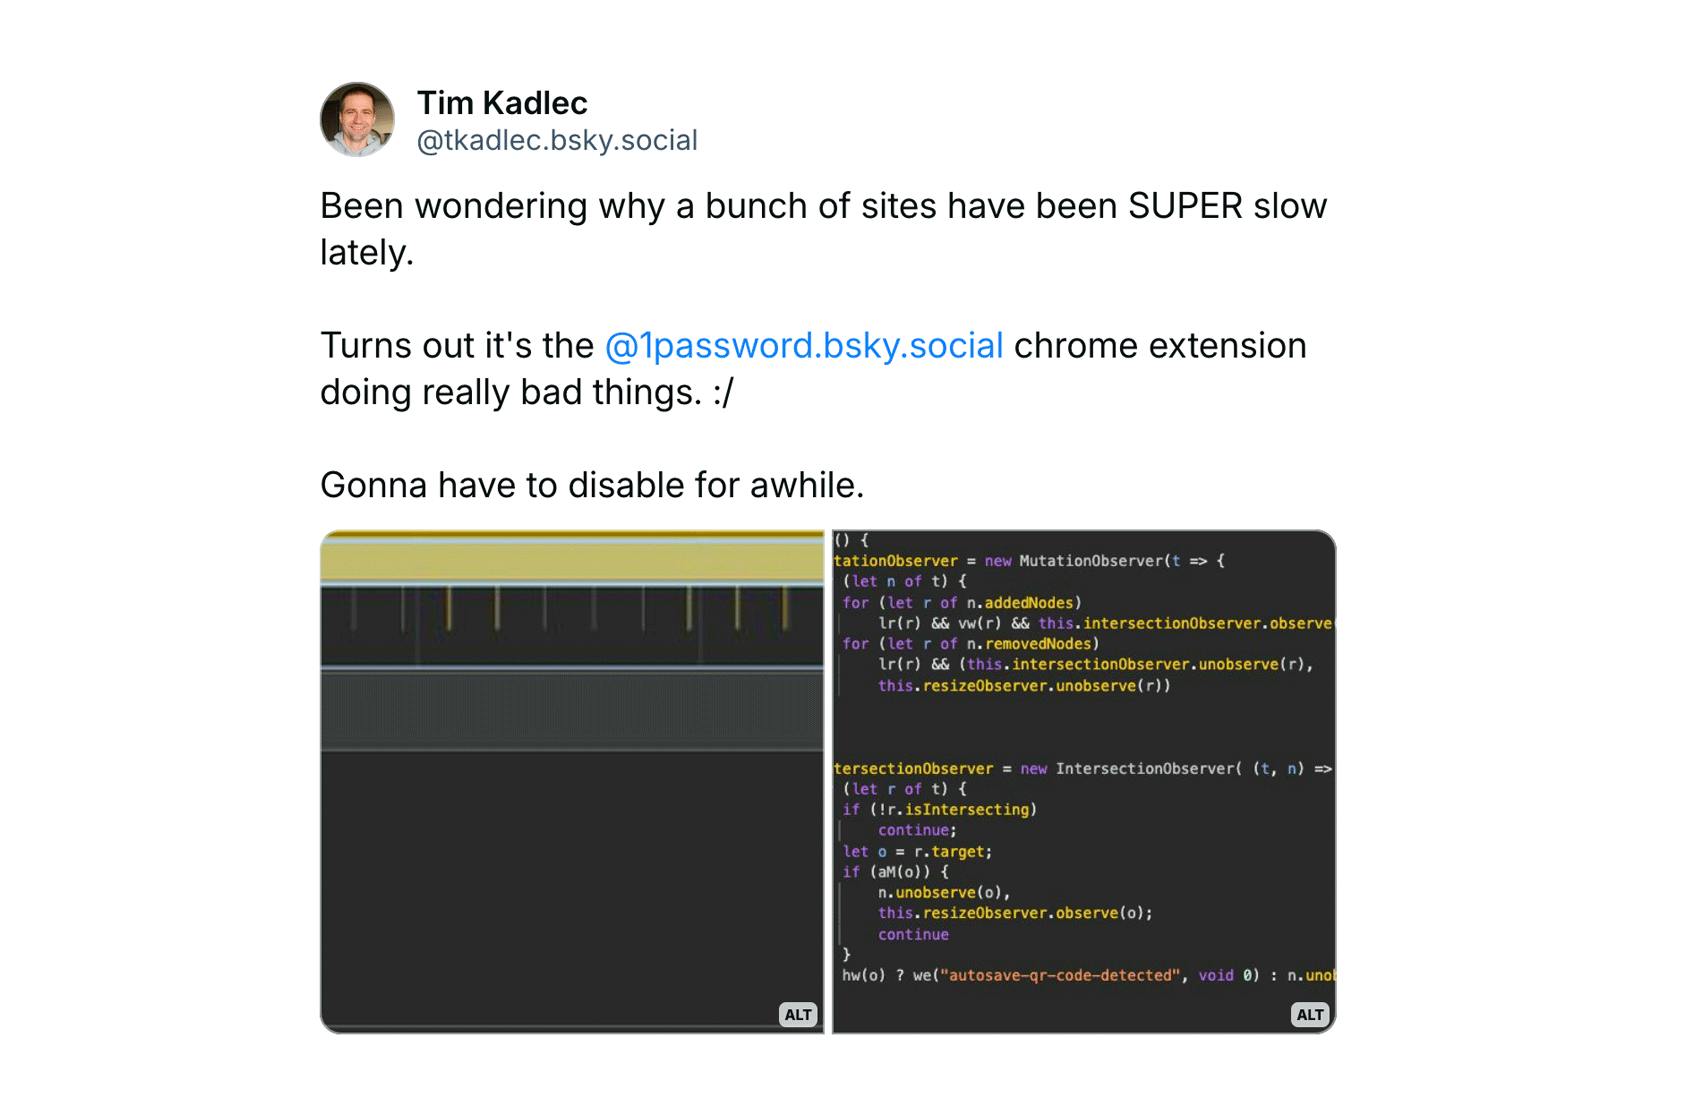
Performance expert Tim Kadlec on Bluesky
Related: Some productivity experts say too many open tabs can lead to cognitive overload and reduced focus for users. According to some experts, you should never have more than 3-5 tabs open at a time. Raise your hand if you have more than five tabs open right now. *RAISES HAND*
6. Other applications
Running too many non-web applications at the same time affects web performance. But many non-techie internet users don’t know this. Some other things that aren't common knowledge outside our tech silo:
- Automatic software updates – Consumes CPU and memory, potentially leading to slower browsing.
- Antivirus software – Scans incoming files to identify and eliminate viruses and other malware such as adware, spyware, trojan horses, etc. It does this by analyzing all files coming through your browser in realtime, meaning that files are paused for inspection before being permitted to download. Because of this inspection, a performance penalty is inevitable and unavoidable. The extent of the penalty depends on the software and on the composition of the page/resource being rendered in the browser.
Takeaways
As I said at the top of this post, you have no control over potential problems at the very front end of the user experience. But that doesn’t mean you shouldn’t arm yourself with the knowledge that problems are occurring.
1. Optimize your pages
While you can’t control the end-user environment, you have tons of control over your pages. Optimizing your images and JavaScript (including third parties), smarter browser caching, creating performance budgets to catch regressions — these are just a few of the techniques you can leverage to mitigate the damage done by things like poor connection speeds and older hardware.
2. Use a reliable content delivery network
In addition to optimizing the heck out of your pages, you should also consider using a reliable content delivery network (CDN).
3. Use real user monitoring to understand real-world performance
Don't rely on your own experience using your site. You also shouldn't rely on synthetic tests to give you a true sense of how your pages perform. Your synthetic testing tools show you how your pages perform in a clean lab environment. Synthetic monitoring is essential for establishing a baseline and showing you the impact of code and design changes. That's only one half of what you need to know. You need to combine synthetic and real user monitoring.
Real user monitoring (RUM) tools show you how your pages perform out in the real world, where they're affected by variables outside your control. You need real user monitoring that gives you full visibility into how actual people are experiencing your site.
4. Look at performance at the 75th and 95th percentile, not just the median
Too many people focus on what performance and user experience look like at the median, and they neglect the large number of users at the 75th and 95th percentiles. Here's when and why you should focus on median, 75th percentile, and 95th percentile results:
- Median – This is typically a stable measurement, so it's good for seeing long-term trends; however, the median will typically not show short-term trends or anomalies. Importantly, it also doesn't give you any visibility into the user experience being tracked in the worst-performing half of your data.
- 75th percentile – This is a good balance of representing the vast majority of measurements, while not being affected by outliers. While not as stable as the median, the 75th percentile is a good choice for seeing medium- to long-term trends. The 75th percentile is the best value to use when setting performance budgets. It's the percentile that Google recommends using when monitoring Core Web Vitals.
- 95th percentile – This encompasses the experience of almost all of your users, with only the most severe outliers excluded. This makes it perfect for spotting short-term trends and anomalies. If your metrics look good at the 95th percentile, you can feel assured that the majority of your visitors are having a fast user experience.
Summary
You have a lot of control over the design and code for the pages on your site, plus a decent amount of control over the first and middle mile of the network your pages travel over. But when it comes to the last mile – or more specifically, the last few feet – matters are no longer in your hands. This is why you need to combine synthetic and real user monitoring for visibility into the full breadth of your users' experiences.