Track down front-end CPU hogs

Often when monitoring and debugging site performance we focus on network activity and individual resources, but what about the CPU? As more and more sites switch to using large Javascript frameworks and manipulating the page using Javascript, the execution time this code takes and the available CPU can instead become the performance bottleneck.
CPU usage for all Chrome tests
For any of SpeedCurve's Chrome-based tests, including emulated devices, we capture the Chrome Dev Tools timeline. From the browser main thread usage in the timeline we extract how busy the CPU is and what it's spending time on. Is it busy executing Javascript functions or busy laying out elements and painting pixels?
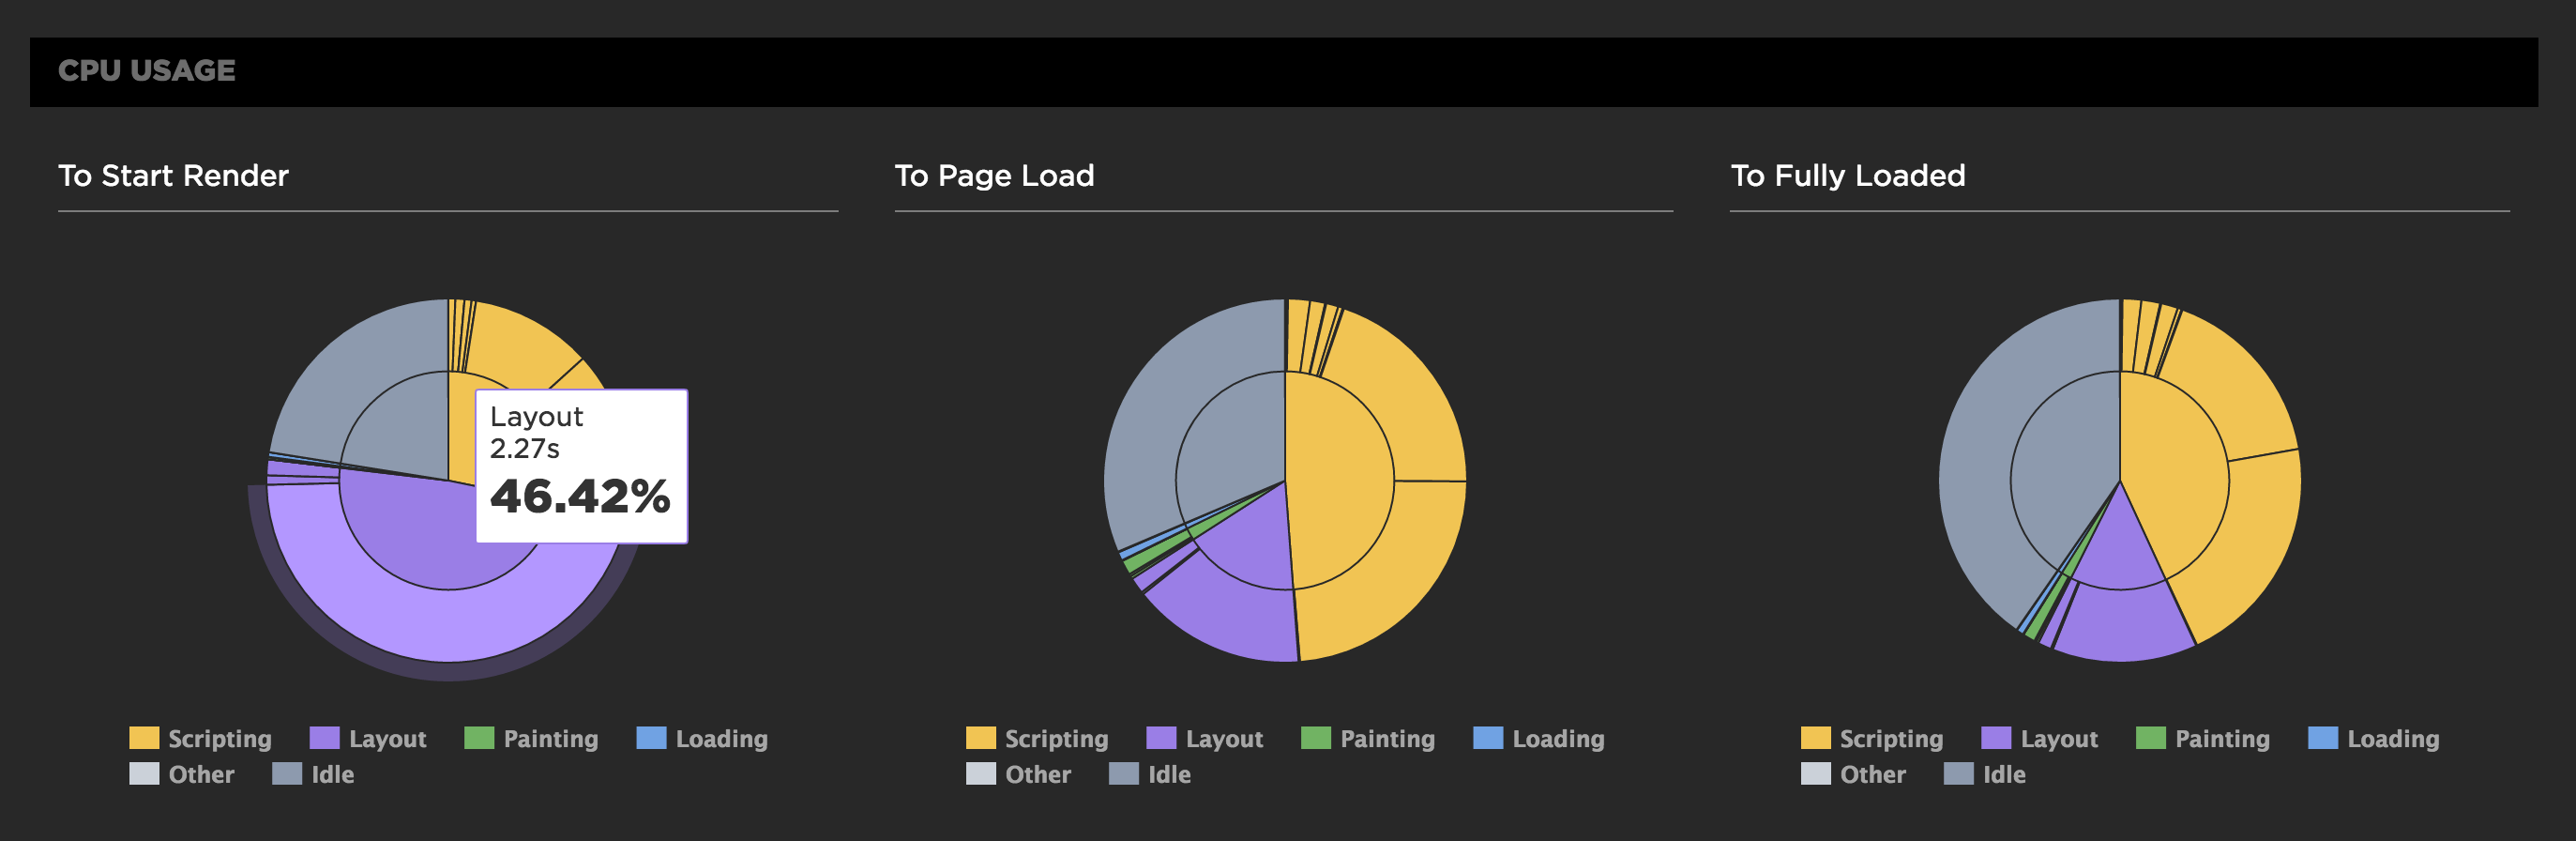
We also measure the CPU usage to different key events in the rendering of the page. SpeedCurve's focus is on the user experience and getting content in front of people as fast as possible, so we show you what the CPU is doing up till the page starts to render. This reflects CPU usage during the browser critical rendering path and can highlight various issues. If there's lots of CPU idle time then you're not delivering your resources efficiently. You want to get the CPU busy nice and early rendering the page, rather than sitting idle waiting for slow resources.
In the test below we see in the first pie chart that the CPU is spending a lot of time on layout up to the start render event, which is quite a different picture from the Fully Loaded CPU usage.
CPU trends and budgets
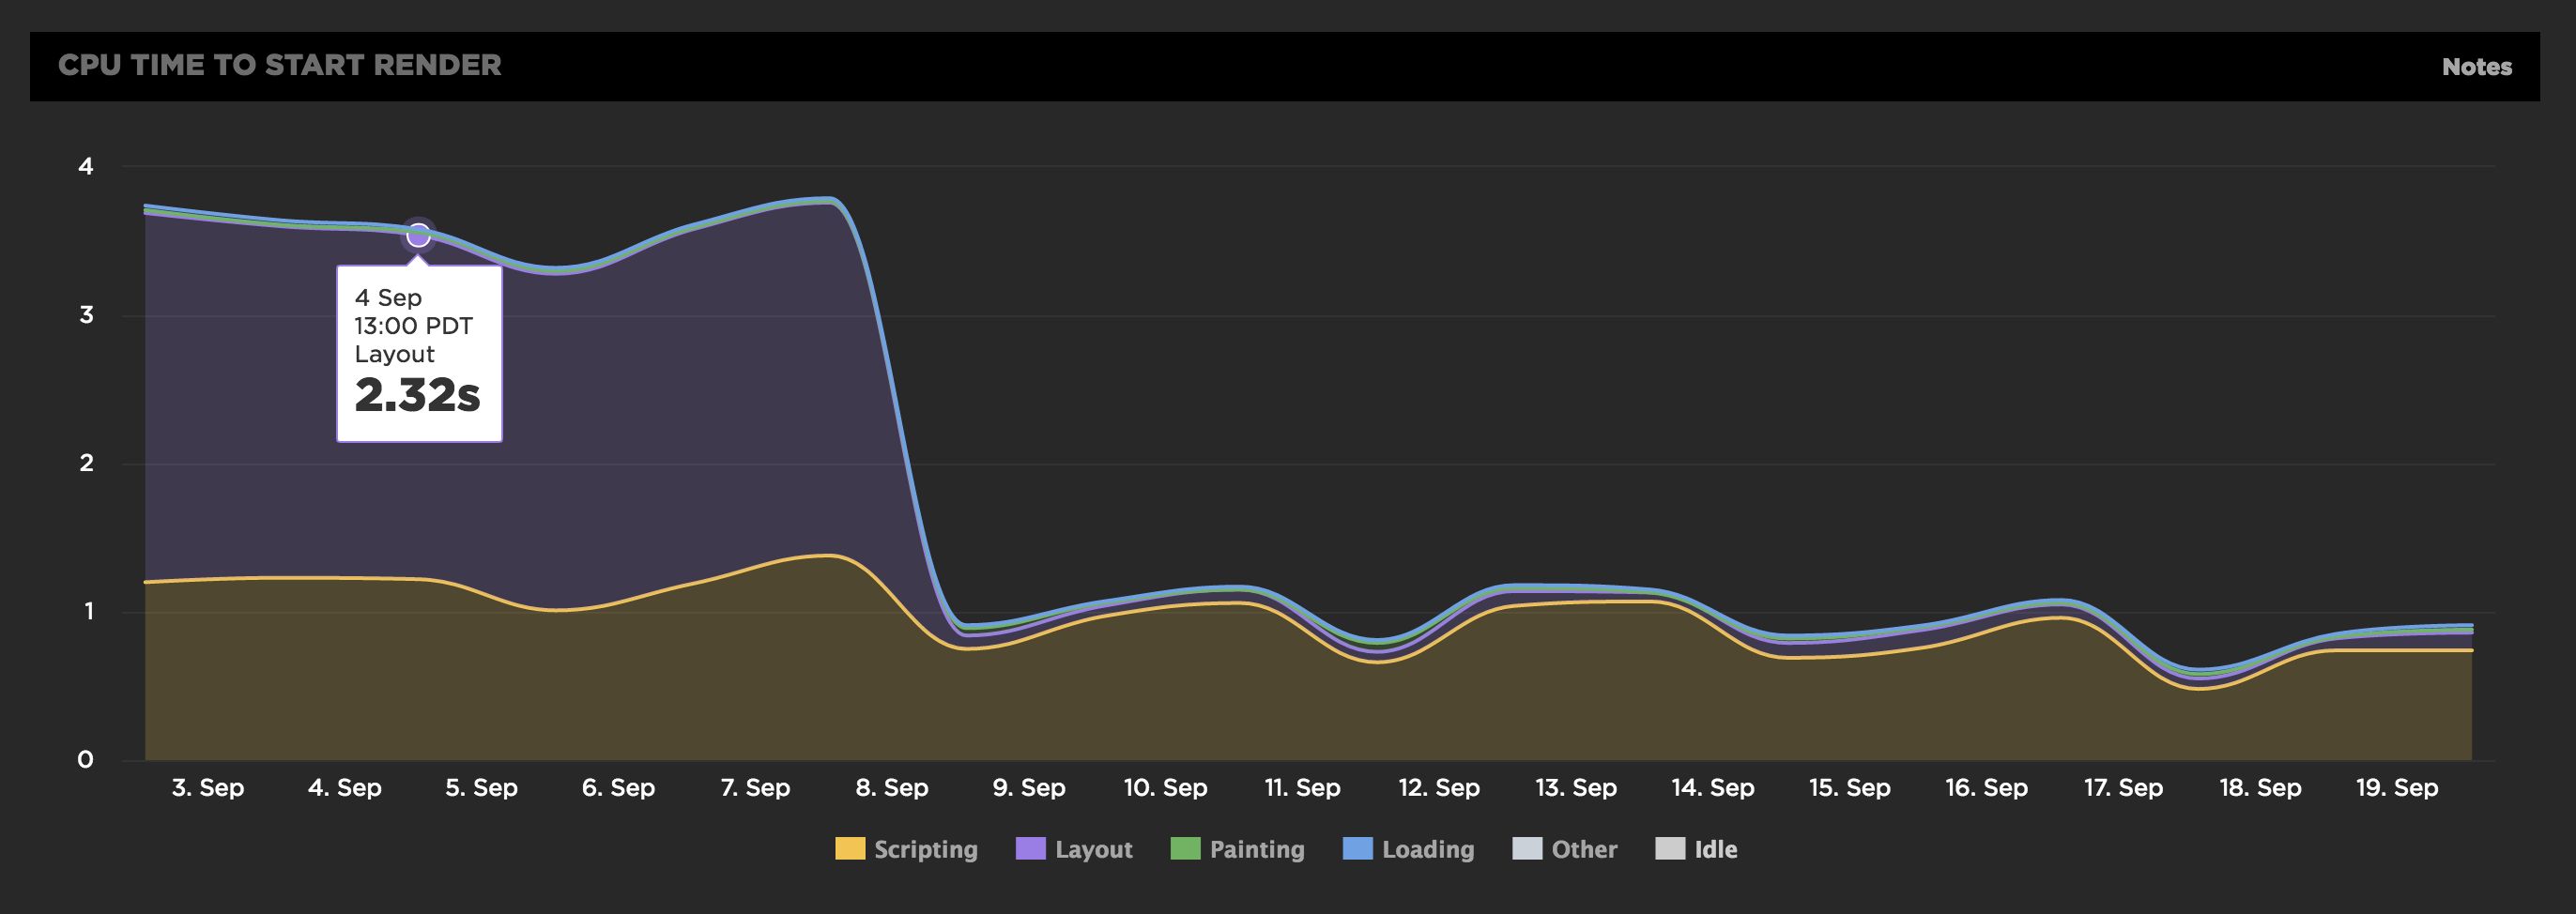
We've also added trending charts for the CPU time to both the Start Render and Fully Loaded browser events. This allows you to spot any significant changes over time and can highlight both CSS and Javascript changes which are causing CPU issues. In the example below we see a dramatic change in the Layout CPU time for this URL. The browser was being tied up by dodgy Javascript which was causing a huge amount of layout thrashing and reflows. Once fixed the Layout time drops dramatically.
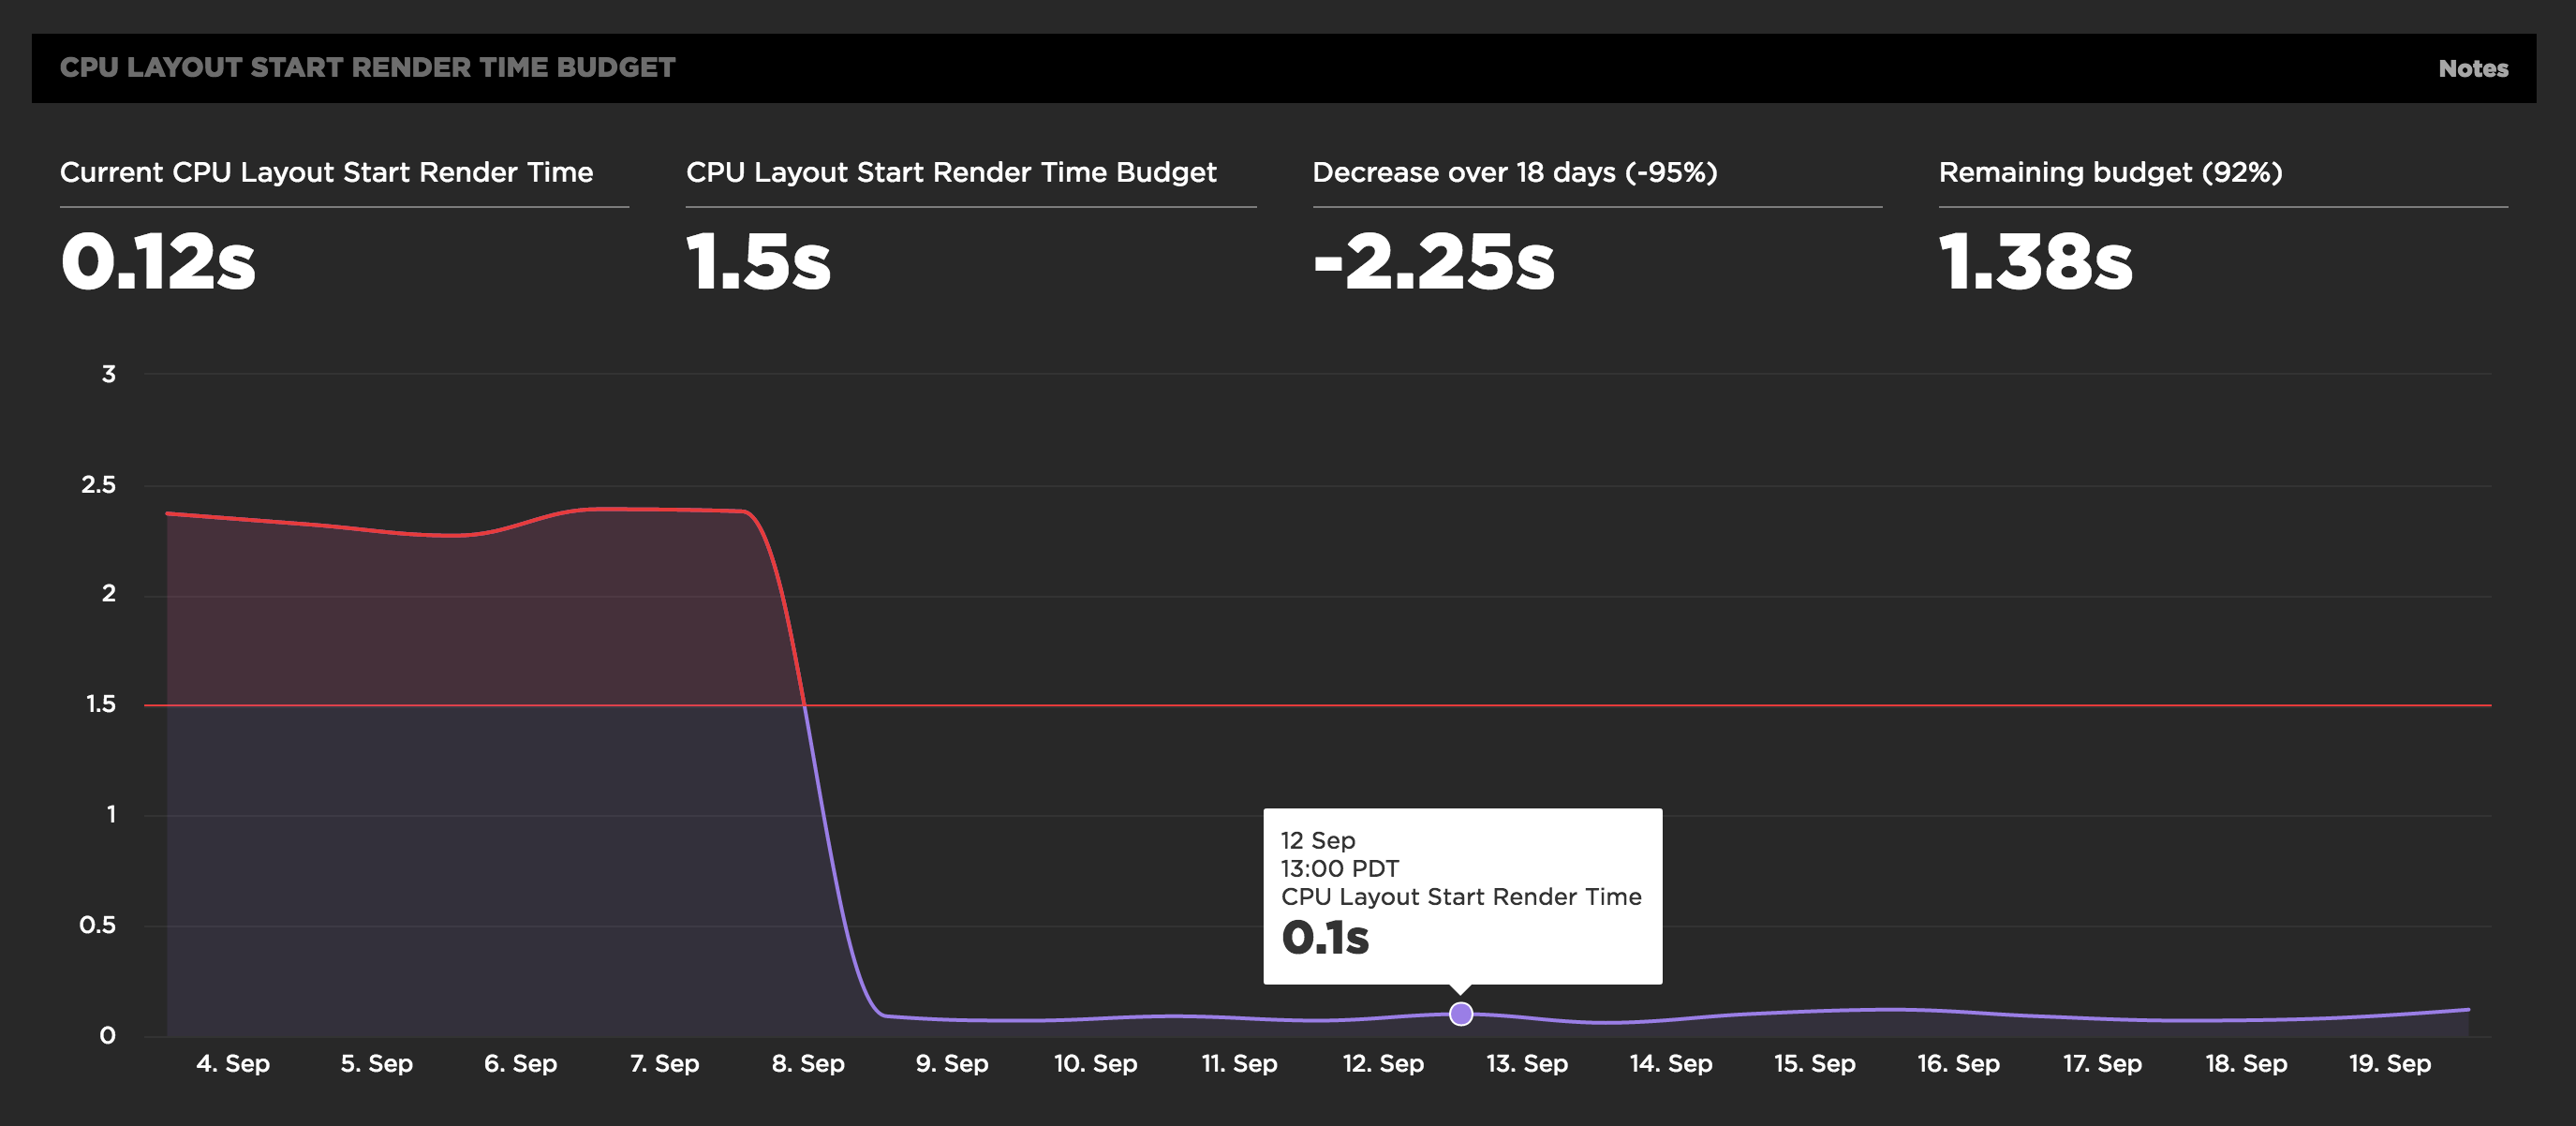
We also support performance budgets for all the CPU metrics allowing you to get email and Slack alerts whenever a threshold is crossed. It's going to be interesting to see what sort of budgets teams put on script execution and layout. Not only can you monitor the size and number of Javascript or CSS scripts but you can ensure it's well written code that's not thrashing the CPU.
Chrome Dev Tools timeline goodness
It's amazing how much performance data is packed into the Chrome Dev Tools timeline and for every single Chrome based test on SpeedCurve we capture the timeline. You can click through to an online timeline viewer at the bottom of the SpeedCurve waterfall chart.
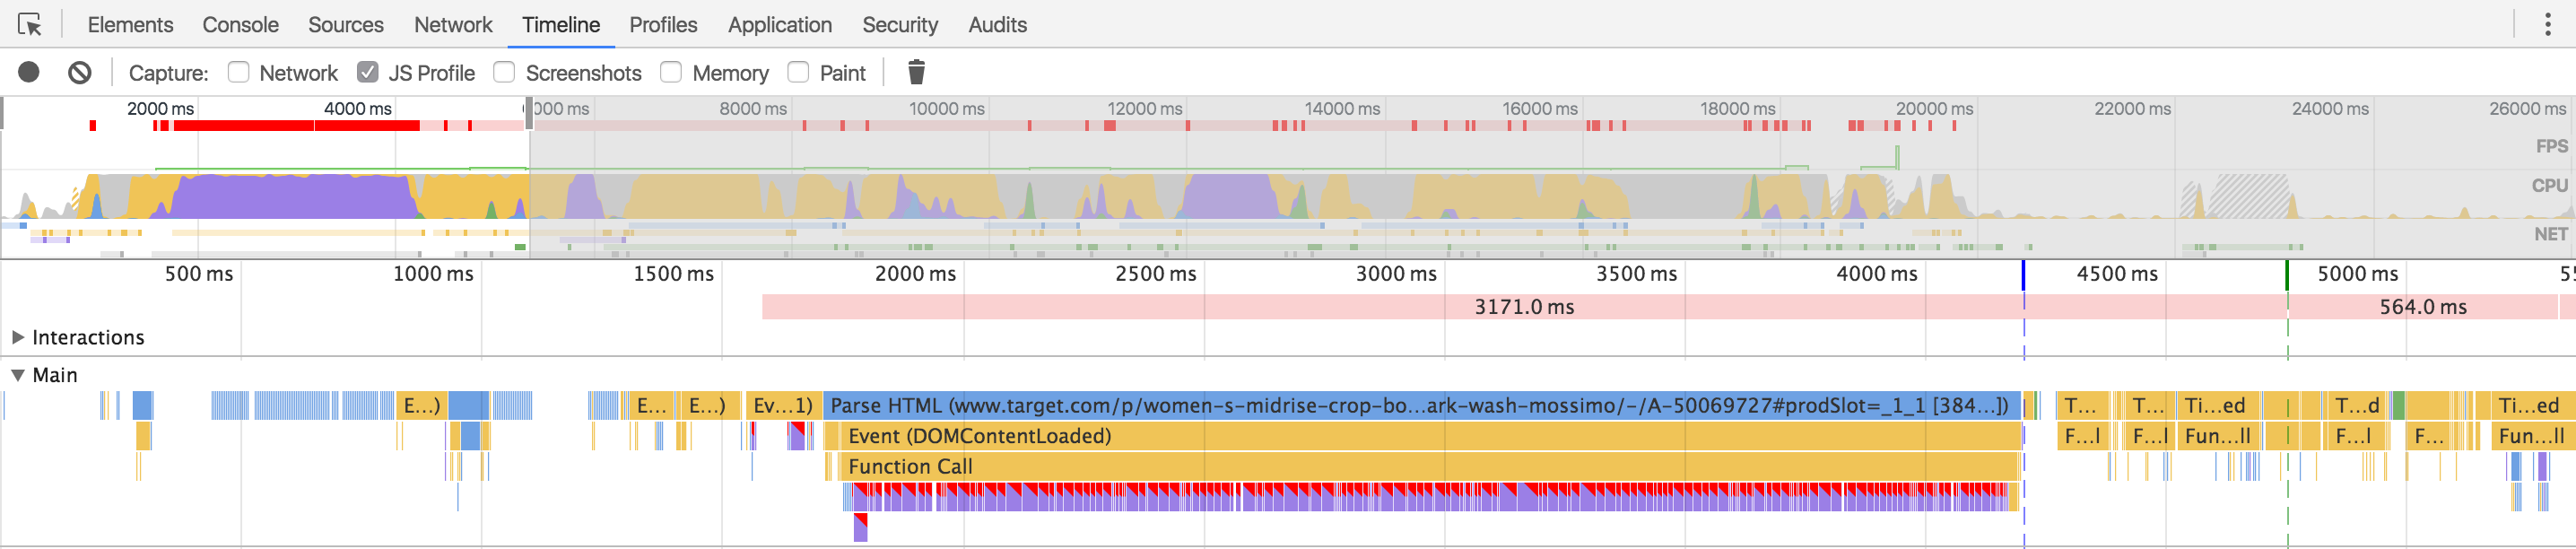
Here's the timeline for the URL above which had a layout thrashing issue, highlighted by the dark red bar between 2-4s. It's amazing to have this level of debugging for every test!
Test agent CPU
It's worth noting that the test agents we currently run at SpeedCurve are fairly low spec and so don't have oodles of available CPU. We do this to help emulate lower spec mobile devices. Over the last year we've seen CPU usage grow and some URLs with a lot of heavy Javascript and CSS are now maxing out the CPUs on our test agents. Although it's fascinating to see well constructed sites (I'm looking at you Smashing) not have this issue at all, with plenty of CPU idle time available as the page renders.
We all need to add CPU usage to our front-end performance toolkits!
We're thinking about introducing new agents with higher CPU specs so that you can test on both a lower spec CPU that represents an emulated device and a high CPU agent that better represents a desktop browser. Sing out in the comments if this is something you're interested in or you've discovered something interesting in your CPU usage charts.
If you're not already using SpeedCurve to monitor your site's performance and track your own CPU hogs, set up your free trial here.