UX Focus for Waterfalls and Third Parties
At SpeedCurve, we want to help designers and developers have better insight into the user experience they're delivering. For websites, this means understanding when the critical parts of the page render and what might be blocking rendering.
We've redesigned our waterfall chart to really highlight the relationship between the assets on the page and their affect on the user experience. Now as you move you mouse over the waterfall chart we show you exactly what a user is seeing at that millsecond while the page loads. This makes it much easier to identify any Javascript or CSS that might be blocking the page from rendering. I recently used this new combined waterfall and filmstrip view to identify a common issue with hero images being delayed.
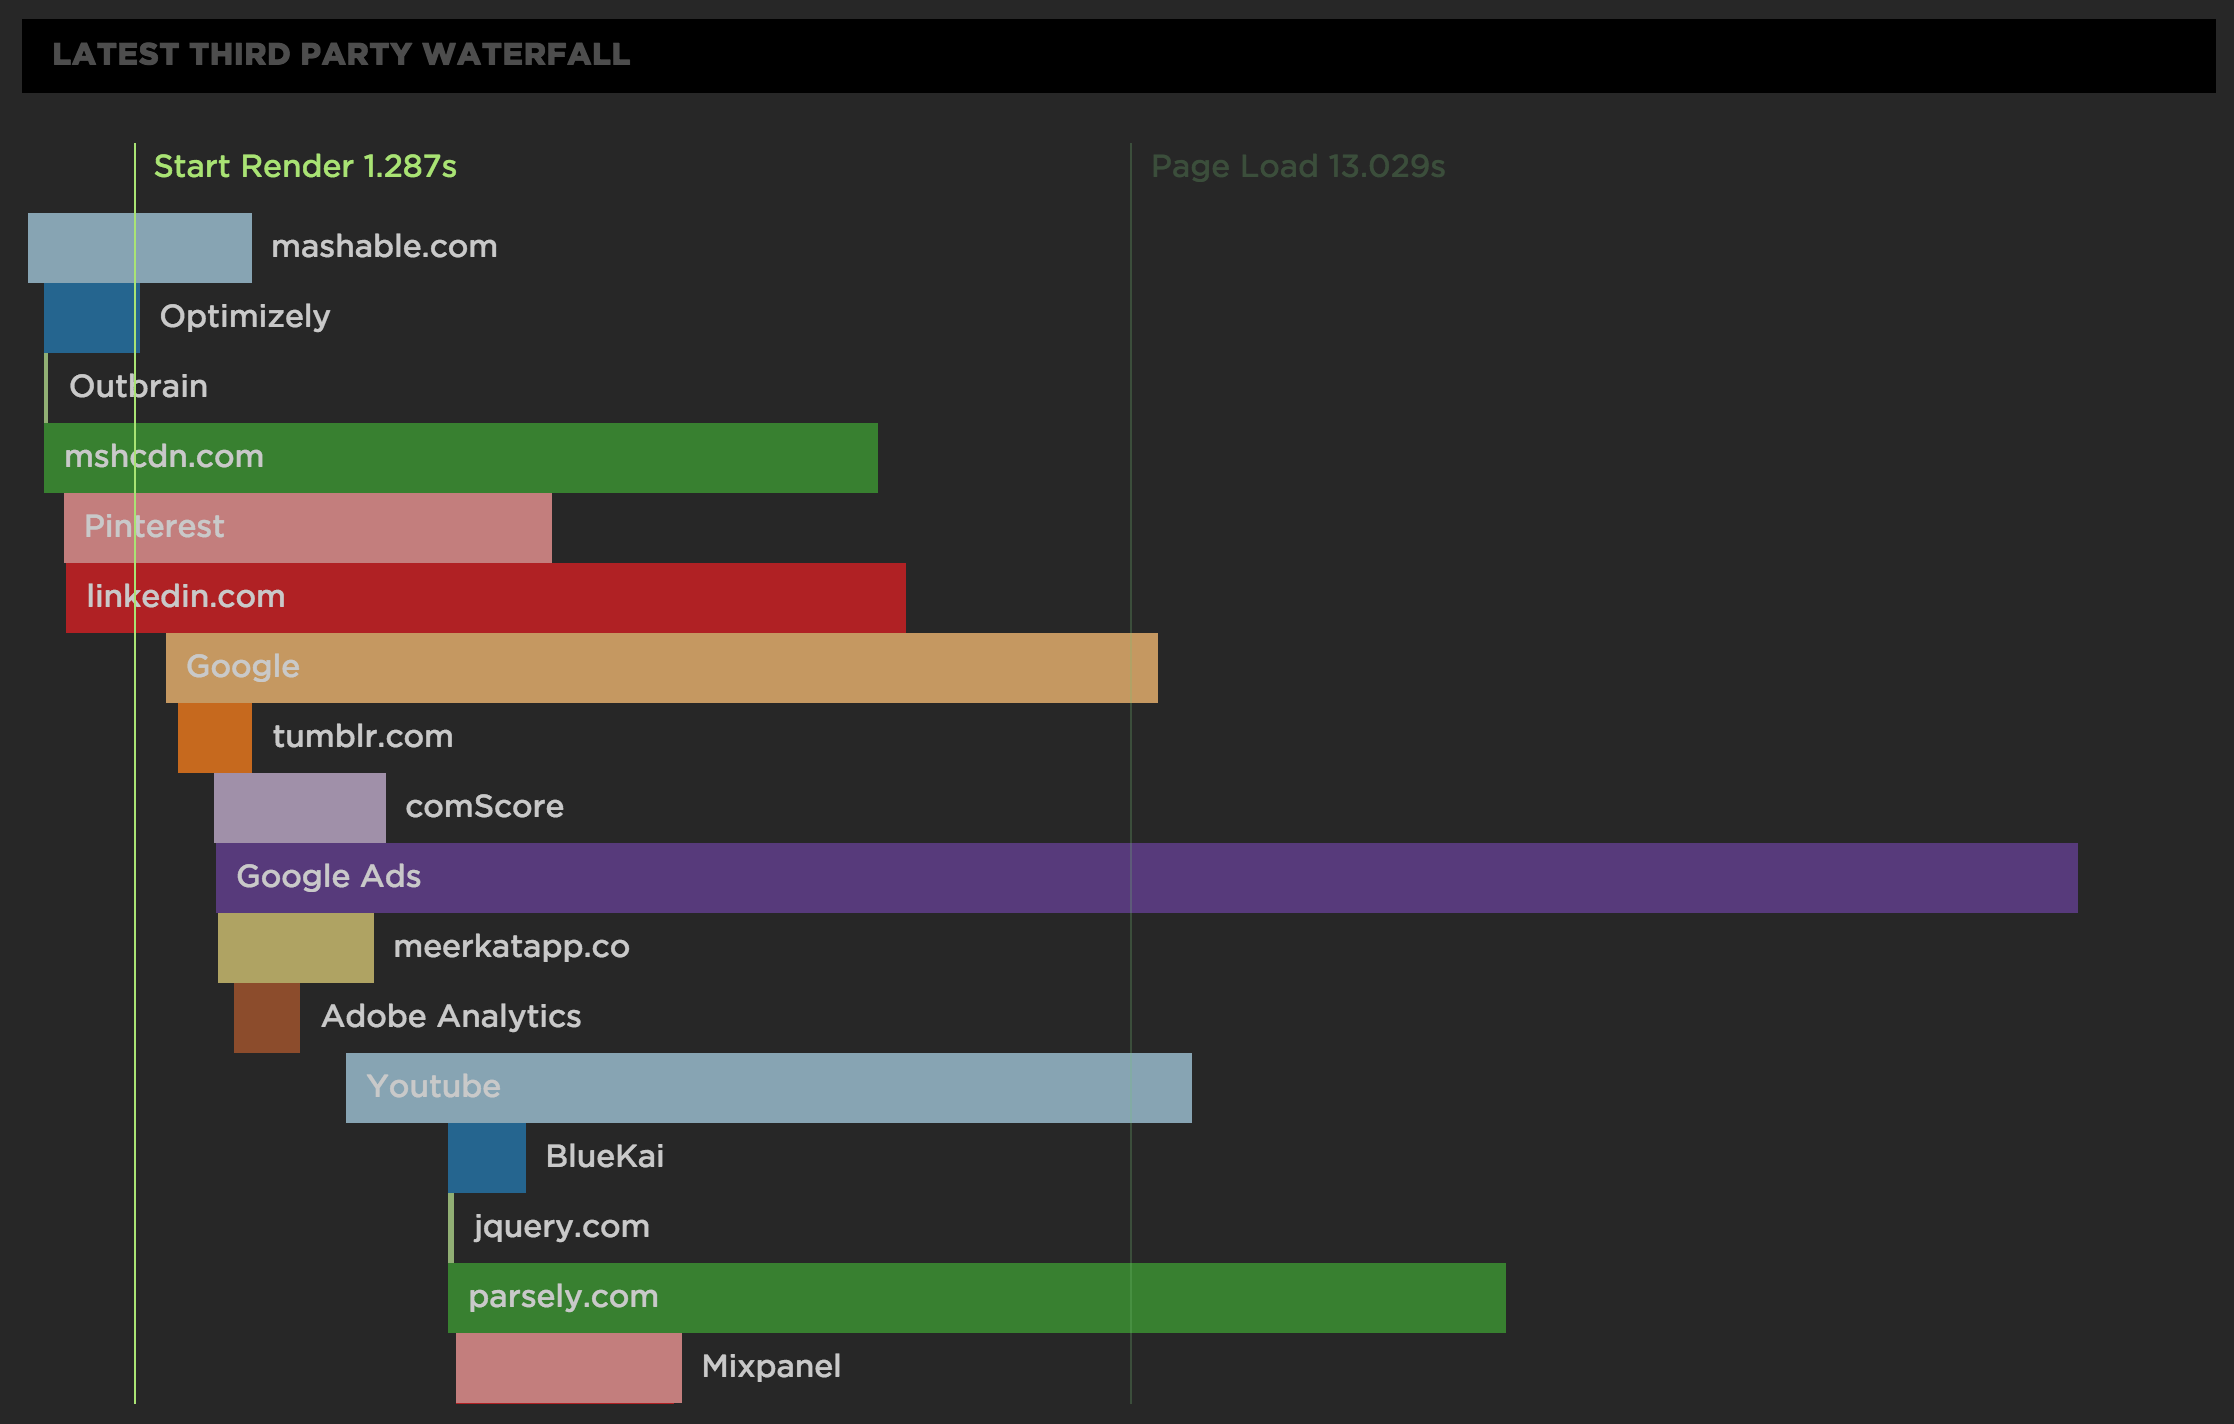
If rendering is blocked, it's important to figure out the cause. This isn't always easy, especially with the amount of third party content on websites today. Often the scripts and stylesheets that come with ads, analytics, and social widgets aren't delivered in a high performant way and can block the main content on the page from ever being seen by users. To help identify this possibility, you can use the Start Render line in the Third Party waterfall chart.

The Third Party waterfall chart bundles HTTP requests into groups representing first and third parties. The grouping logic is based on technology developed at SpeedCurve. We draw a vertical line representing the Start Render point on top of the waterfall. Any third parties to the left on the line have the potential of blocking rendering. You can click on each third party to see more detail and go to the full waterfall chart to investigate the filmstrip thumbnails.
Waterfall charts are great. Adding the ability to see when rendering occurs and how it's affected by third parties makes them even an even better tool for designers and developers to create great experiences for their users.


