Ouch, your JavaScript hurts!

When looking to improve the performance and user experience of our sites we often start by looking at the network:
What's the time to first byte?
How many requests are we making and how long are they taking?
What's blocking the browser from rendering my precious pixels?
While these are entirely valid questions, over the last few years we've seen a growing number of web performance issues that are caused, not by the network, but by the browser's main thread getting clogged up by excessive CPU usage.
When creating great user experiences, managing CPU usage is now just as important as fast networks.
How often have you been on your mobile and loaded what looks like a complete page only to discover than when you tap or scroll nothing happens or the page lags far behind your input? We need a fresh set of questions that reflect how congested the CPU on our devices might be and how that affects users:
How long is the browser's main thread trashing at 100% CPU?
When can users start interacting smoothly without interruption?
Which scripts are hurting my users?
Through the development of new web performance metrics and visualisations, we're now at a point where we can see the true cost of JavaScript, as well as monitor and improve its impact on users.
First Interactive & First Input Delay
These new JavaScript performance metrics capture for the first time just how long users are having to wait before they can smoothly interact with the page:
First Interactive is a Synthetic metric that marks the point in time when the browser's main thread is not blocked for more than 50ms by any single task so it will be able to respond to user input quickly.
First Input Delay is a metric that we recently added to RUM. It measures the time from when a user first interacts with your site (i.e. when they click a link or tap on a button) to the time when the browser is actually able to respond to that interaction.
JavaScript Waterfall
One of the challenges with monitoring JavaScript performance is the ability to attribute which scripts are causing issues. To help we're excited to introduce the concept of a JavaScript Waterfall chart that blends the network and execution time of your scripts into a filterable view that lets you quickly focus on the scripts that are causing delays.
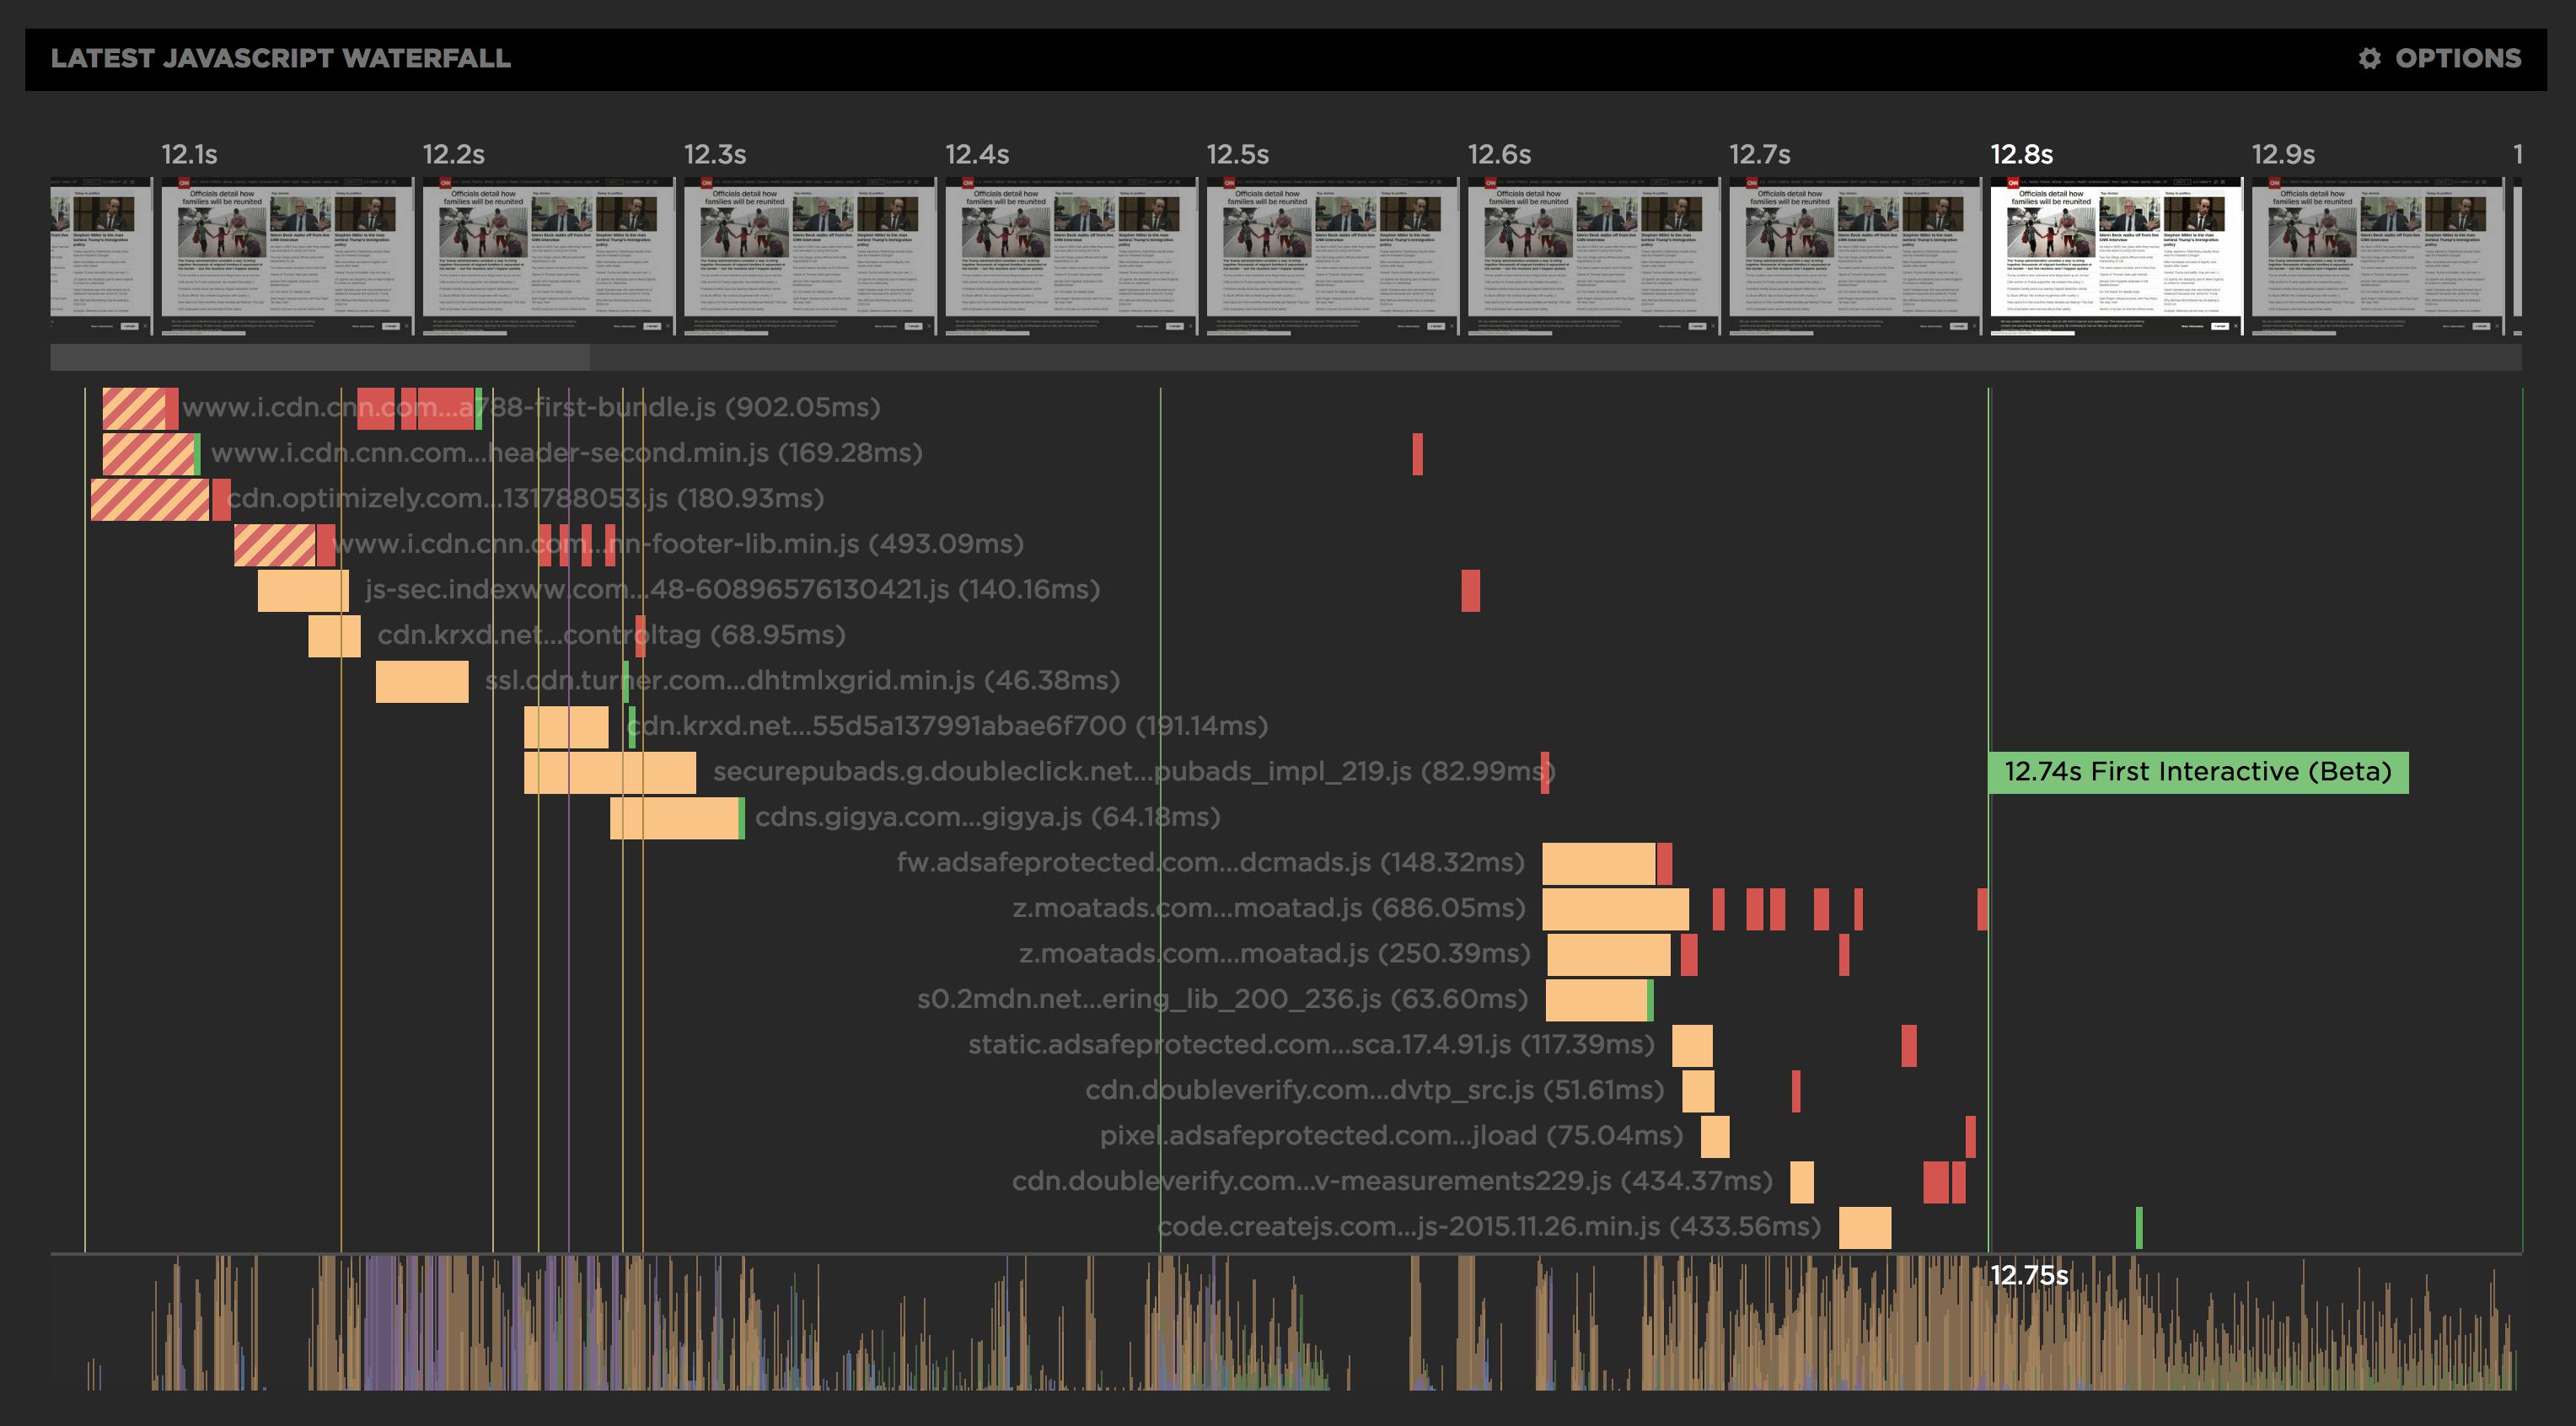
The Javascript waterfall lets you correlate the user experience (filmstrip up top) with the browser main thread (CPU usage along the bottom) and identify which scripts (middle) are delaying important browser metrics (vertical lines).
In the view below, we've filtered on JavaScript activity longer than 50ms (in red). You can see how a bunch of third-party ads have pushed the First Interactive metric right out to 12.74s. In fact, the hero content in the viewport was visible at 3s but because of those third-party ads the page was not considered usable for another 10s! This really highlights the hidden cost of JavaScript and how easily it can lead to a poor user experience.
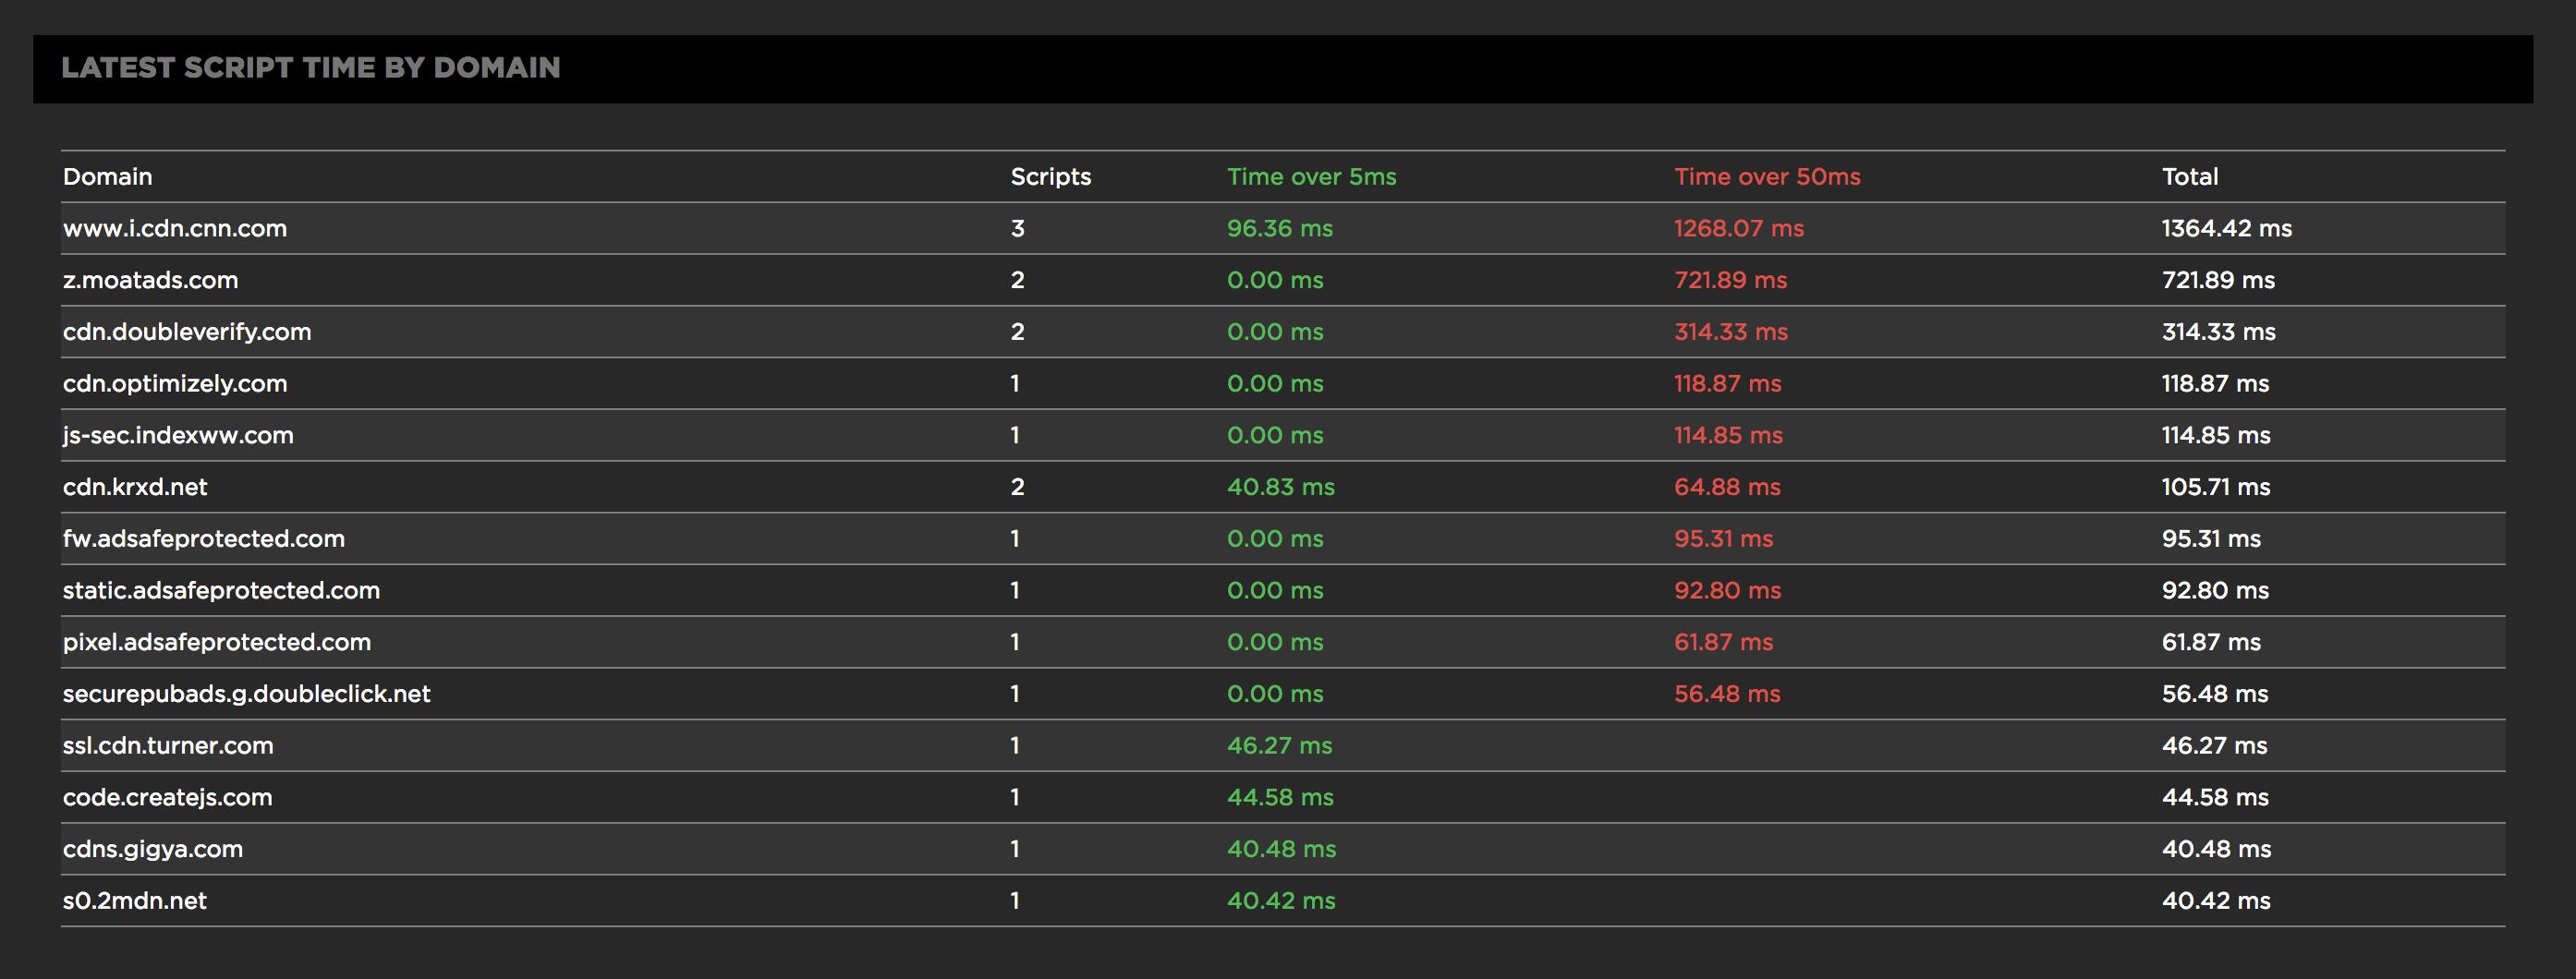
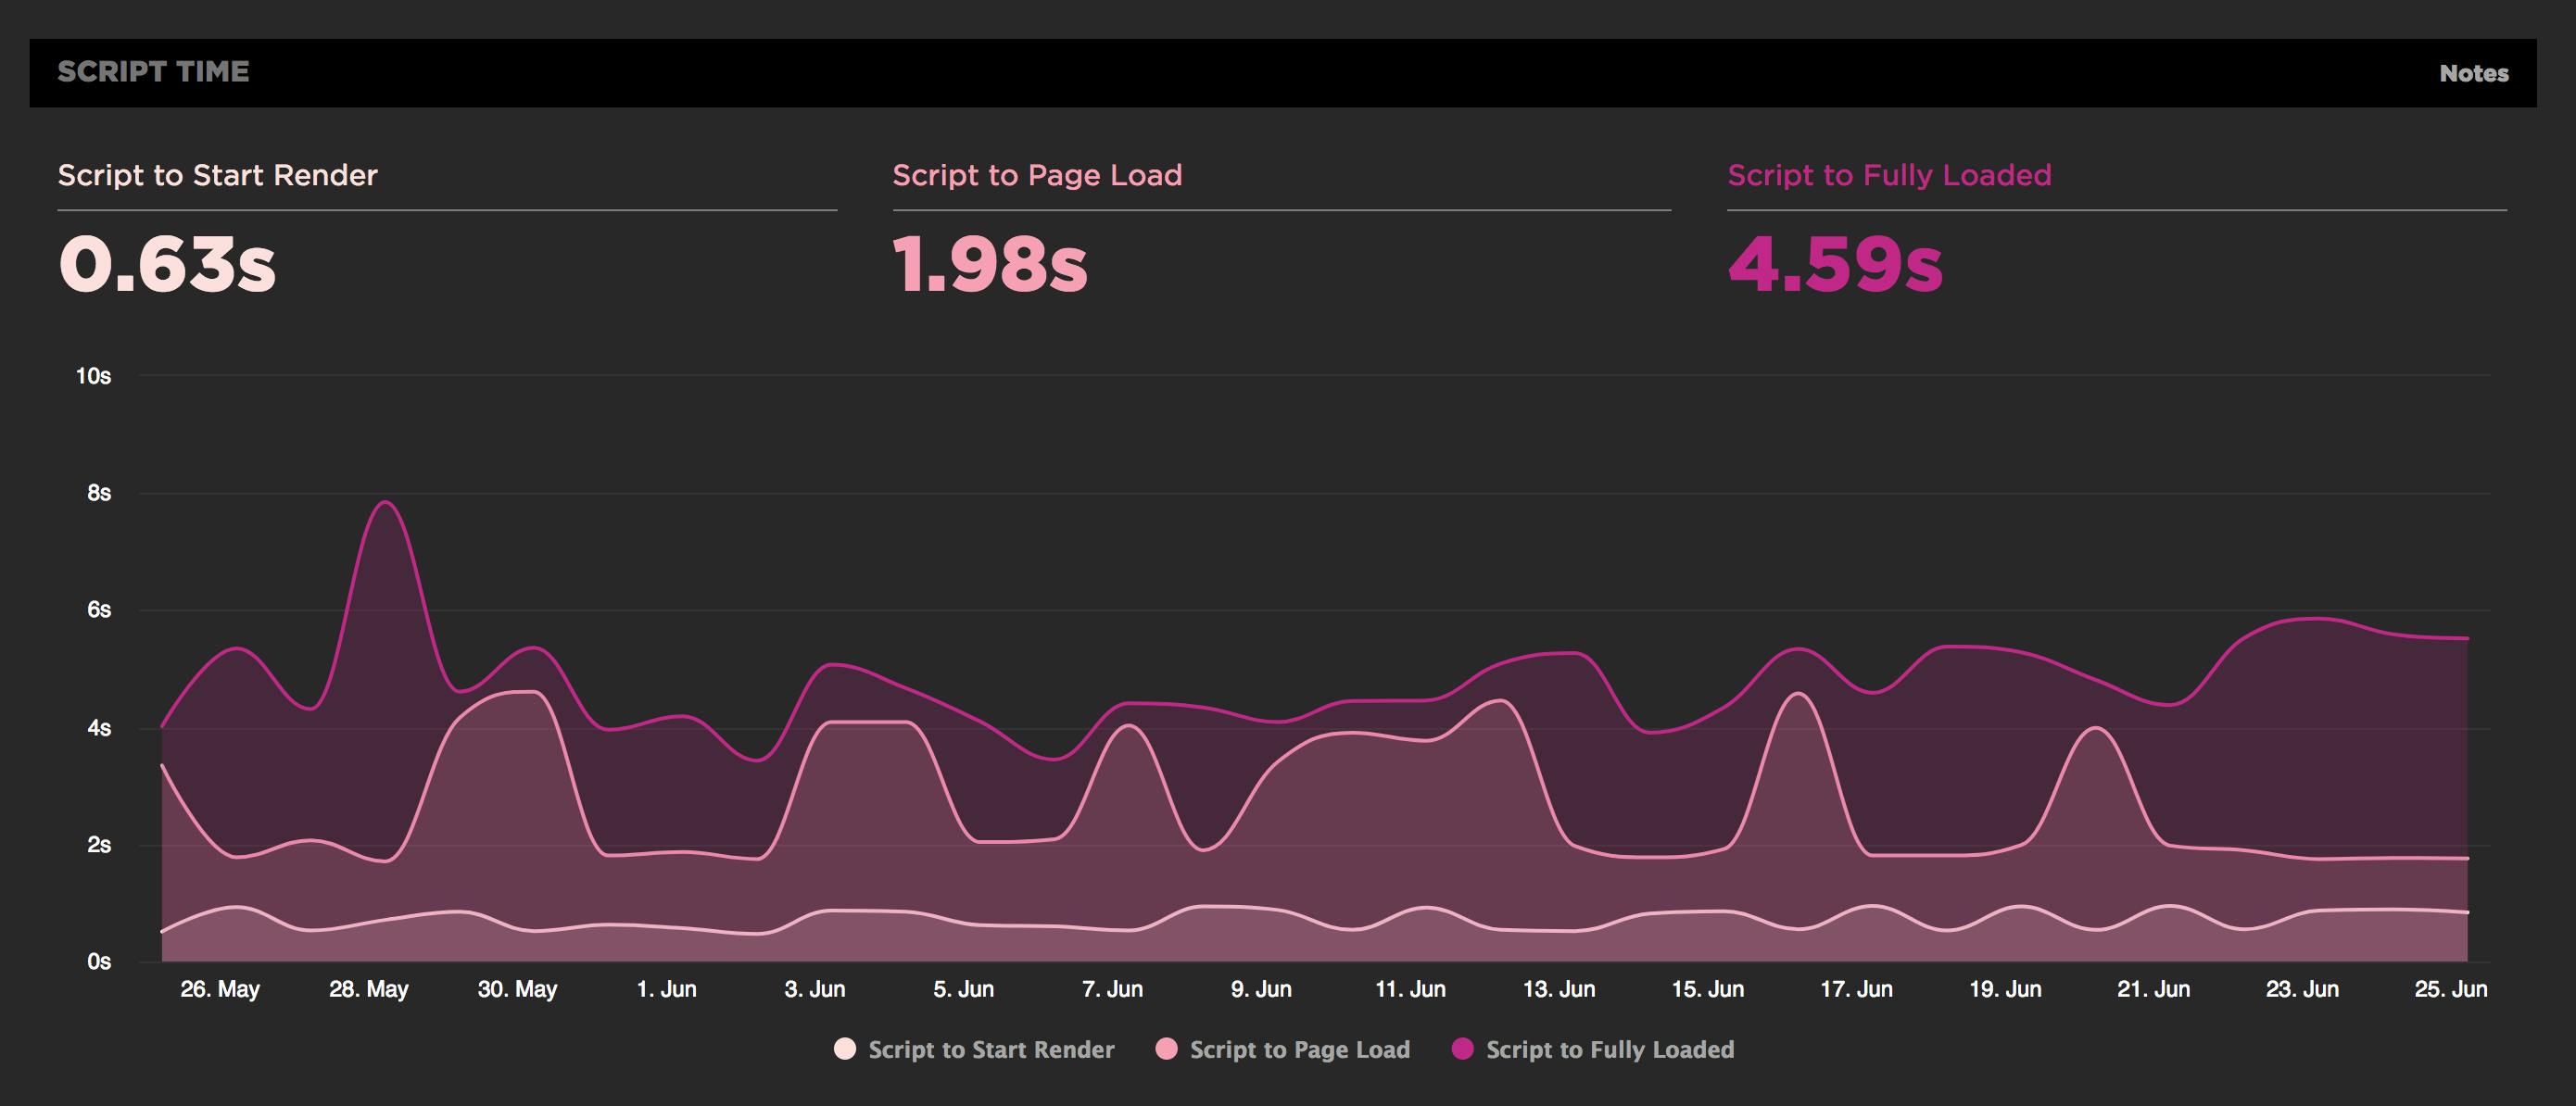
We also group JavaScript by domain to help bubble up the most problematic consumers of CPU and also trend the CPU time used through to important browser events like start render. You can also set performance budgets on metrics like CPU scripting time to Page Load and receive Slack alerts when your page's JavaScript performance deteriorates.
The cost of JavaScript
At the recent O'Reilly Fluent Conference, Addy Osmani gave an insightful look into The Cost of JavaScript. He really challenged the complacency we often have as developers who work and test on fast devices and fast networks. It's vital we jump on old devices that reflect what average users experience and throttle the CPU of our tests. We need to remember that, byte for byte, JavaScript consumes a heck of a lot more CPU than CSS or images and can block our users from interacting with the page.
JS frameworks, friend or foe?
I love the ease of development and the functionality that JavaScript frameworks like React and Vue.js have enabled over recent years, but often we don't talk about their cost. You don't get anything for free, and there's little discussion when choosing these frameworks about the cost to users. When we push all our app logic and rendering from the server to the client, we become reliant on the device to perform. Often those devices are just not as fast as we expect them to be.
Addy highlighted an example of this tradeoff when Netflix moved parts of their website signup and video player from vanilla JavaScript to React. In the initial release they saw a degradation in client side performance and user experience. They ended up removing React from some pages and putting considerable effort into optimising performance of the player to get it back on par with the original.
What struck me is that the user experience ended up being the same. So was it worth the effort? And if they hadn't put the extra effort in, would the default React version actually have been worse for users. Are you monitoring metrics like First Interactive to make sure your users don't also suffer?
Don't let the development joy of a JavaScript framework blind you to the pain it might cause your users
When moving to these JavaScript frameworks, I believe it's critical to keep the user experience in mind and keep asking yourself if this will improve the speed of your website or hinder it. You can use tools like SpeedCurve to A/B test a prototype and quantify the cost of a JavaScript framework before jumping in boots and all.
We've set ourselves a new goal at SpeedCurve: to be the best tool for monitoring the performance of JavaScript. Jump in and explore your own JS waterfall and let us know what else you'd like to see as you dive deeper into the performance of your JavaScript stack.