Skip to content
Performance Monitoring

Get a comprehensive picture of your website's performance

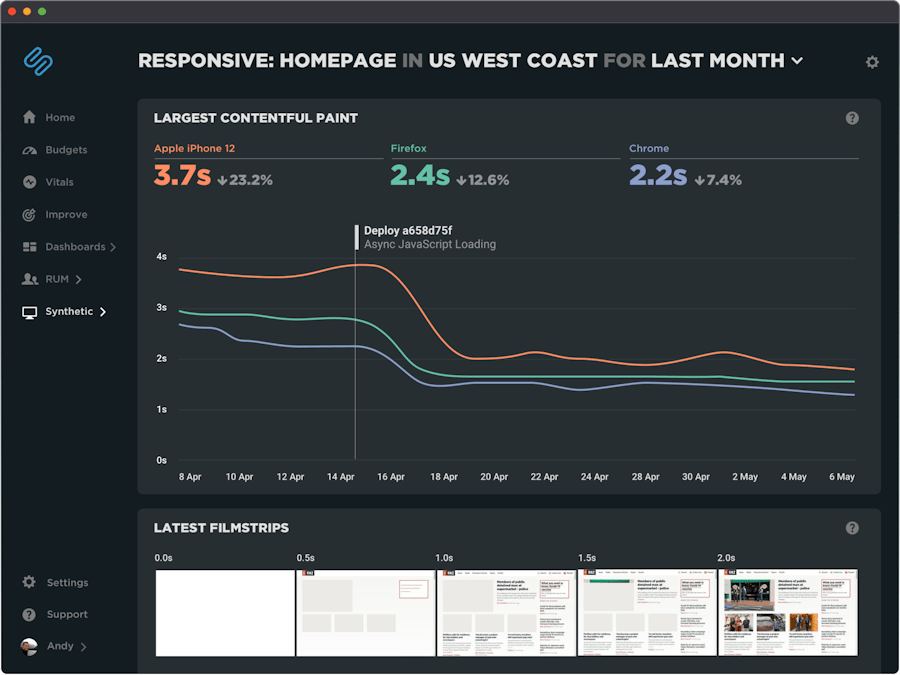
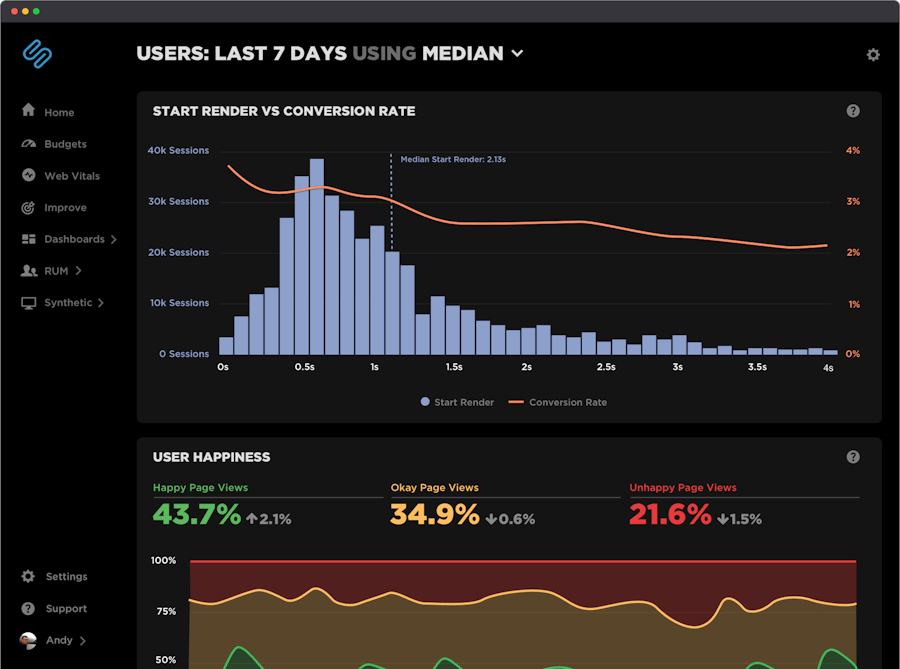
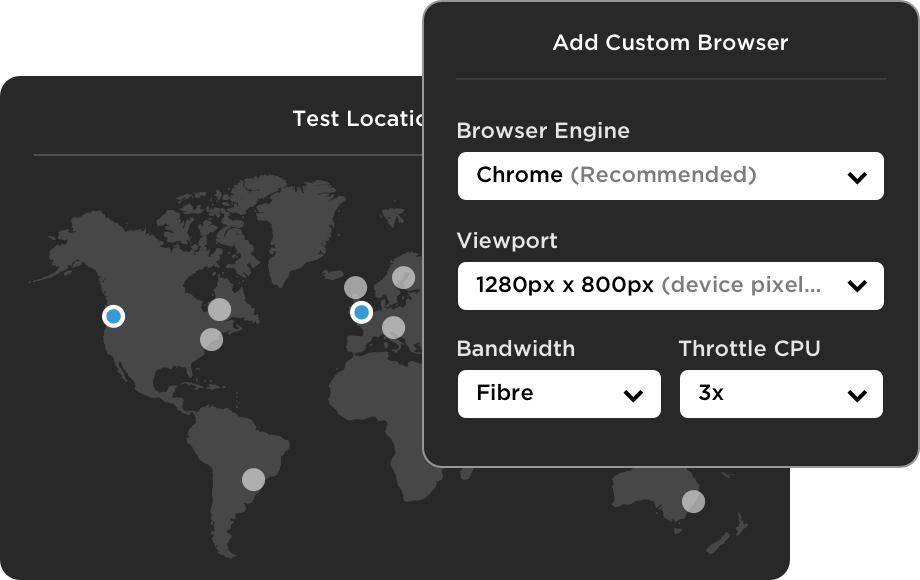
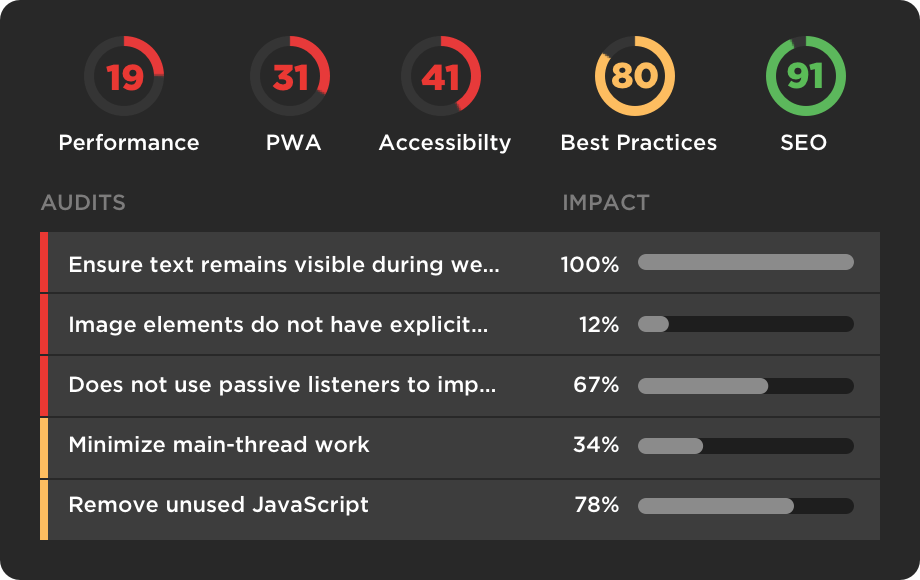
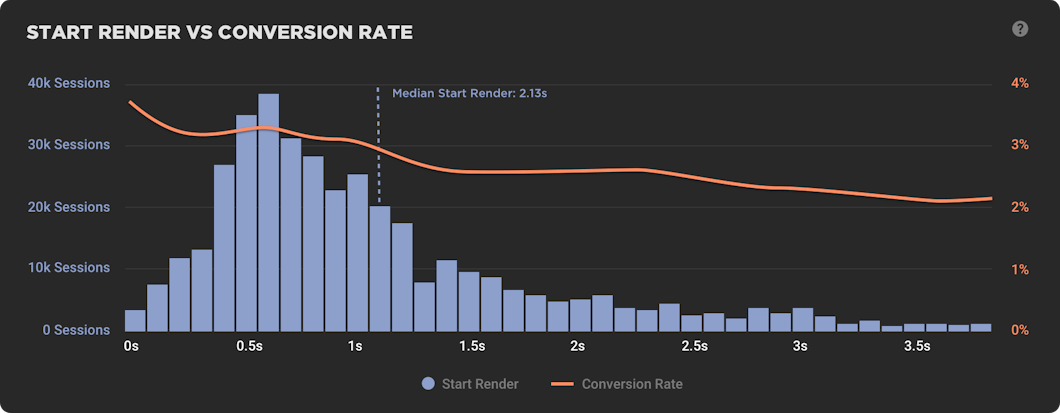
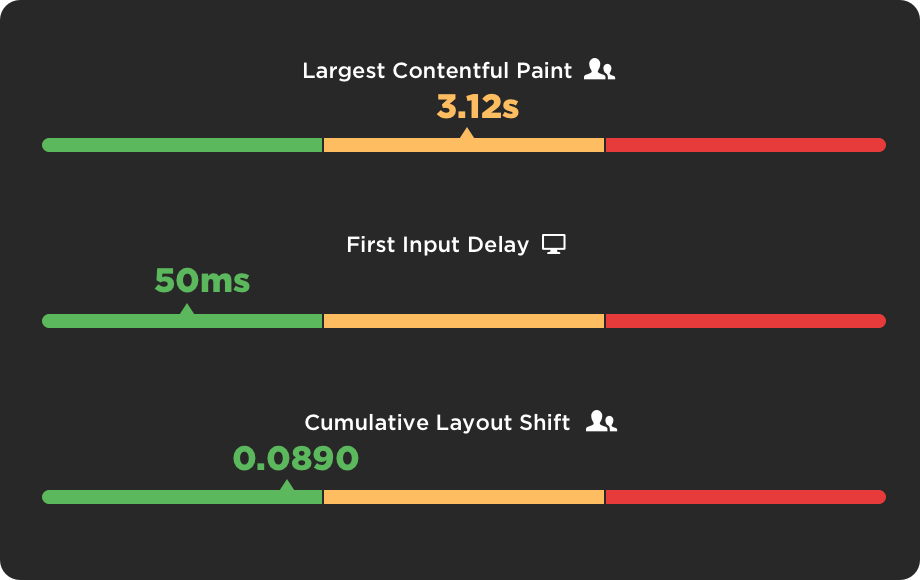
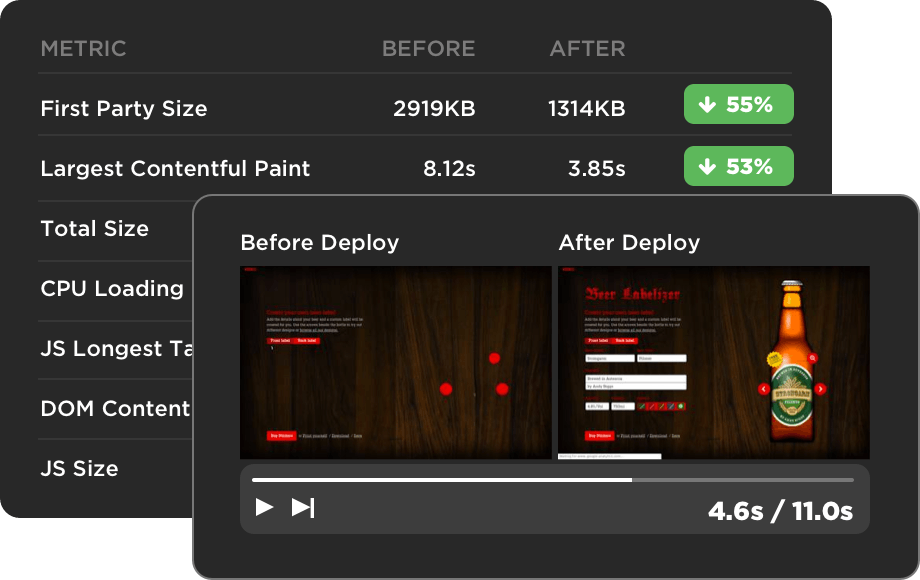
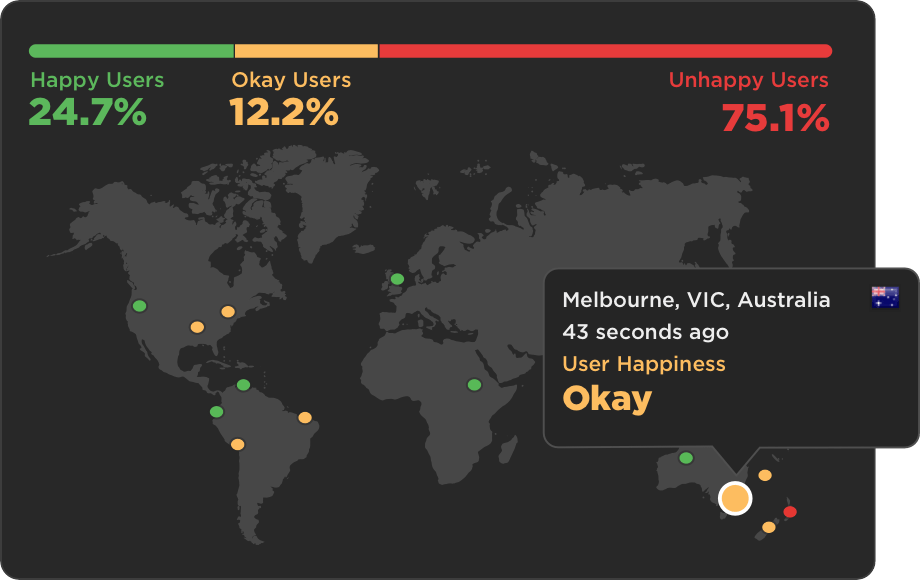
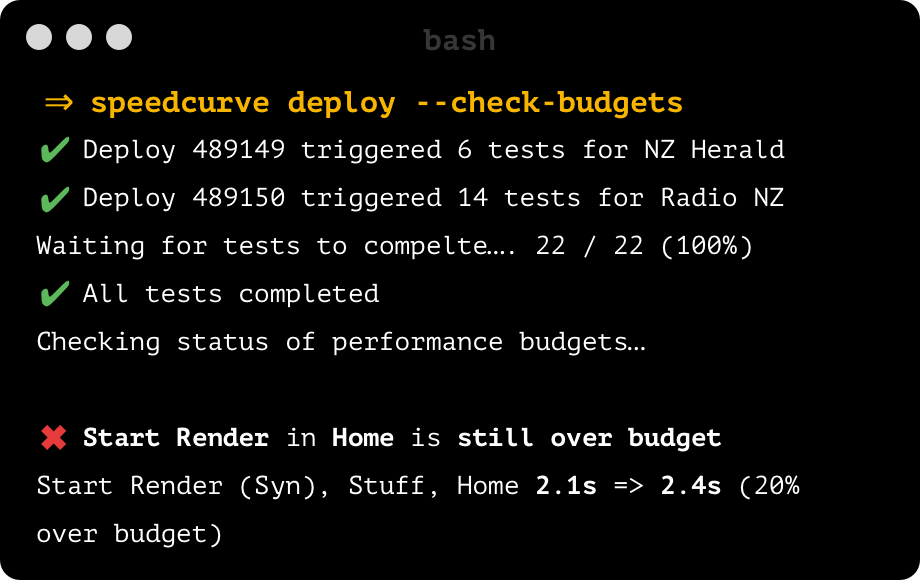
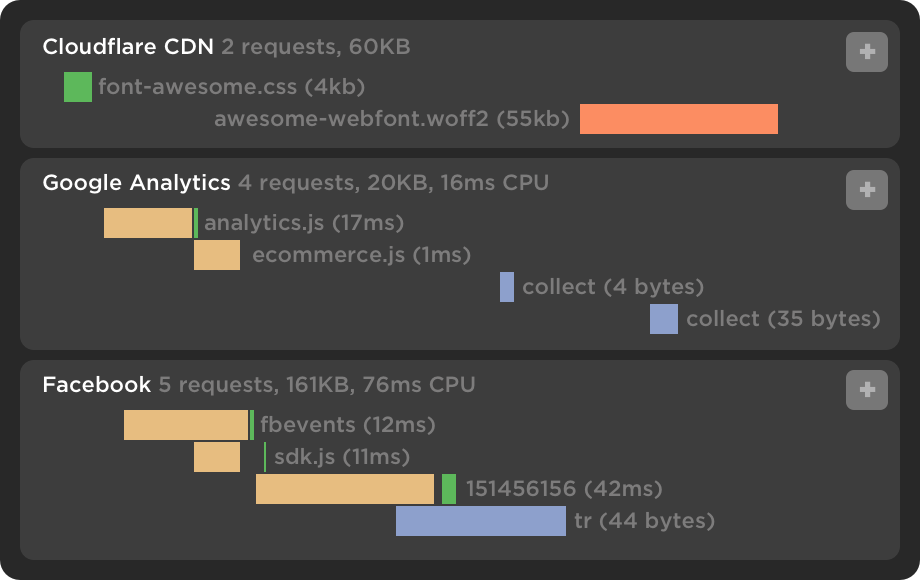
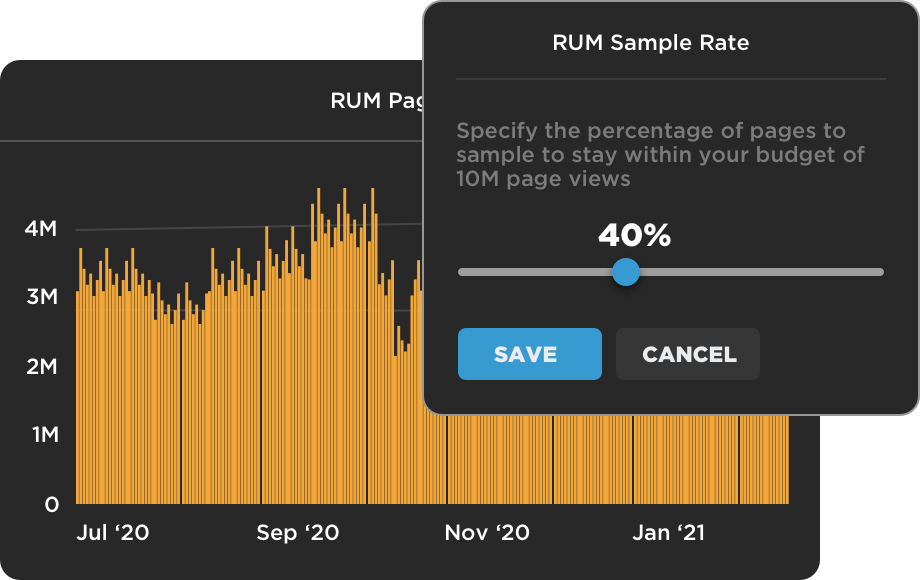
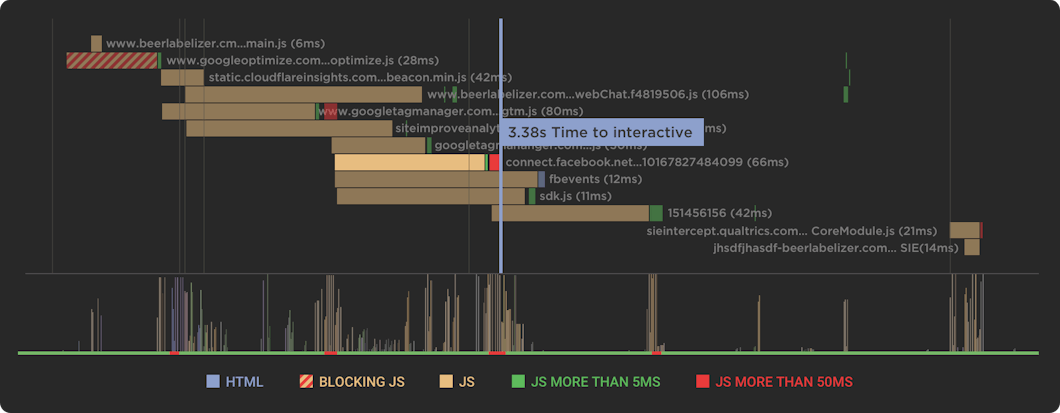
Get both a broad and detailed picture of how your site performs. Measure the experience of your real users in the field. See the impact of code changes, and get recommendations for fixing performance issues from detailed lab data.

Easy setup • No credit card required
Orchestra
Synthetic Monitoring
Collect lab data within a controlled environment with pre-defined device and network settings. Advanced debugging capabilities let you identify, isolate, and fix your performance issues.
SpeedCurve Synthetic
Real User Monitoring
Collect field data that shows you how your real users experience the speed of your site. As well as tracking industry standard metrics, SpeedCurve RUM tracks additional metrics like the number of critical blocking resources, images above the fold, and custom metrics. Get a better sense of how your design and development affects the speed of your site – and how that correlates to your business performance.
SpeedCurve RUM
Browsers
Multiple browsers and locations
In addition to our default desktop and mobile browsers, you can create your own custom browser profiles. Our worldwide test agents run on Amazon AWS EC2, so you get a consistent test environment across all regions. You can also add your own private test agents, if you need to test in other regions or behind firewalls.
Lighthouse
Lighthouse scores and audits
Lighthouse is an open-source tool for auditing the quality of webpages. Lighthouse scores and audits are generated with every synthetic test run. Your Lighthouse results are also aggregated across all your pages. This makes it easy to identify and resolve the audits that will have the greatest impact on improving your site’s performance.
Correlate web performance with your business performance
Correlate
Understand the impact of page slowdowns on your business metrics. Track any metrics you want – Including cart size, A/B tests, and conversion rate – and see how they’re affected by web performance changes.
Web Vitals
Track Google’s Core Web Vitals
SpeedCurve supports Google’s Core Web Vitals, which focus on three performance metrics considered essential for improving the user experience: Largest Contentful Paint, First Input Delay and Cumulative Layout Shift. This set of metrics is a Google search ranking factor, which means they affect your site’s SEO.
Compare Synthetic
Compare synthetic tests
Run detailed comparisons between Synthetic tests to identify the cause of performance regressions.
Real User Monitoring in Action
Holiday Extras used RUM to tackle single page application performance at scale
Holiday Extras installed SpeedCurve RUM and noticed value when on day one they identified a blocking JavaScript request. They quickly saw a performance improvement on load time after the removal of the render blocking JavaScript request.
User Happiness
Measure User Happiness
SpeedCurve’s User Happiness metric is a combination of multiple performance metrics that are closely tied to delivering a joyous user experience. Combining these metrics into a single aggregated RUM metric makes web performance more comprehensible to a wider audience in your company.
CI/CD
Integrate with your CI/CD process
Monitor performance as part of your development and deployment process. Integrate with CI tools like Jenkins, Travis, or CircleCI using our deploy API. You’ll be able to track the impact of code changes between deploys and get alerts if changes introduce performance issues that violate your performance budgets.
Third Parties
Monitor your third parties
The scripts and stylesheets that come with ads, analytics and social widgets can hurt the performance of your site. Track individual third parties over time, get visibility into their impact on your performance, and get alerts when they violate performance SLAs.
RUM Sample Rate
RUM session sampling
Unlike most RUM services, SpeedCurve allows you to control how many page views are sampled. This allows you to monitor your traffic while staying within a reasonable budget. Sampling is done based on sessions, so your data still includes full user journeys through your site.
Powerful interactive debugging tools
Waterfall Chart
Dive deep into the details to diagnose page frontend performance issues and their effect on user experience. See which third parties cause JS long tasks and push out other metrics. Find blocking requests that delay LCP rendering. Scrub through the browser waterfall to see the relationship between requests and rendering.
JavaScript Errors
JavaScript metrics & errors
Track the impact of JavaScript on your site – and on your users – with metrics like First CPU Idle and First Input Delay. Correlate these JavaScript metrics with bounce rate to get a better understanding of their impact on your business performance. We also monitor and isolate JS errors your users experience.
Benchmarking
Competitive benchmarking
Know which of your competitors are faster than you and make sure you are competitive within your market vertical with our benchmark testing. You’ll have detailed metrics along with side-by-side videos and filmstrips of your competitors to share with your team.
Sessions
Session details
Drill right into your RUM dataset to explore a full breakdown of sessions that occurred within a given span of time using the sessions dashboard. This allows you to investigate anomalies and understand what has changed.
Synthetic Monitoring in Action
The Telegraph pinpoints potential problems in their code base
As a media site, The Telegraph is very focused on improving the performance of third parties on their site. SpeedCurve Synthetic monitoring is their tool of choice, with dashboards that clearly display JavaScript usage and third-party performance. They love that SpeedCurve shows them the performance journey of where they’ve come from and where they need to be.