- Getting Started With CWV
- Largest Contentful Paint (LCP)
- Interaction to Next Paint (INP)
- Cumulative Layout Shift (CLS)
- Web Performance Budgets
- Diagnose Time to First Byte
- Optimizing Images
- Optimizing JavaScript
- Third-Party Web Performance
- Critical CSS for Faster Rendering
- Optimizing Single Page Apps
- Caching for Faster Load Times
Get Started with Core Web Vitals
Everything you need to know about Core Web Vitals – from SEO and business impact to how to continuously monitor, catch regressions, and fix issues with each Vital.
What are Core Web Vitals?
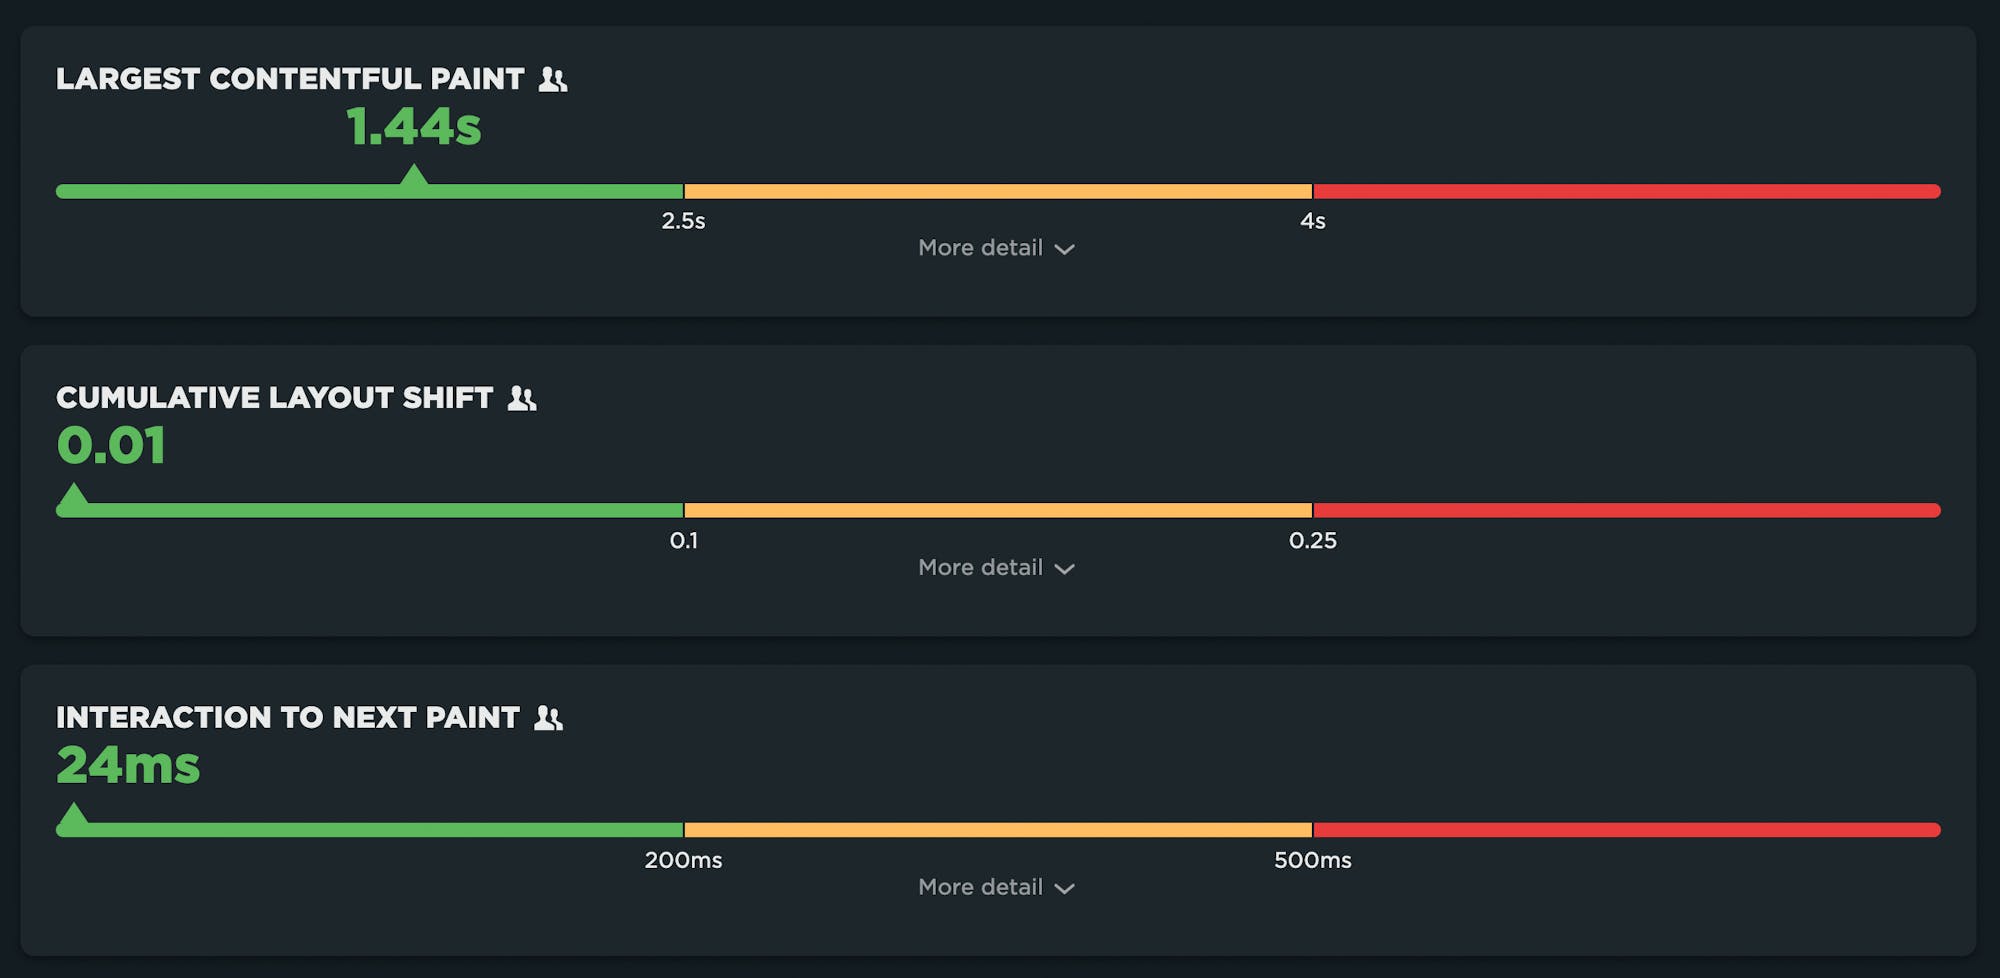
Core Web Vitals is a Google initiative, launched in early 2020, that is intended to focus on measuring performance from a user-experience perspective. Core Web Vitals is (currently) a set of three metrics – Largest Contentful Paint, First Input Delay, and Cumulative Layout Shift – that are intended to measure the loading, interactivity, and visual stability of a page.
- Largest Contentful Paint (LCP) – When the largest visual element on the page renders. LCP is measurable with both synthetic and real user monitoring (RUM).
- Cumulative Layout Shift (CLS) – How visually stable a page is. CLS is a formula-based metric that takes into account how much a page's visual content shifts within the viewport, combined with the distance that those visual elements shifted. The human-friendly definition is that CLS helps you understand how likely a page is to deliver a janky, unpleasant experience to viewers. CLS can be measured with synthetic and RUM.
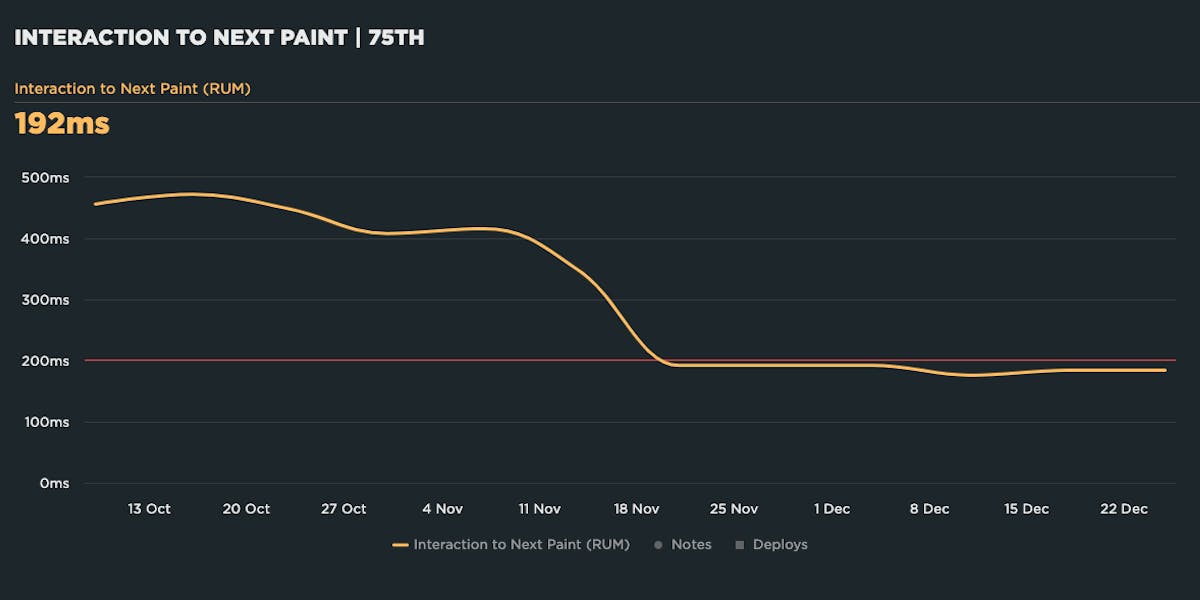
- Interaction to Next Paint (INP) – How quickly a page responds to a user interaction. INP measures input delay, running time of event handlers and presentation delay. A lot of INP delays happen when the browser's main thread is too busy to respond to the user. Commonly, this is due to the browser being busy parsing and executing large JavaScript files. Because INP measures real user interactions, it can only be measured with RUM tools.
- Total Blocking Time (TBT) – How responsive a page is. While Total Blocking Time is a Web Vital, it's not a Core Web Vital. It bears discussion here as it is a companion metric to INP. TBT measures the total amount of time between First Contentful Paint (FCP) and Time to Interactive (TTI) when the main thread was blocked for long enough to prevent input responsiveness. TBT is measured in synthetic testing tools.
It's important to make the distinction between Core Web Vitals and Web Vitals. Core Web Vitals focus on user experience metrics. They are a subset of Web Vitals – including Time to First Byte and Total Blocking Time – that serve as supplemental metrics for diagnosing specific performance issues.
Core Web Vitals and SEO
Core Web Vitals are among the page experience signals that Google factors into search ranking, alongside mobile-friendliness, security, and absence of intrusive interstitials. Since Web Vitals were announced, they've shot to the top of many people's list of things to care about.
There is not yet a great deal of public-facing research that demonstrate a correlation between improved Core Web Vitals and improved search ranking. However, this case study from Sistrix suggests that pages that meet all Google's Web Vitals requirements rank slightly higher, while those that fail to meet requirements rank significantly worse.
Great performance isn't a substitute for poor content. When it comes to user experience, quality content is still king. Google acknowledges this as well:
"While page experience is important, Google still seeks to rank pages with the best information overall, even if the page experience is subpar. Great page experience doesn't override having great page content. However, in cases where there are many pages that may be similar in relevance, page experience can be much more important for visibility in Search."
Don't make pages faster solely for SEO purposes. You should make your pages leaner and faster because it makes your users happier and consumes less of their data, especially on mobile devices. Not surprisingly, happier users spend more time (and more money) on your site, are more likely to return, and are more likely to recommend your site to others.
Core Web Vitals and business impact
Because Core Web Vitals focus on user experience, it stands to reason that improving Vitals will result in happier users who spend more time – and money – on your site. There have been some notable case studies that demonstrate this.
Vodafone: A 31% improvement in LCP increased sales by 8%
Vodafone conducted an A/B test that focused on optimizing Web Vitals. They found that a 31% improvement in LCP led to:
- 8% more sales
- 15% improvement in lead-to-visit rate
- 11% improvement in cart-to-visit rate
Swappie: Increased mobile revenue by 42% by focusing on Core Web Vitals
Swappie reduced LCP by 55%, CLS by 91%, and FID by 90%. As a result of these improvements, they saw a 42% increase in revenue from mobile visitors.
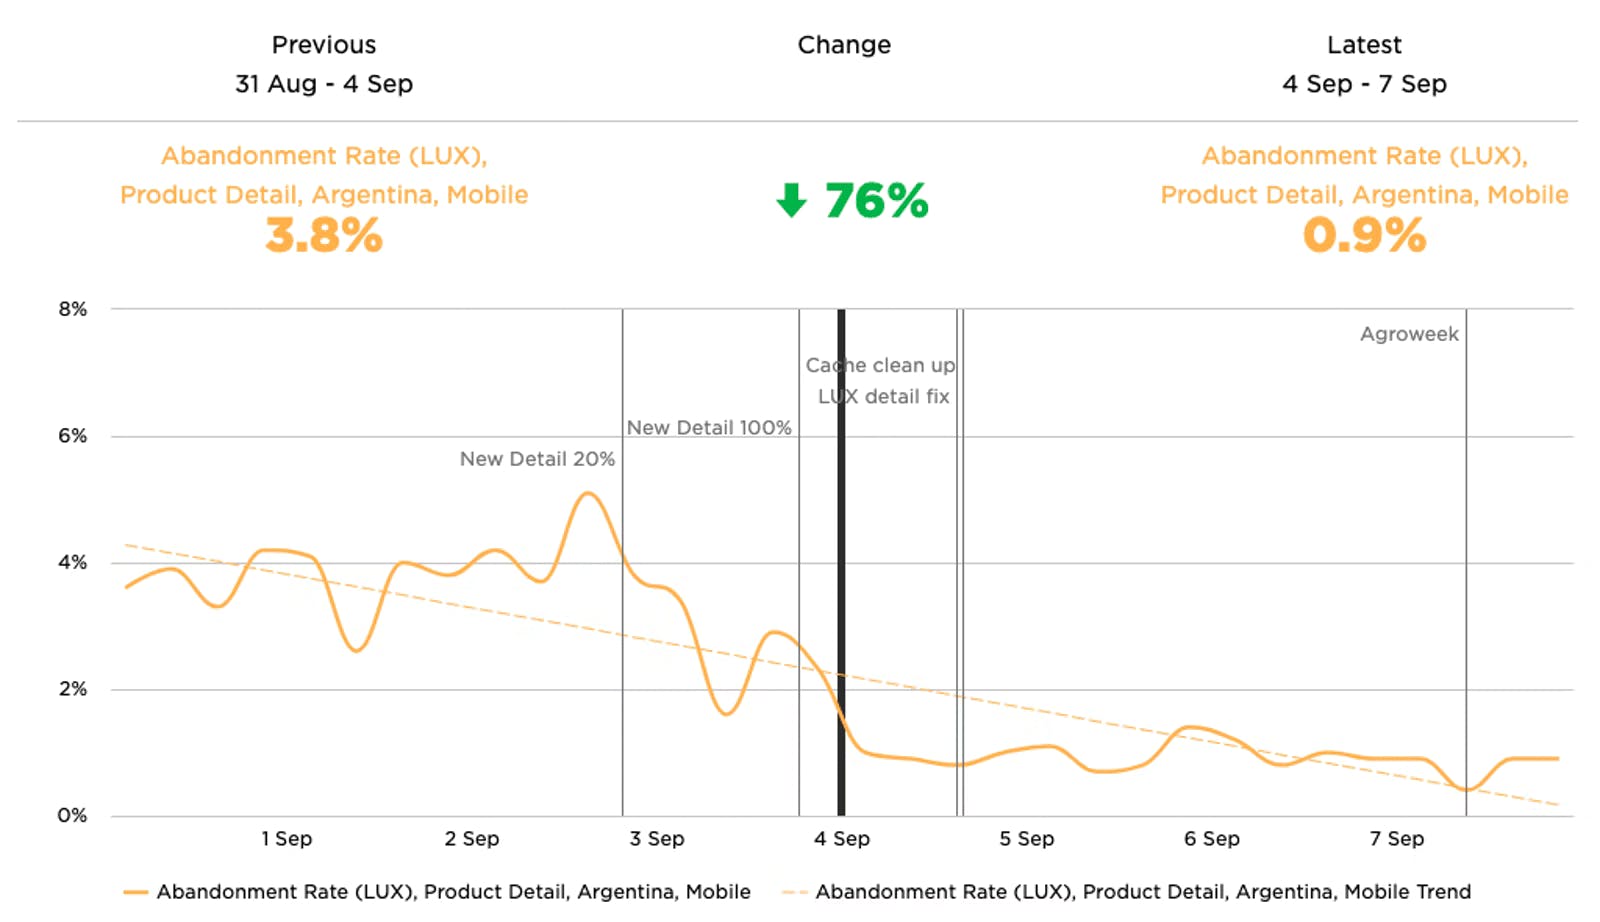
Agrofy: A 70% improvement in LCP correlated to a 76% reduction in load abandonment
Agrofy improved LCP by 70% and CLS by 72%, which correlated to a 76% reduction in load abandonment (from 3.8% to 0.9%).
More: Roundup of other case studies that show the business impact of Core Web Vitals
Largest Contentful Paint (LCP)
Largest Contentful Paint measures when the largest visual element on the page renders. LCP is measurable with both synthetic and real user monitoring (RUM).

What makes LCP slower?
Common issues that can hurt LCP:
- LCP resource is not discoverable by the browser in the initial HTML document, e.g. if the LCP element is dynamically added to the page via JavaScript.
- Slow or blocking scripts and stylesheets that load at the beginning of the page's rendering path can delay when images start to render.
- Unoptimized images with excessive load times. LCP includes the entire time it takes for the image to finish rendering. If your image starts to render at the 1-second mark but takes 4 seconds to fully render, then your LCP time is 5 seconds.
How to investigate LCP issues
To improve LCP time, you need to first understand the critical rendering path for your pages, and then identify the issues that are delaying your largest paint element. Synthetic monitoring can help identify which of the issues described above is the culprit.
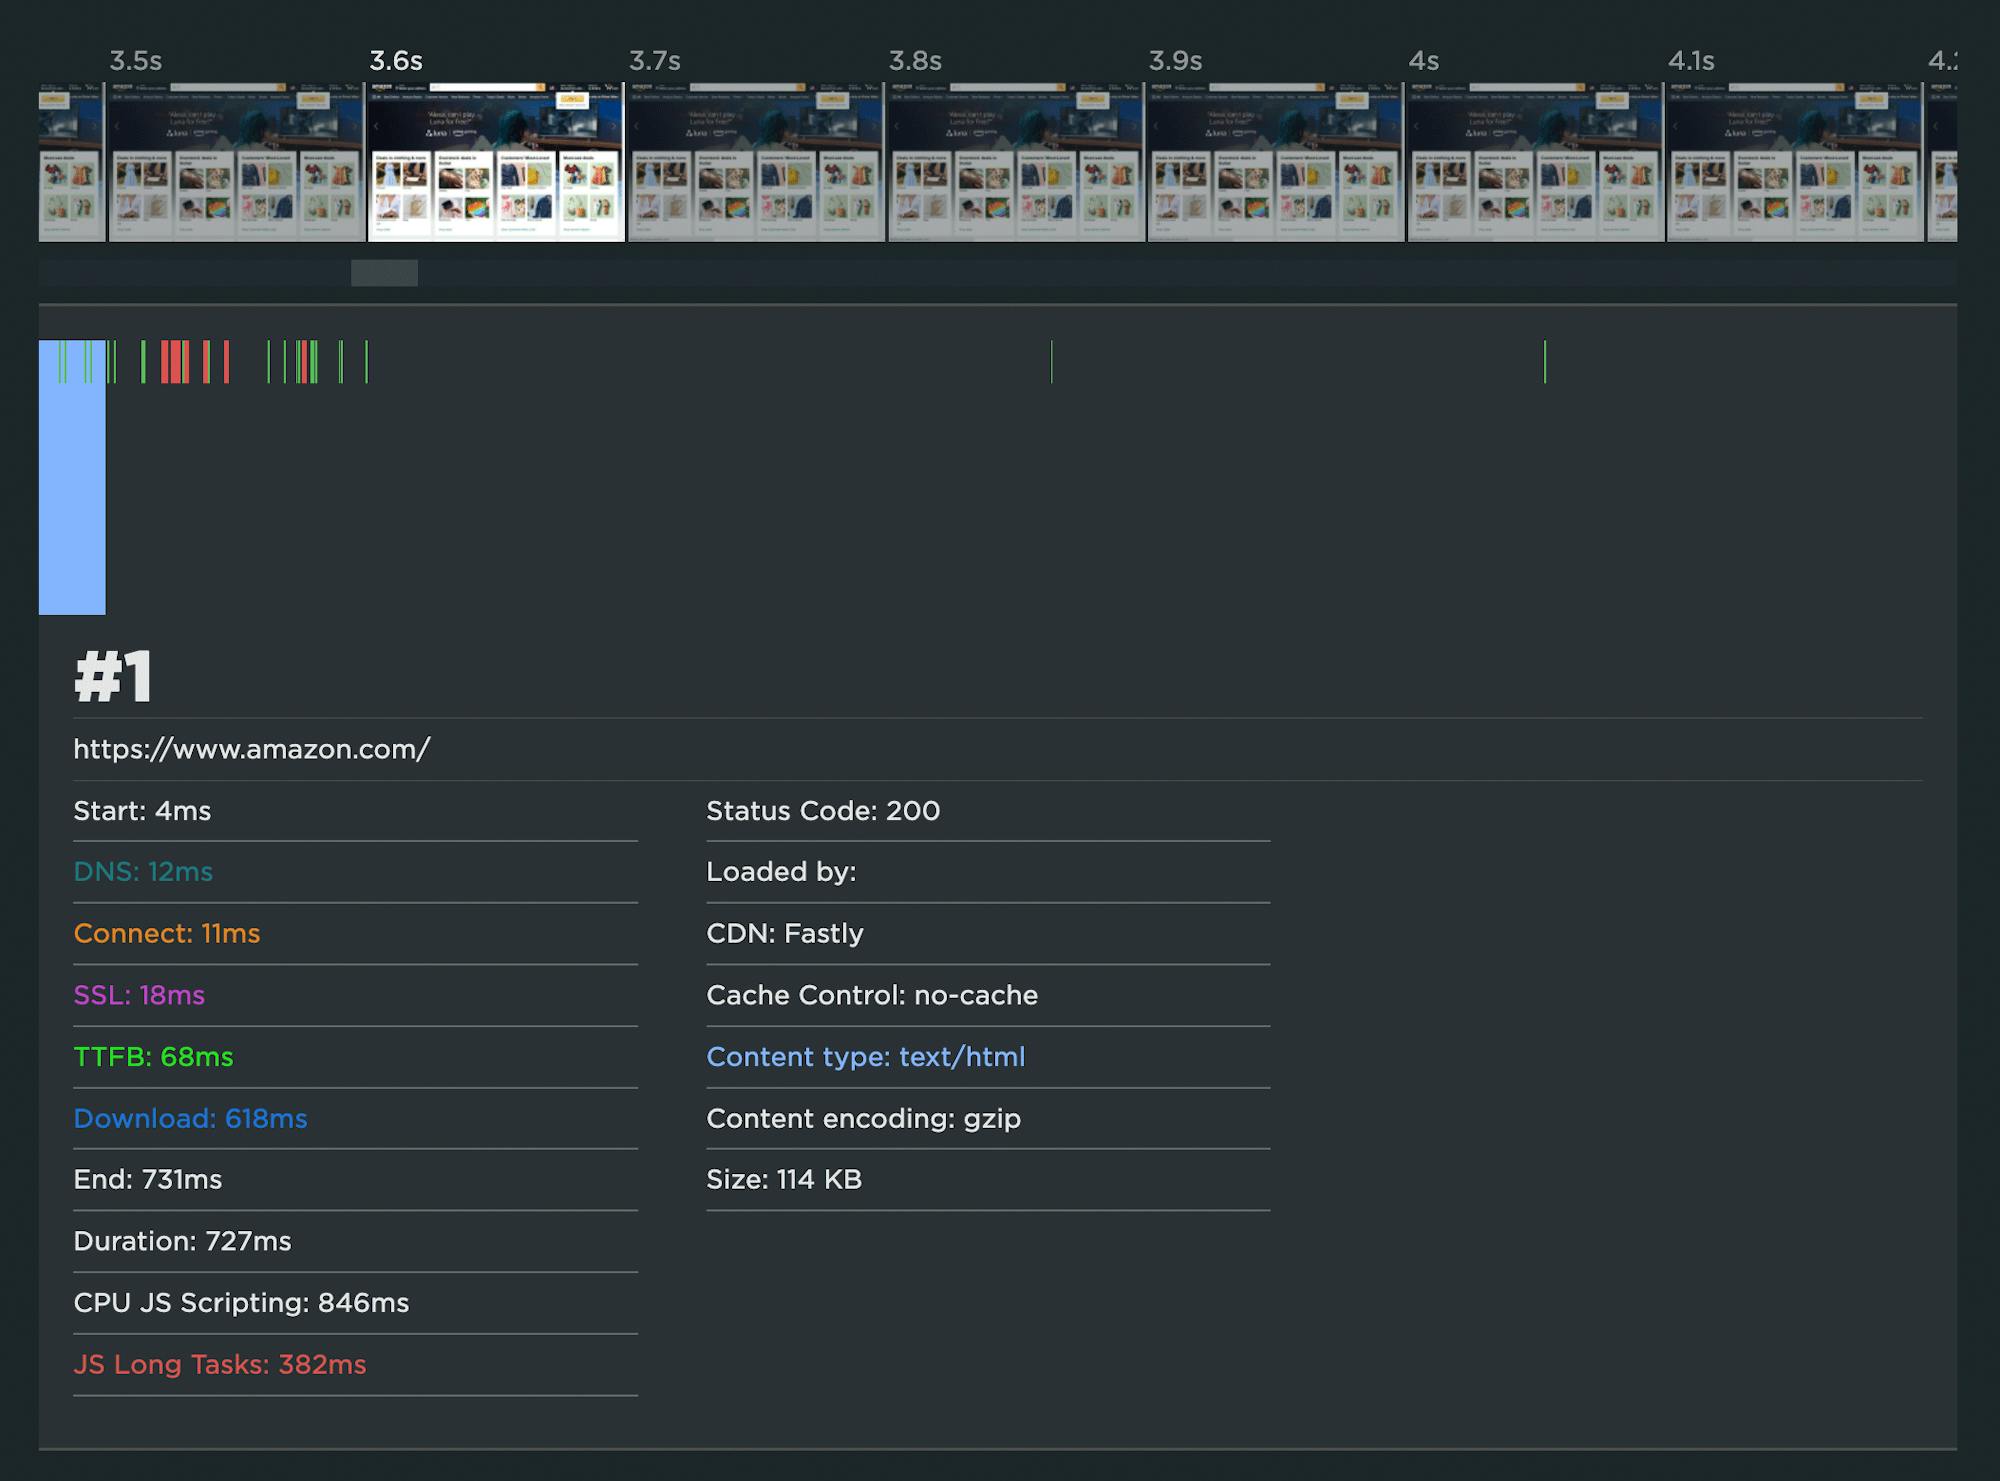
For example, this synthetic test result for the Amazon home page shows that the LCP time is 3.63 seconds – in other words, outside Google's threshold of 2.5 seconds. You can also see that the LCP resource is actually a collection of images, not a single image:

The high-level waterfall chart for this page shows that the LCP event fires after many other key metrics, including Start Render:
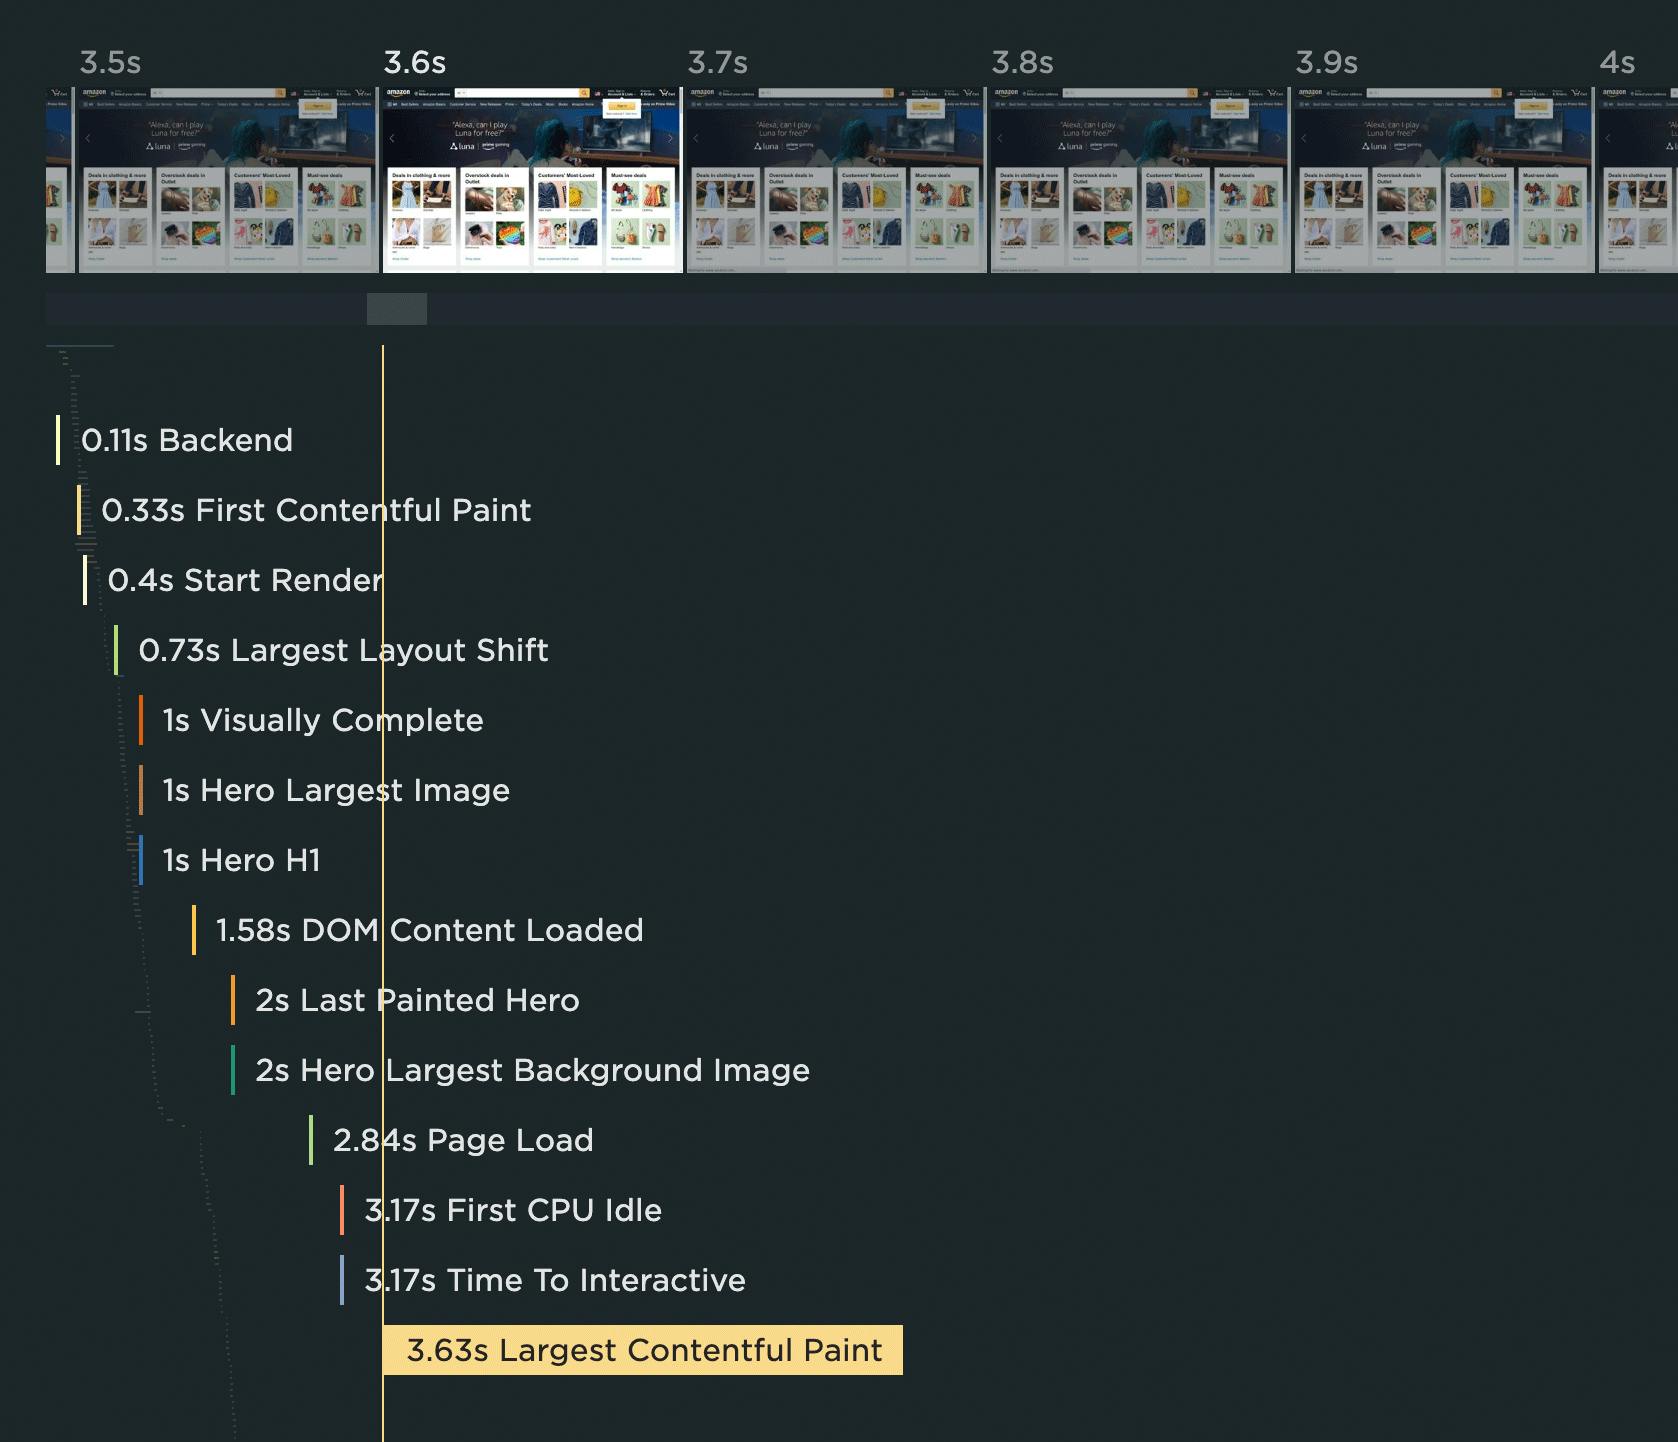
Expanding the waterfall chart reveals a few things:
1. The HTML document has a Long Tasks time of 382 milliseconds. If you look closely below, you can see that it doesn't fully parse until 3.6 seconds. The red bars indicate all the Long Tasks for this resource.
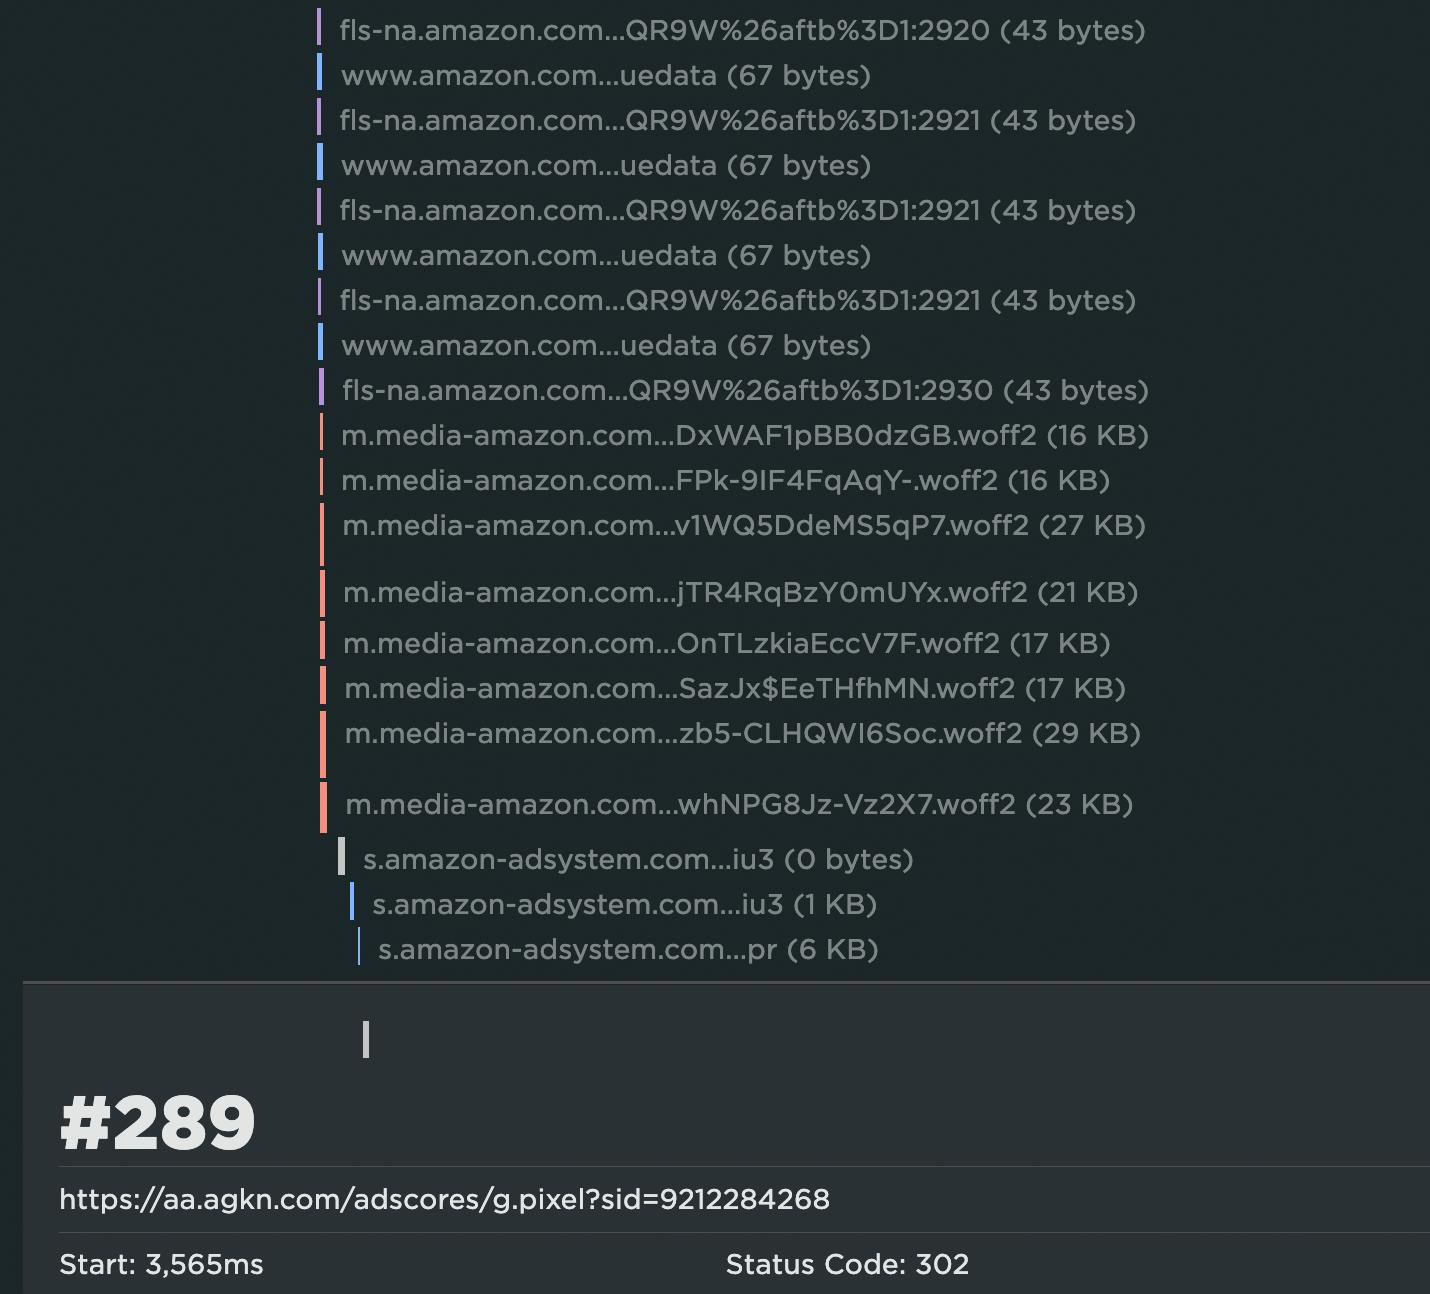
2. There are 289 resources that are rendered before the LCP event, the bulk of which are images.
3. Some or all of these images have been served in JavaScript bundles that take an excessive amount of time to execute. The green and red bars in the waterfall show when the browser is working to execute the JS, and the red bars indicate Long Tasks. You can see below how much JS execution takes place before LCP:
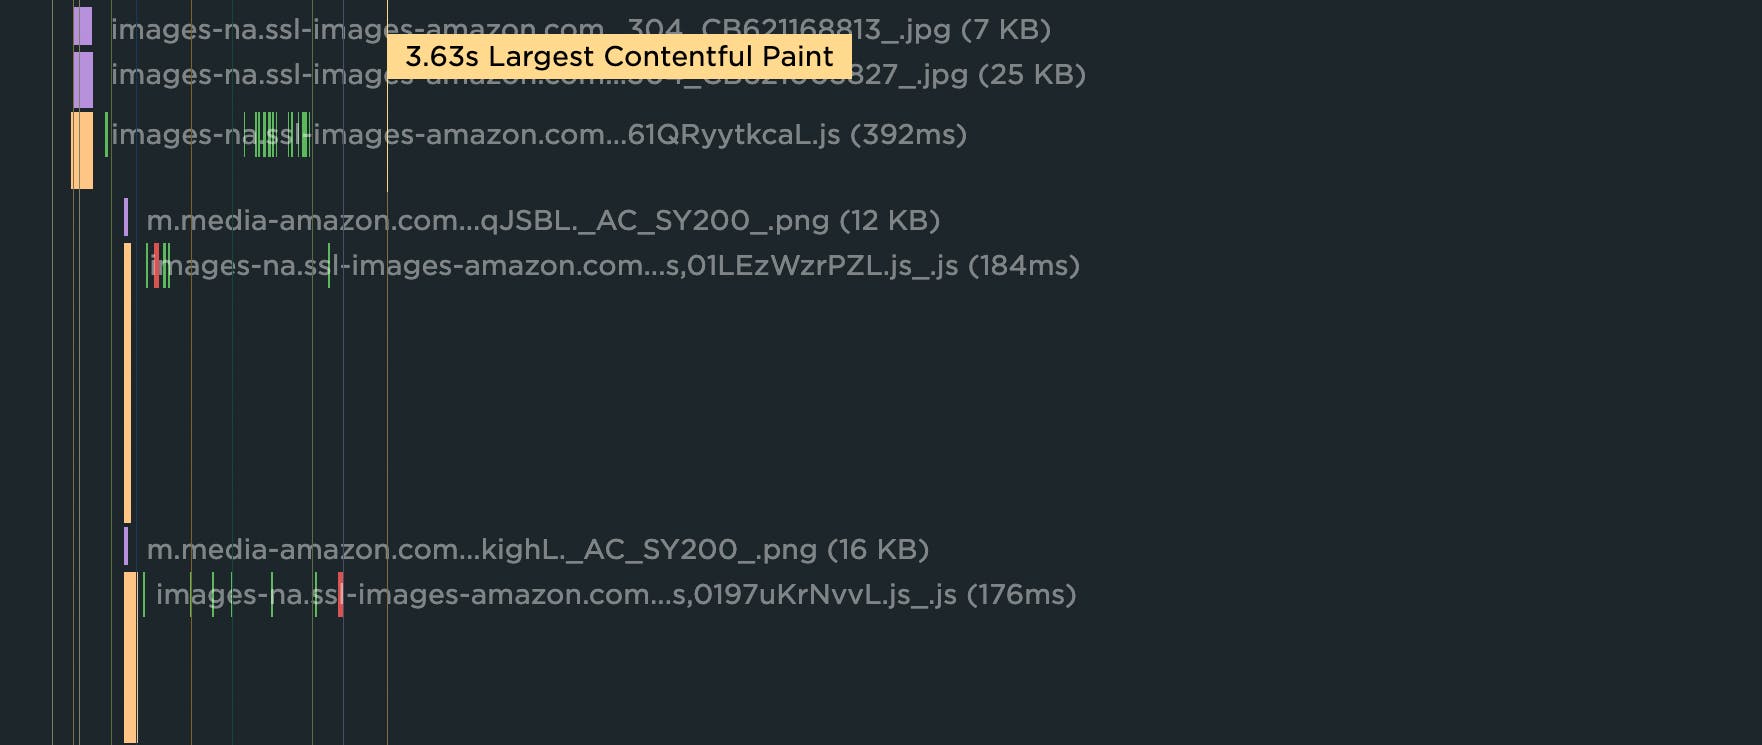
4. Many of the images in those JS bundles are outside the viewport. This means they could have been deferred/lazy-loaded.
How to improve LCP
- Request key hero image early
- Use srcset and efficient modern image formats
- Use compression
- Lazy-load offscreen images
- Set height and width dimensions for images
- Use CSS aspect-ratio or aspect-ratio boxes
- Avoid images that cause network congestion with critical CSS and JS
- Eliminate/reduce render-blocking resources
More: Optimize Largest Contentful Paint
Web Vitals badges on performance recommendations
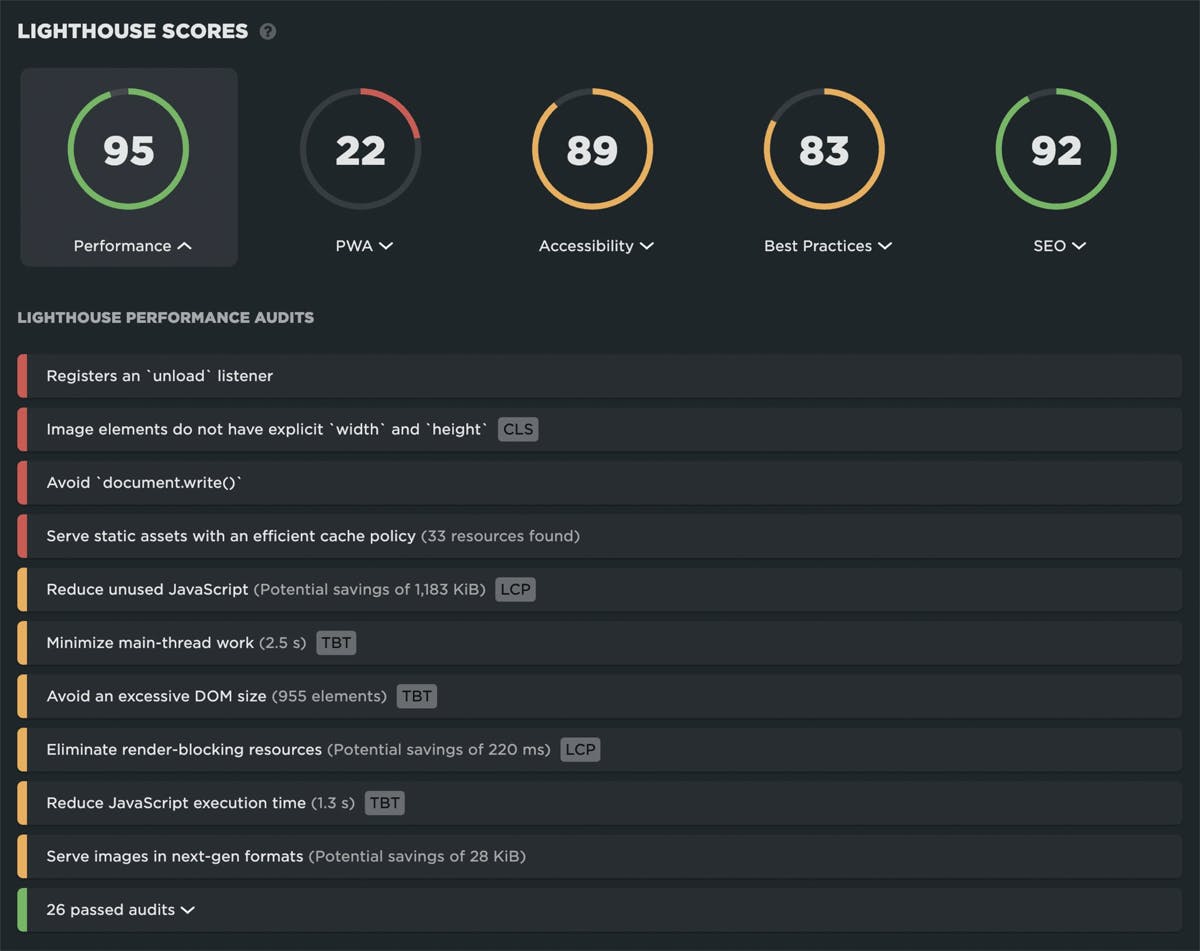
In SpeedCurve, all the performance optimization recommendations you see on your Vitals and Improve dashboards – as well as in your synthetic test details – are badged so you can see which Web Vital they affect. When you fix those issues, you should see improvements in your Vitals and Lighthouse scores.
Interaction to Next Paint (INP)
Interaction to next paint is a responsiveness metric that replaces First Input Delay as a Core Web Vital. Like it's predecessor, INP measures real user interactions and can only be measured with RUM tools.

A few technicalities about INP that you may care about:
- The user input required for INP is defined as a click/tap or key press. It doesn't include scroll or zoom.
- INP can be measured in traditional applications as well as SPAs.
- INP uses the Event Timing API which is supported in Chrome and Firefox (not available for Safari)
What makes INP slower?
- Long-running JavaScript event handlers
- Input delay due to Long Tasks blocking the main thread
- Poorly performing JavaScript frameworks
- Page complexity leading to presentation delay
Like FID, input delay can happen when the browser's main thread is too busy to respond to the user. Most commonly, this is due to the browser being busy parsing and executing large JavaScript files. There's a lot of unnecessary JS on many pages, and JS files have gotten bigger over the years. The more JS on your page, the more potential for slow INP times.
How to investigate INP issues
While it's possible to simulate interactions in synthetic, INP can only be measured in RUM. This makes it fairly simple to track, but difficult to investigate. We recommend measuring Total Blocking Time (TBT) in your synthetic monitoring, alongside measuring INP in RUM. Additionally, you can use Interaction (IX) Elements in SpeedCurve RUM to help isolate the most common elements users are interacting with. Look for more diagnostic capability for INP in future releases.
How to improve INP
- Optimize poorly performing event handlers
- Eliminate Long Tasks by breaking up long-running code into smaller async tasks
- Reduce overall number of resource requests
- Optimize third parties, e.g., defer "below-the-fold" and other non-essential scripts
- Minimize CPU main thread activity, e.g., use a web worker to run JS on a background thread
- Code splitting, i.e., minimize the amount of script that needs to be parsed and compiled by splitting JavaScript bundles to only send the code needed for the initial route
- Reduce DOM and layout complexity to reduce presentation delay
More: Optimize Interaction to Next Paint
Total Blocking Time (TBT)
Total Blocking Time is a Web Vital, not a Core Web Vital, but it bears discussion here. TBT measures the total amount of time between First Contentful Paint (FCP) and Time to Interactive (TTI) when the main thread was blocked for long enough to prevent input responsiveness. TBT is measured in synthetic testing tools.

There are a couple of caveats you should be aware of if you're tracking Total Blocking Time:
- Total Blocking Time only tracks the Long Tasks between First Contentful Paint (FCP) and Time to Interactive (TTI). For this reason, the name "Total Blocking Time" is a bit misleading. Any Long Tasks that happen before FCP and block the page from rendering are NOT included in Total Blocking Time. TBT is not in fact the "total" blocking time for the page. It's better to think of it as "blocking time after start render".
- TBT doesn't include the first 50ms of each Long Task. Instead, it reports just the time spent beyond the first 50ms. A user still had to wait for that first 50ms. It would be easier to interpret TBT if it included the first 50ms and better represented the full length of time a user was blocked by a long task.
How to investigate TBT issues
We recommend tracking Long Tasks alongside TBT to identify all the Long Tasks from initial page navigation right through to fully loaded. Focus on the Long Tasks metric to get a full understanding of the impact Long Tasks have on the whole page load and your users.
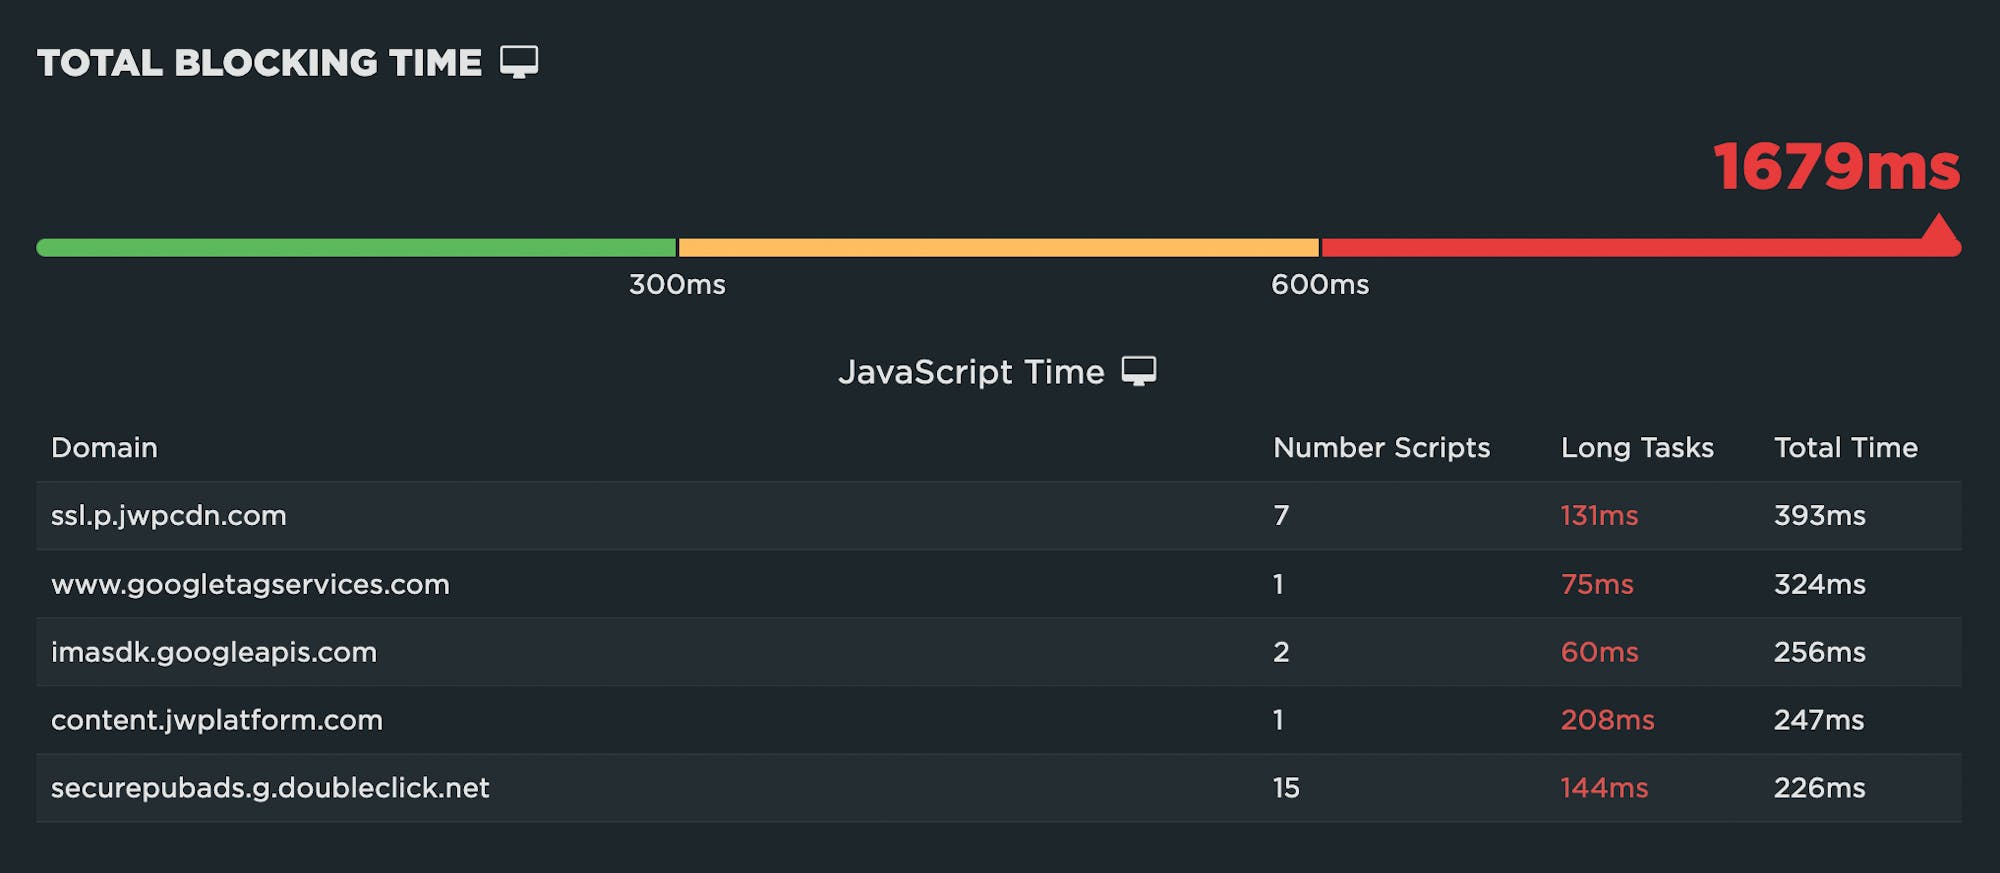
How to improve TBT
If your charts suffer from a red rash of Long Tasks, many of the same solutions that apply to INP can also be applied here, including:
- Optimize JavaScript execution
- Code splitting
- Evaluate code in your idle periods (using Philip Walton's Idle Until Urgent)
The key principle is to break your JavaScript tasks into smaller chunks. That gives the browser main thread a chance to breath and render some pixels or respond to user input. Optimizations that improve your TBT results should also improve your INP results.
More: How to improve TBT
Cumulative Layout Shift (CLS)
Cumulative Layout Shift measures the visual stability of a page. The human-friendly definition is that CLS helps you understand how likely a page is to deliver a janky, unpleasant experience to viewers.
CLS is a formula-based metric that takes into account how much a page's visual content shifts within the viewport, combined with the distance that those visual elements shifted. CLS can be measured with both synthetic and RUM.

What makes CLS worse?
One of the benefits of Cumulative Layout Shift is that it makes us think outside of the usual time-based metrics, and instead gets us thinking about the other subtle ways that unoptimized page elements can degrade the user experience.
CLS is strongly affected by the number of resources on the page, and by how and when those resources are served. If your CLS score is poor, some of the biggest culprits are:
- Web fonts – There can be a significant discrepancy between the sizes of the default and custom fonts, which creates layout shifts. While it's good practise to not hide your content while waiting for a web font to load, it can negatively impact your CLS score if the web font then moves an element when it renders.
- Opacity changes – CLS doesn't take into account opacity changes, so adding an element with opacity 0 and then moving it will affect your CLS score.
- Ads – They can cause the entire editorial body of the page to shift. The size of the shifting element really matters when it comes to calculating CLS.
- Carousels – A surprising number of carousels use non-composited animations that can contribute to CLS issues. On pages with autoplaying carousels, this has the potential to cause infinite layout shifts.
- Infinite scroll – Some implementations can cause layout shifts.
- Images – Slow-loading images (e.g. large images or images on slow connections) can cause shifts if they load after the rest of the page has already rendered.
- Banners and other notices – These can cause other page elements to shift if they render after the rest of the page.
How to investigate CLS issues
One of the big challenges with CLS is understanding which elements actually moved on the page, when they moved, and by how much. To help with debugging your CLS scores, SpeedCurve includes visualizations that show each layout shift and how each individual shift adds up to the final cumulative metric.
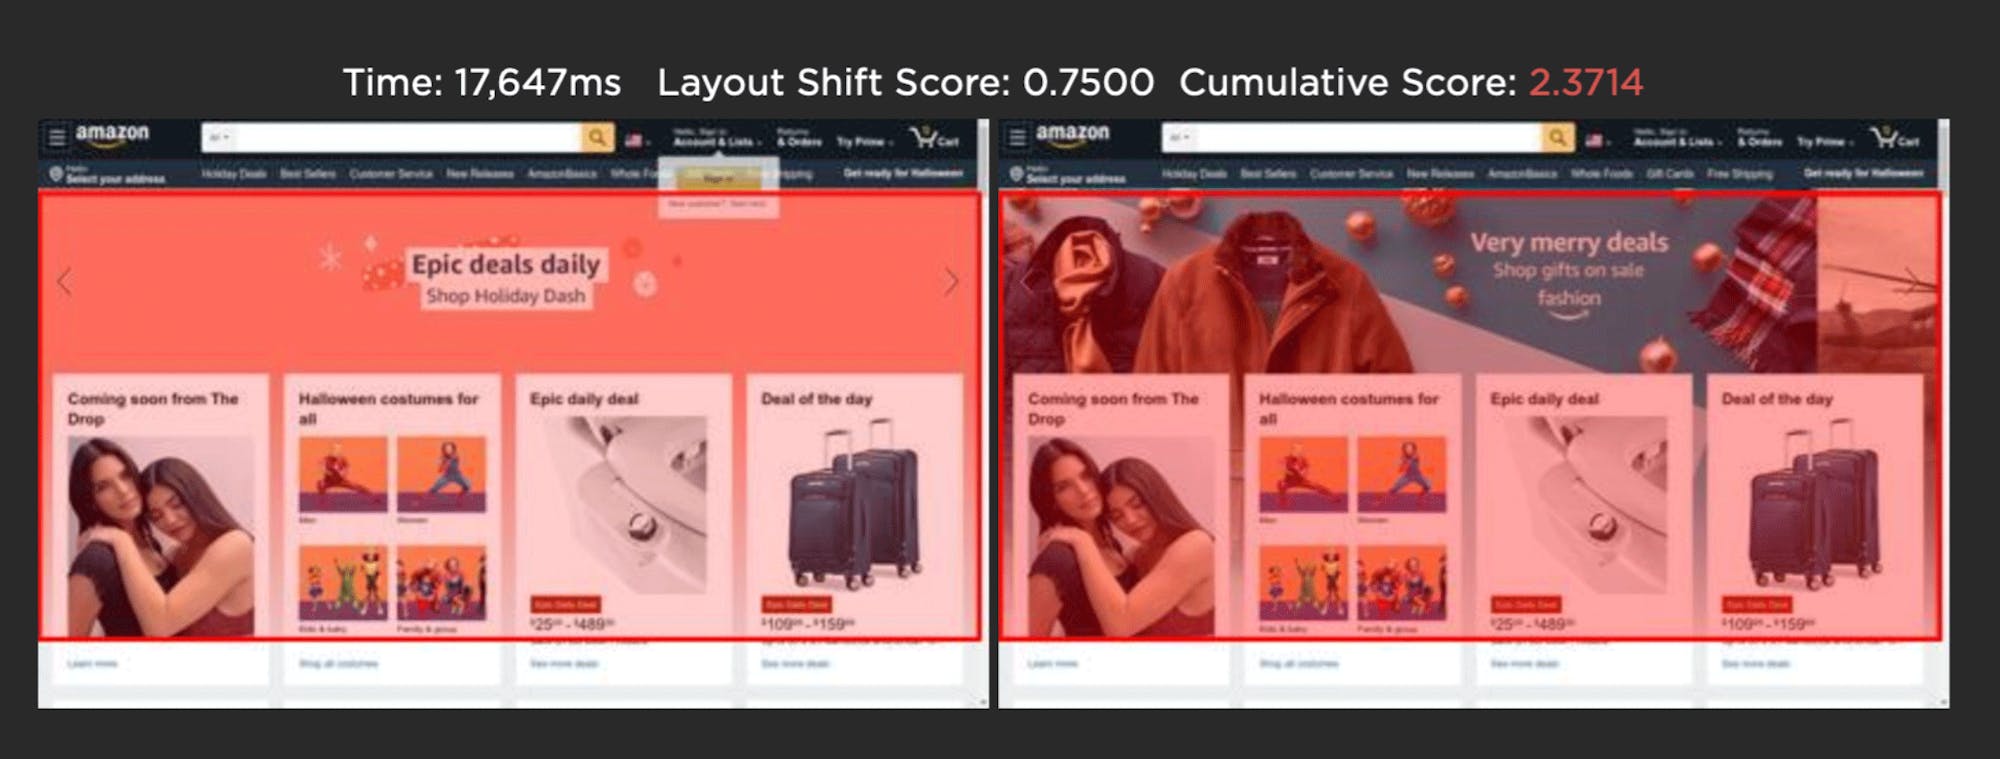
For each layout shift, you see the filmstrip frame right before and right after the shift occurs. The red box highlights the elements that moved, so you can see exactly which elements caused the shift. The Layout Shift Score for each shift also helps you understand the impact of that shift and how it adds to the cumulative score.
Visualizing each layout shift can help you spot issues with the way your page is being rendered. Here are some sample issues from analyzing layout shifts on two pages:
The size of the shifting element matters
Some layout shifts can be quite hard to spot when looking at just the filmstrip or a video of a page loading. In the example below, the main content of The Irish Times page only moves a small amount, but because of its large size the Layout Shift Score is quite high, adding 0.114 to the cumulative score.
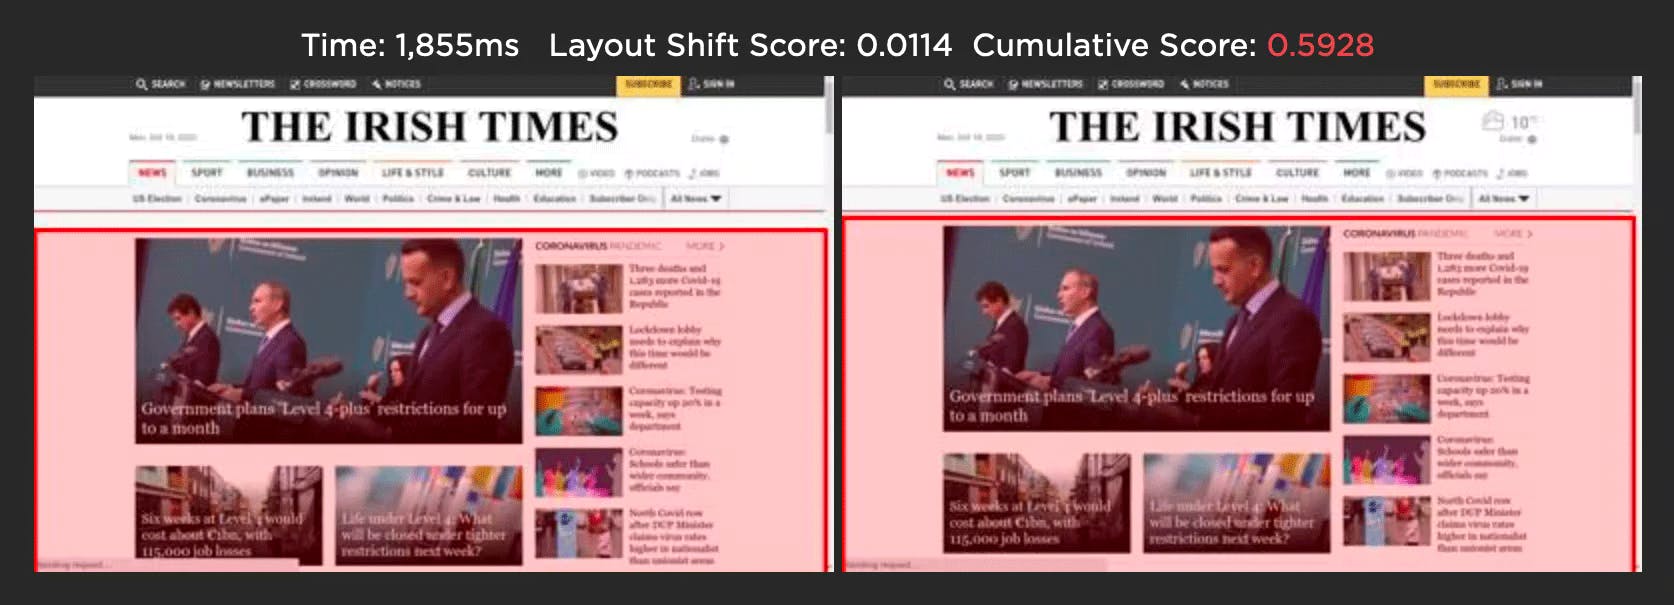
Image carousels can generate false positives
The Amazon home page below uses an image carousel to slide a number of promotions across the page. While the user experience is fine, CLS gives this a poor score as the layout shift analysis only looks at how elements move on the page. In this scenario, you could avoid a poor CLS score by using CSS transform to animate any elements.
When tracking CLS, keep in mind that your results may vary depending on how your pages are built, which measurement tools you use, and whether you're looking at RUM or synthetic data. If you use both synthetic and RUM monitoring:
- Use your RUM data for your source of truth. Set your performance budgets and provide reporting with this data. Expect RUM and CrUX data to become more aligned over time.
- Use synthetic data to visually identify where shifts are happening and improve from there. Focus on the largest layouts first. Some shifts are so small that you may not want to bother chasing them.
How to improve CLS
- Set height and width dimensions on images and videos
- Use CSS aspect-ratio or aspect-ratio boxes
- Avoid images that cause network congestion with critical CSS and JS
- Match the size of default fonts and rendered web fonts, or reserve space for the final rendered text so that layout changes don't ripple through the DOM
- Use CSS transform to animate any elements in image carousels
- Avoid inserting dynamic content (e.g., banners, pop-ups) above existing content

