SpeedCurve is now part of the Embrace family! There are no changes to how you use our products. Our founder Mark shares what this means...
Business Success
Core Web Vitals
- Getting Started With CWV
- Largest Contentful Paint (LCP)
- Interaction to Next Paint (INP)
- Cumulative Layout Shift (CLS)
Optimization Techniques
- Web Performance Budgets
- Diagnose Time to First Byte
- Optimizing Images
- Optimizing JavaScript
- Third-Party Web Performance
- Critical CSS for Faster Rendering
- Optimizing Single Page Apps
- Caching for Faster Load Times
Metrics & Charts
Understanding and Improving Cumulative Layout Shift (CLS)
Cumulative Layout Shift measures the visual stability of a page. The human-friendly definition is that CLS helps you understand how likely a page is to deliver a janky, unpleasant experience to viewers.

CLS is a formula-based metric that takes into account how much a page's visual content shifts within the viewport, combined with the distance that those visual elements shifted. CLS can be measured with both synthetic and RUM. Google recommends that your pages have a CLS score of 0.1 or less.
What makes CLS worse?
One of the benefits of Cumulative Layout Shift is that it makes us think outside of the usual time-based metrics, and instead gets us thinking about the other subtle ways that unoptimized page elements can degrade the user experience.
CLS is strongly affected by the number of resources on the page, and by how and when those resources are served. If your CLS score is poor, some of the biggest culprits are:
- Web fonts – There can be a significant discrepancy between the sizes of the default and custom fonts, which creates layout shifts. While it's good practise to not hide your content while waiting for a web font to load, it can negatively impact your CLS score if the web font then moves an element when it renders.
- Opacity changes – CLS doesn't take into account opacity changes, so adding an element with opacity 0 and then moving it will affect your CLS score.
- Ads – They can cause the entire editorial body of the page to shift. The size of the shifting element really matters when it comes to calculating CLS.
- Carousels – A surprising number of carousels use non-composited animations that can contribute to CLS issues. On pages with autoplaying carousels, this has the potential to cause infinite layout shifts.
- Infinite scroll – Some implementations can cause layout shifts.
- Images – Slow-loading images (e.g. large images or images on slow connections) can cause shifts if they load after the rest of the page has already rendered.
- Banners and other notices – These can cause other page elements to shift if they render after the rest of the page.
How to investigate CLS issues
One of the big challenges with CLS is understanding which elements actually moved on the page, when they moved, and by how much. To help with debugging your CLS scores, SpeedCurve includes visualizations that show each layout shift and how each individual shift adds up to the final cumulative metric.
For each layout shift, you see the filmstrip frame right before and right after the shift occurs. The red box highlights the elements that moved, so you can see exactly which elements caused the shift. The Layout Shift Score for each shift also helps you understand the impact of that shift and how it adds to the cumulative score.
Visualizing each layout shift can help you spot issues with the way your page is being rendered. Here are some sample issues from analyzing layout shifts on two pages:
The size of the shifting element matters
Some layout shifts can be quite hard to spot when looking at just the filmstrip or a video of a page loading. In the example below, the main content of The Irish Times page only moves a small amount, but because of its large size the Layout Shift Score is quite high, adding 0.114 to the cumulative score.
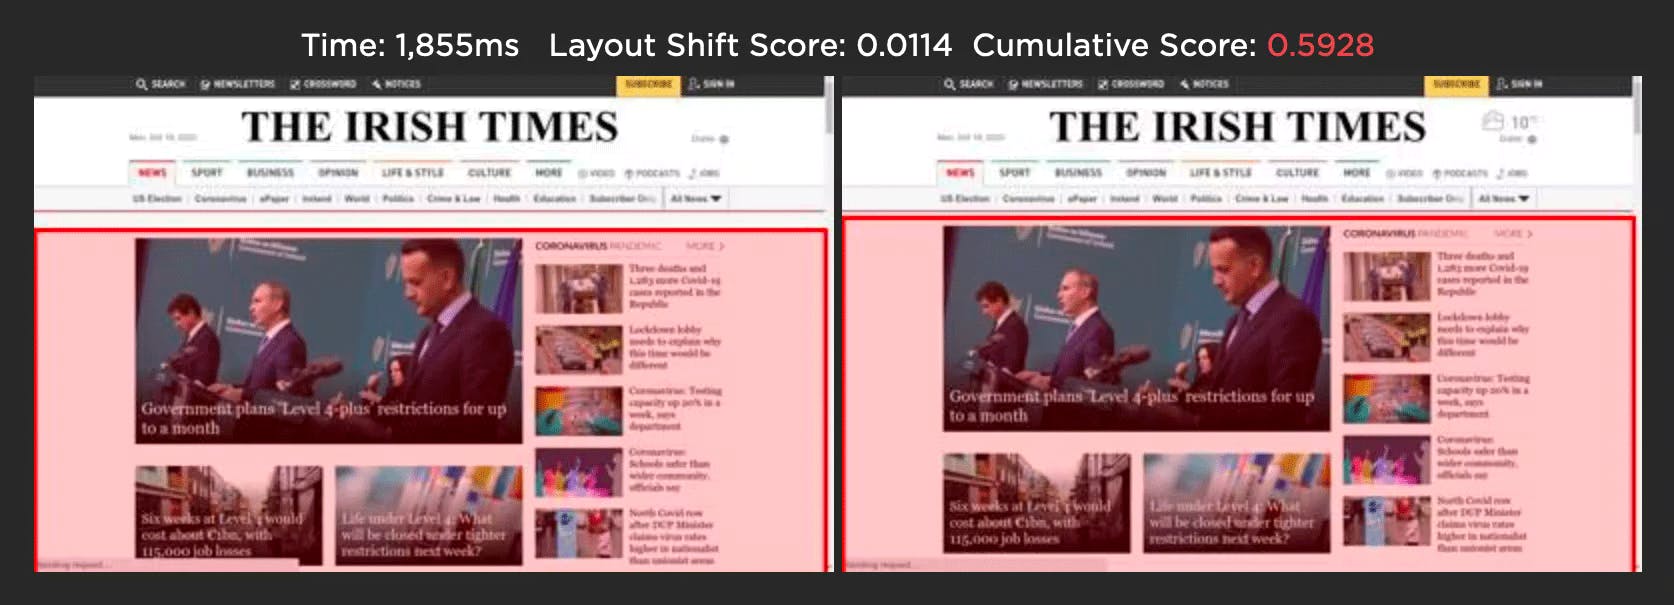
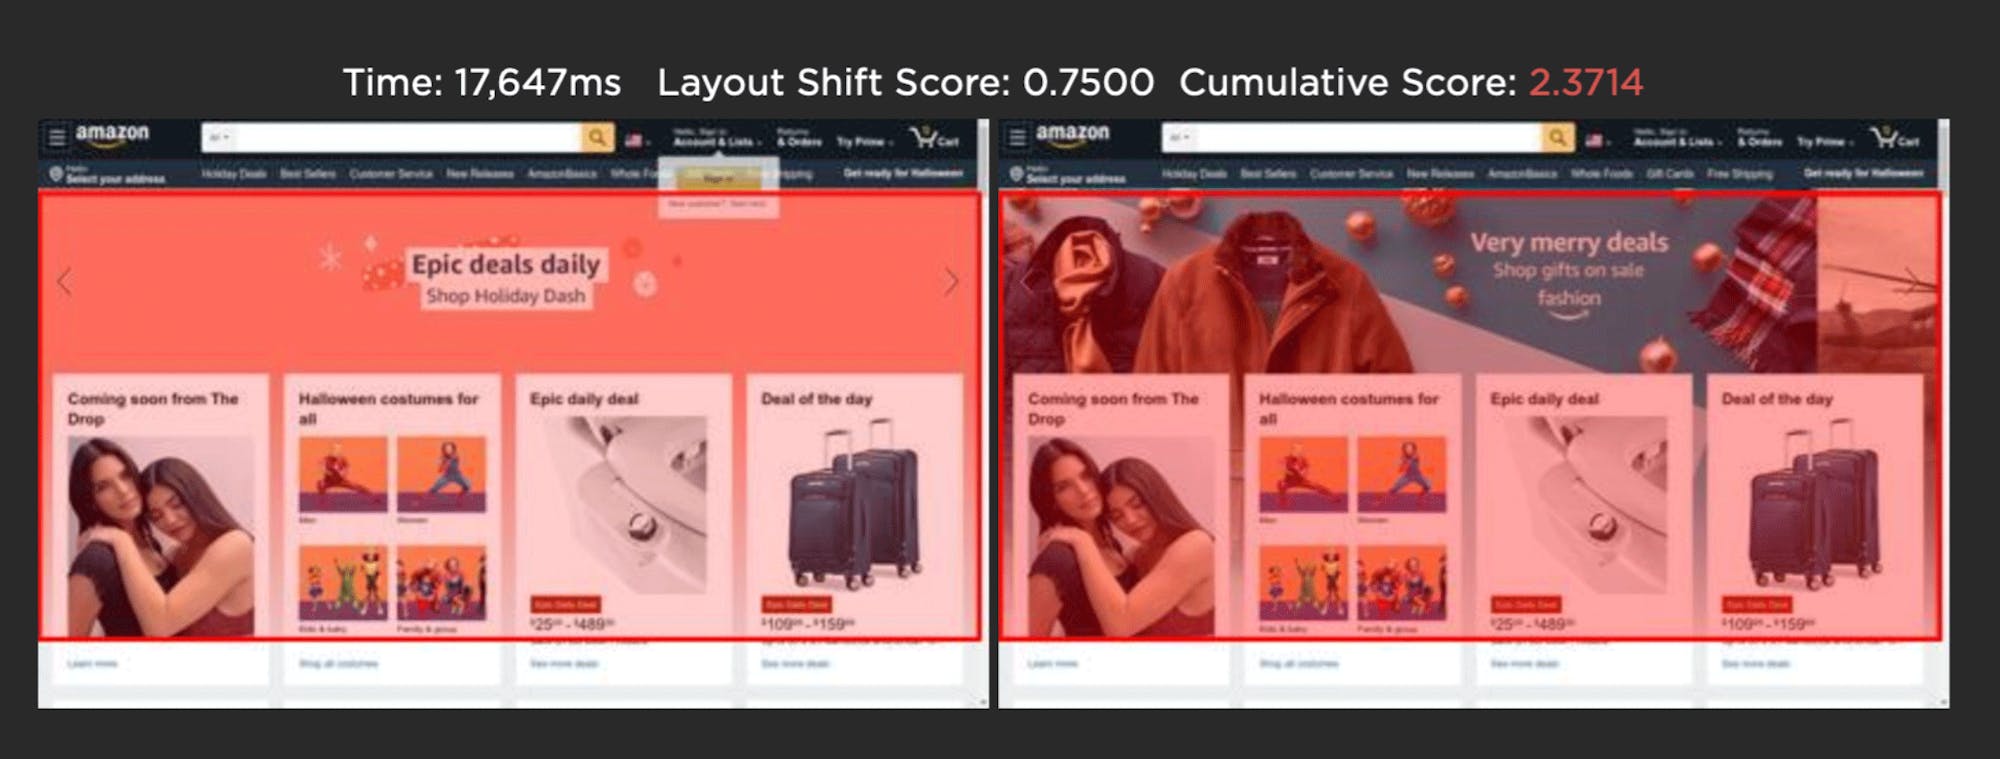
Image carousels can generate false positives
The Amazon home page below uses an image carousel to slide a number of promotions across the page. While the user experience is fine, CLS gives this a poor score as the layout shift analysis only looks at how elements move on the page. In this scenario, you could avoid a poor CLS score by using CSS transform to animate any elements.
When tracking CLS, keep in mind that your results may vary depending on how your pages are built, which measurement tools you use, and whether you're looking at RUM or synthetic data. If you use both synthetic and RUM monitoring:
- Use your RUM data for your source of truth. Set your performance budgets and provide reporting with this data. Expect RUM and CrUX data to become more aligned over time.
- Use synthetic data to visually identify where shifts are happening and improve from there. Focus on the largest layouts first. Some shifts are so small that you may not want to bother chasing them.
How to improve CLS
- Set height and width dimensions on images and videos
- Use CSS aspect-ratio or aspect-ratio boxes
- Avoid images that cause network congestion with critical CSS and JS
- Match the size of default fonts and rendered web fonts, or reserve space for the final rendered text so that layout changes don't ripple through the DOM
- Use CSS transform to animate any elements in image carousels
- Avoid inserting dynamic content (e.g., banners, pop-ups) above existing content
More: Optimize Cumulative Layout Shift

Read Next

Everything you need to know about Core Web Vitals – from SEO and business impact to how to monitor and fix issues with each Vital.
Learn what INP is, how to identify and debug slow interactions... and most important, how to make them faster!
