SpeedCurve is now part of the Embrace family! There are no changes to how you use our products. Our founder Mark shares what this means...
Business Success
Core Web Vitals
- Getting Started With CWV
- Largest Contentful Paint (LCP)
- Interaction to Next Paint (INP)
- Cumulative Layout Shift (CLS)
Optimization Techniques
- Web Performance Budgets
- Diagnose Time to First Byte
- Optimizing Images
- Optimizing JavaScript
- Third-Party Web Performance
- Critical CSS for Faster Rendering
- Optimizing Single Page Apps
- Caching for Faster Load Times
Metrics & Charts
Understanding and Improving Largest Contentful Paint (LCP)
Largest Contentful Paint (LCP) measures when the largest visual element on the page renders. To make Google happy, aim for an LCP time under 2.5 seconds. Here's everything you need to know to start measuring, debugging, and optimizing LCP.

What makes LCP slow?
Common issues that can hurt Largest Contentful Paint times:
- LCP resource is not discoverable by the browser in the initial HTML document, e.g. if the LCP element is dynamically added to the page via JavaScript.
- Slow or blocking scripts and stylesheets that load at the beginning of the page's rendering path can delay when images start to render.
- Unoptimized images with excessive load times. LCP includes the entire time it takes for the image to finish rendering. If your image starts to render at the 1-second mark but takes 4 seconds to fully render, then your LCP time is 5 seconds.
How to investigate LCP issues
To improve LCP time, you need to first understand the critical rendering path for your pages, and then identify the issues that are delaying your largest paint element. Synthetic monitoring can help identify which of the issues described above is the culprit.
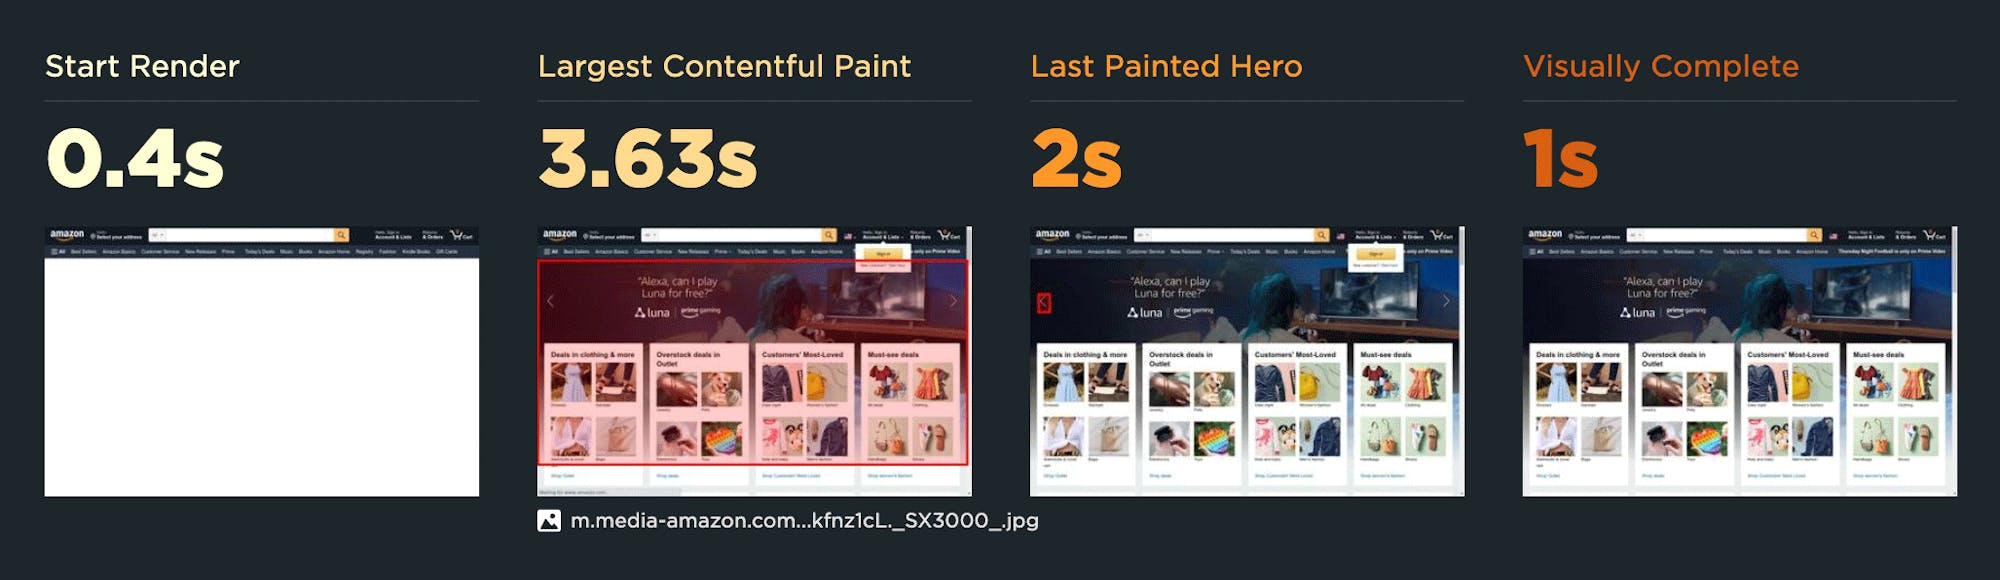
For example, this synthetic test result for the Amazon home page shows that the LCP time is 3.63 seconds – in other words, outside Google's threshold of 2.5 seconds. You can also see that the LCP resource is actually a collection of images, not a single image:
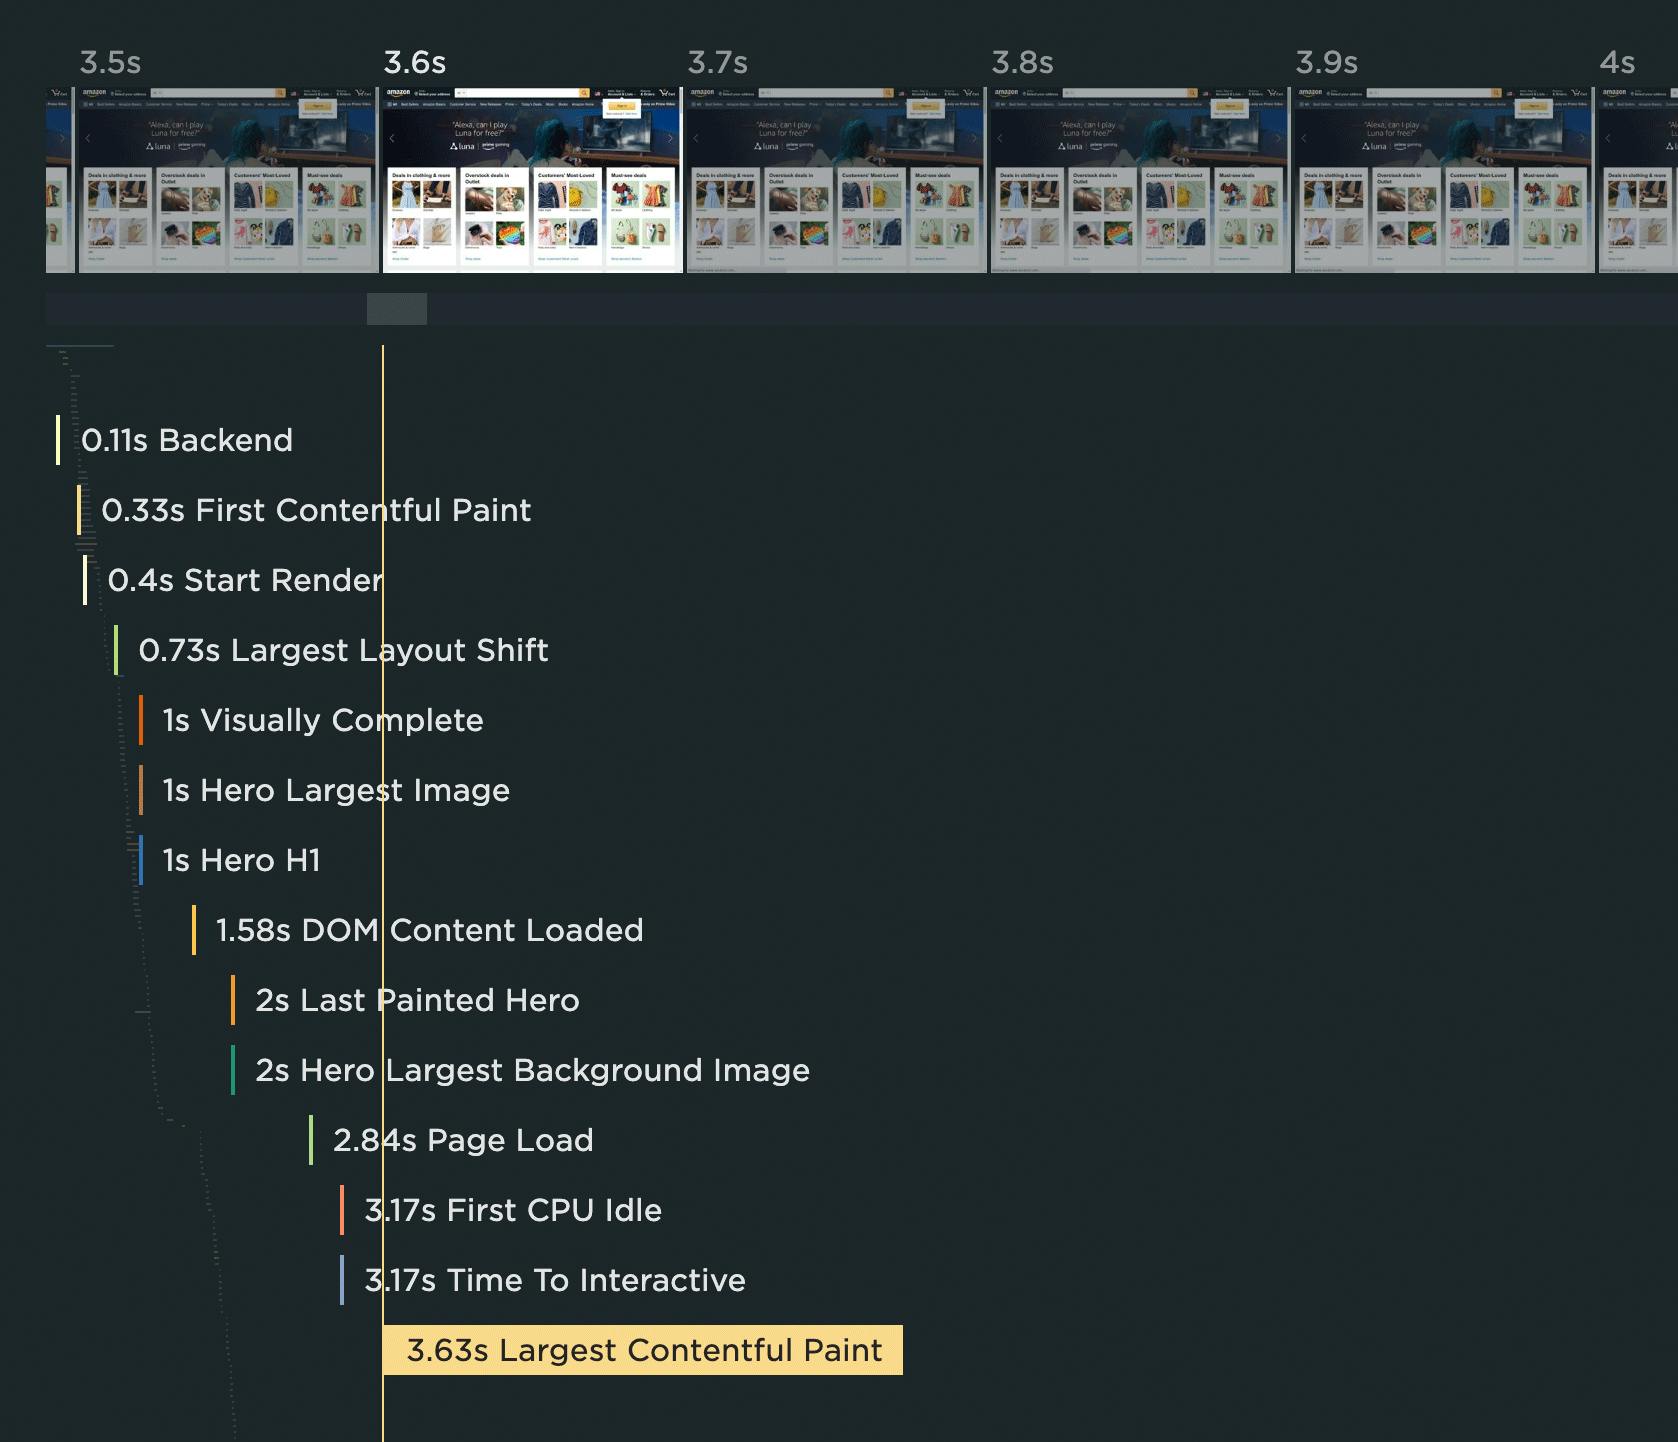
The high-level waterfall chart for this page shows that the LCP event fires after many other key metrics, including Start Render:
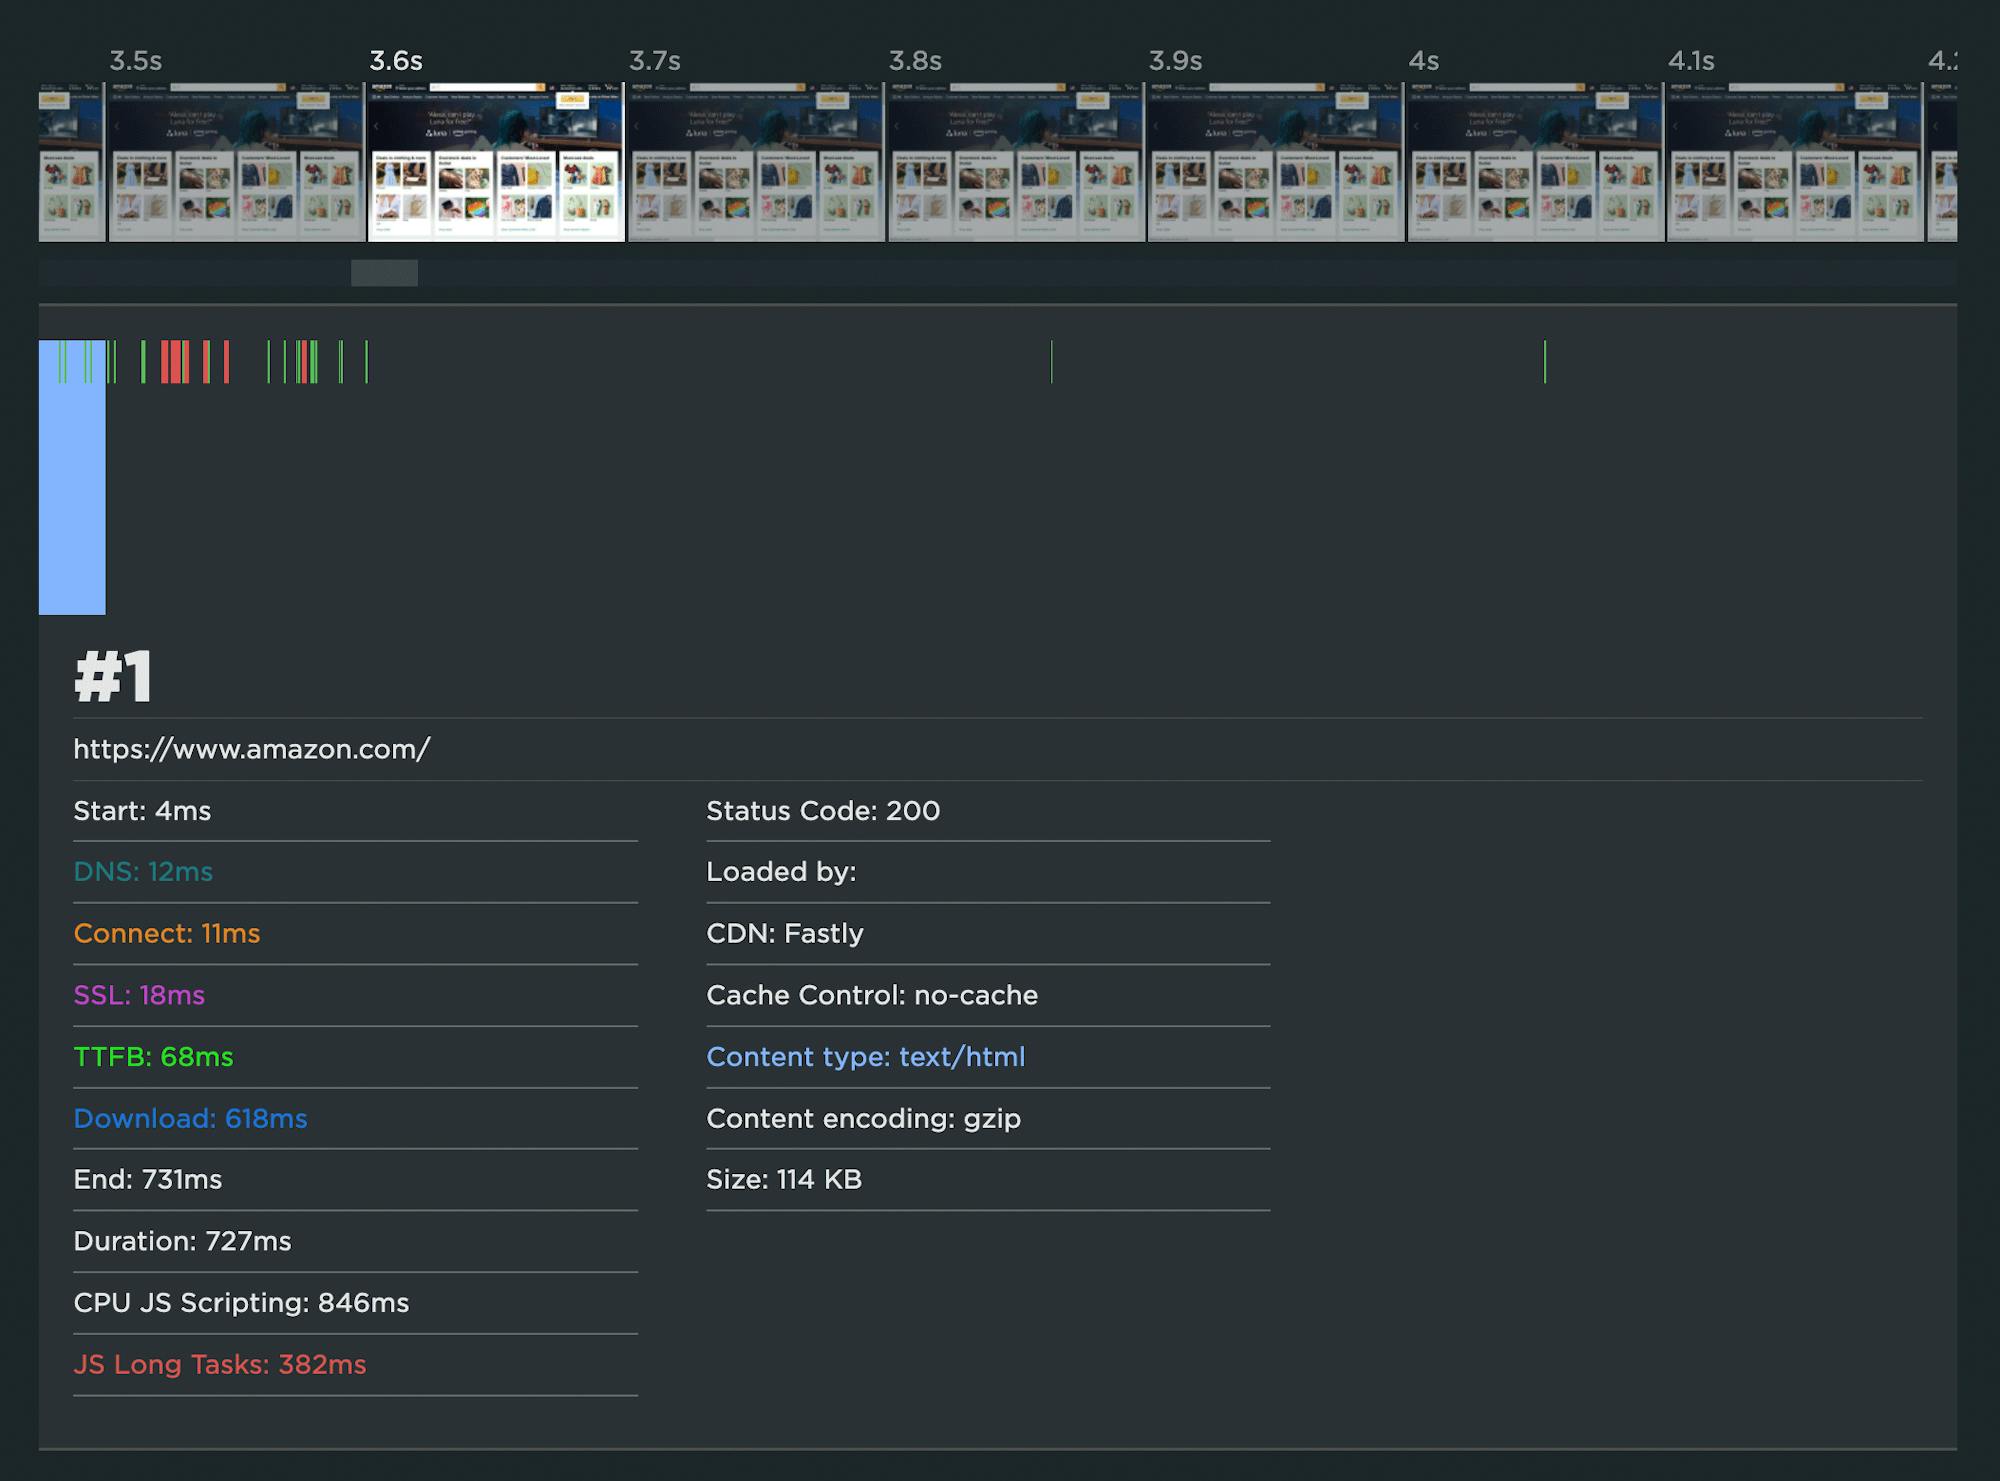
Expanding the waterfall chart reveals a few things:
1. The HTML document has a Long Tasks time of 382 milliseconds. If you look closely below, you can see that it doesn't fully parse until 3.6 seconds. The red bars indicate all the Long Tasks for this resource.
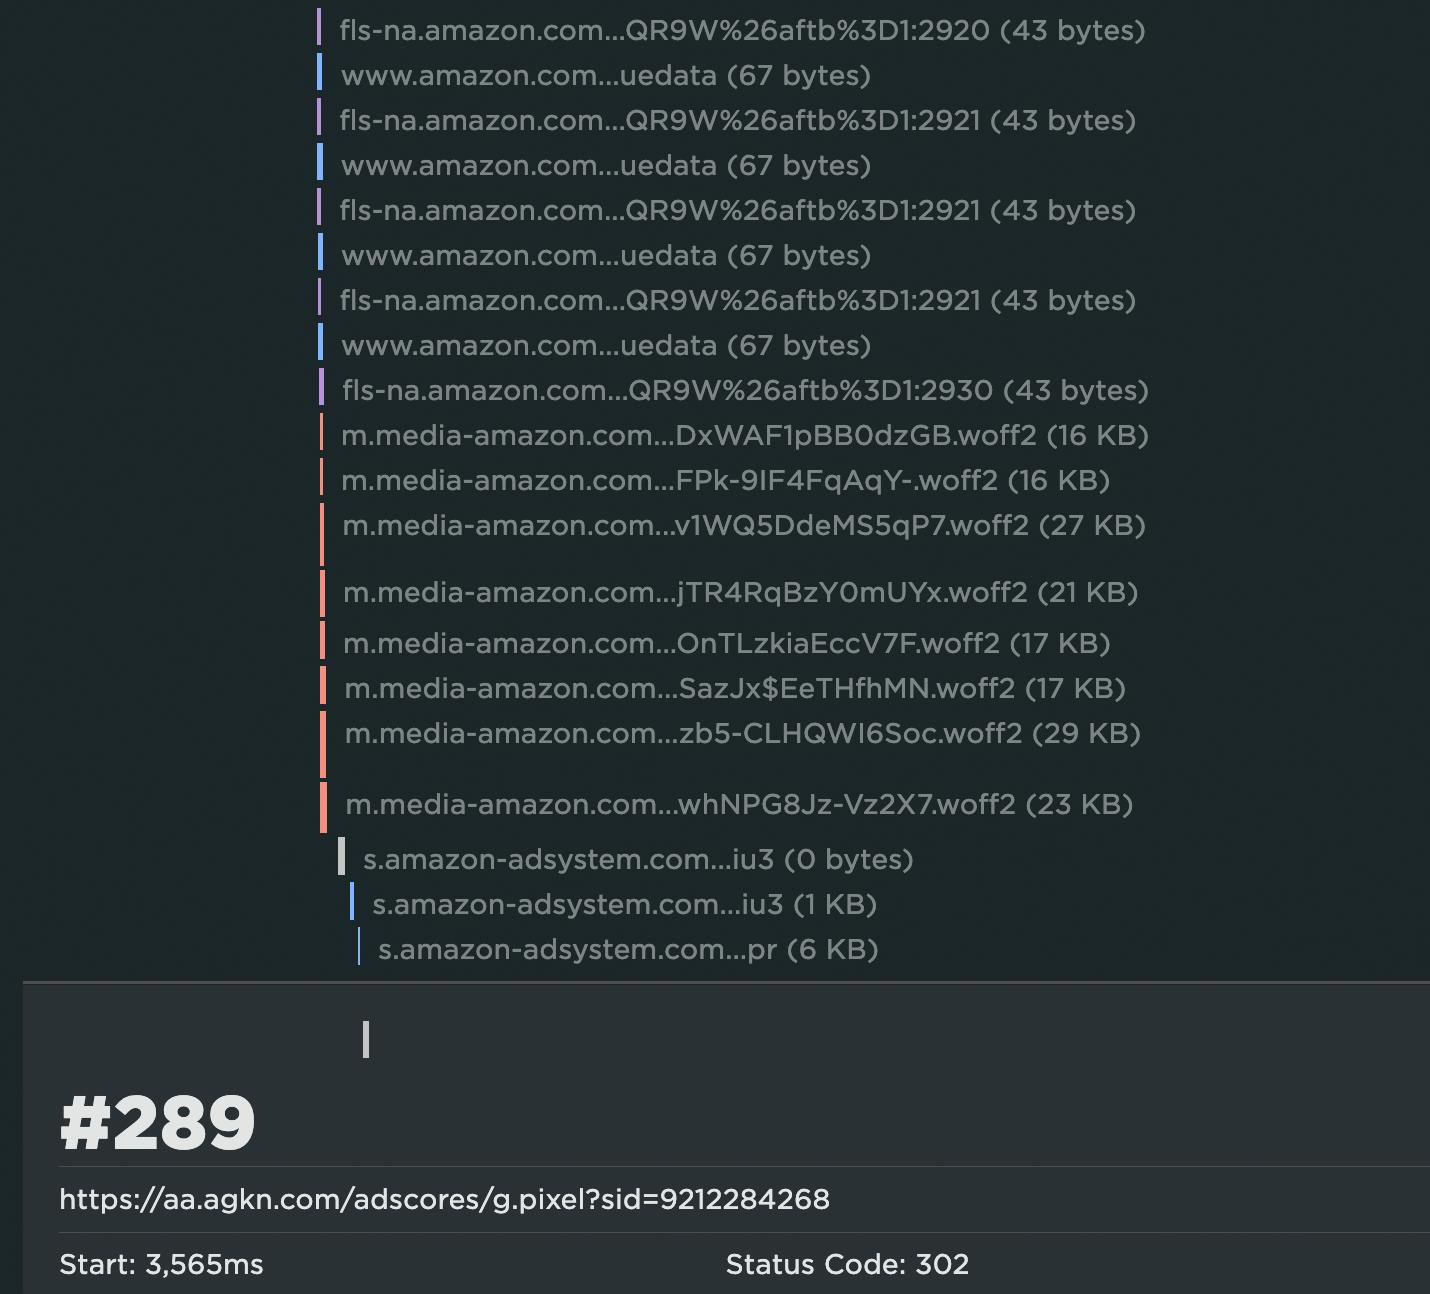
2. There are 289 resources that are rendered before the LCP event, the bulk of which are images.
3. Some or all of these images have been served in JavaScript bundles that take an excessive amount of time to execute. The green and red bars in the waterfall show when the browser is working to execute the JS, and the red bars indicate Long Tasks. You can see below how much JS execution takes place before LCP:
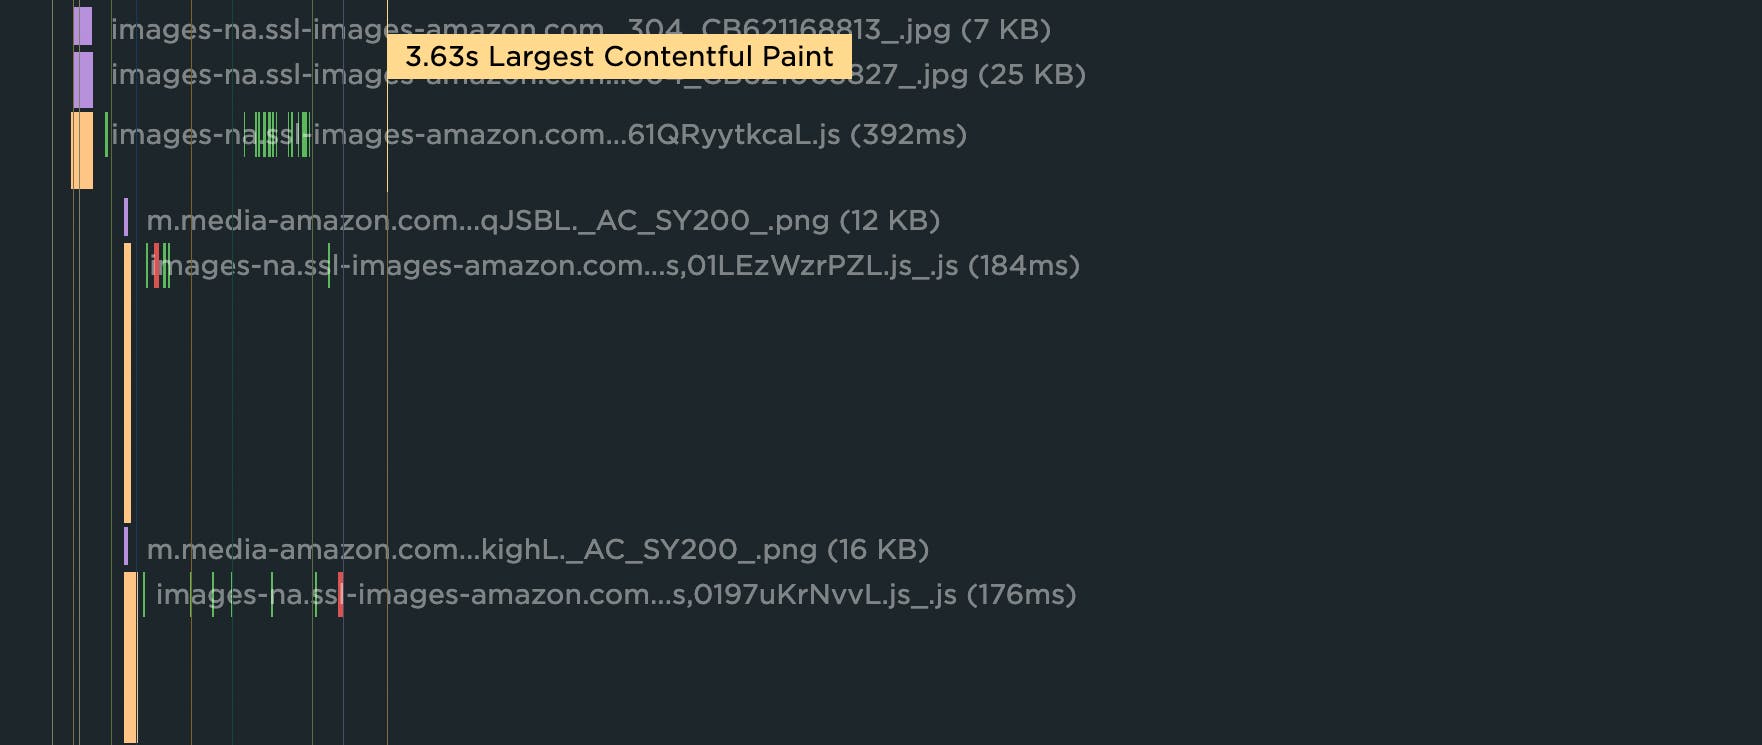
4. Many of the images in those JS bundles are outside the viewport. This means they could have been deferred/lazy-loaded.
How to improve Largest Contentful Paint
These practices will help fix the most common issues with LCP times:
- Request key hero image early, ideally by taking advantage of preloading
- Use srcset and efficient modern image formats
- Use compression
- Lazy-load offscreen images
- Set height and width dimensions for images
- Use CSS aspect-ratio or aspect-ratio boxes
- Avoid images that cause network congestion with critical CSS and JS
- Eliminate/reduce render-blocking resources
More: Optimize Largest Contentful Paint
Web Vitals badges on performance recommendations
In SpeedCurve, all the performance optimization recommendations you see on your Vitals and Improve dashboards – as well as in your synthetic test details – are badged so you can see which Web Vital they affect.
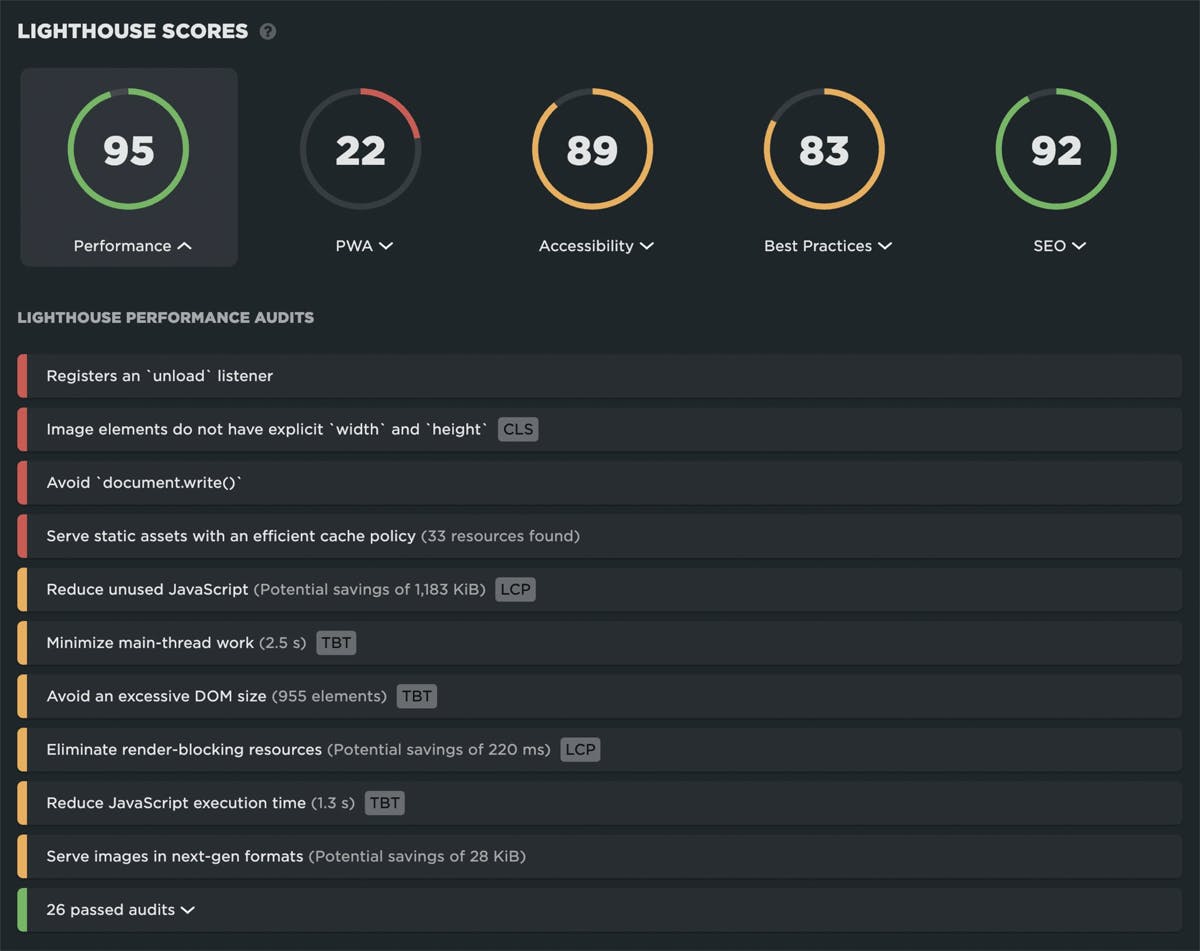
When you fix those issues, you should see improvements in your Vitals and Lighthouse scores.

Read Next

Everything you need to know about Core Web Vitals – from SEO and business impact to how to monitor and fix issues with each Vital.
Learn what INP is, how to identify and debug slow interactions... and most important, how to make them faster!
