SpeedCurve is now part of the Embrace family! There are no changes to how you use our products. Our founder Mark shares what this means...
Business Success
Core Web Vitals
- Getting Started With CWV
- Largest Contentful Paint (LCP)
- Interaction to Next Paint (INP)
- Cumulative Layout Shift (CLS)
Optimization Techniques
- Web Performance Budgets
- Diagnose Time to First Byte
- Optimizing Images
- Optimizing JavaScript
- Third-Party Web Performance
- Critical CSS for Faster Rendering
- Optimizing Single Page Apps
- Caching for Faster Load Times
Metrics & Charts
Web Performance for Retailers
Making customers happy is the not-so-secret secret to retail success. Delivering a fast, consistent online experience has been proven to measurably increase every metric retailers care about – from conversions and revenue to retention and brand perception.

Image: Freepik
Keep reading to learn more about:
- How page speed affects your business
- Benchmarking your site speed against your competitors
- What's slowing down your pages – from images and third parties to stylesheets and custom fonts – and what you can do about it
Does page speed affect your business?
Page speed has a measurable impact on the bottom line for most – if not all – online retailers. Even small improvements can significantly increase metrics like conversion rate.
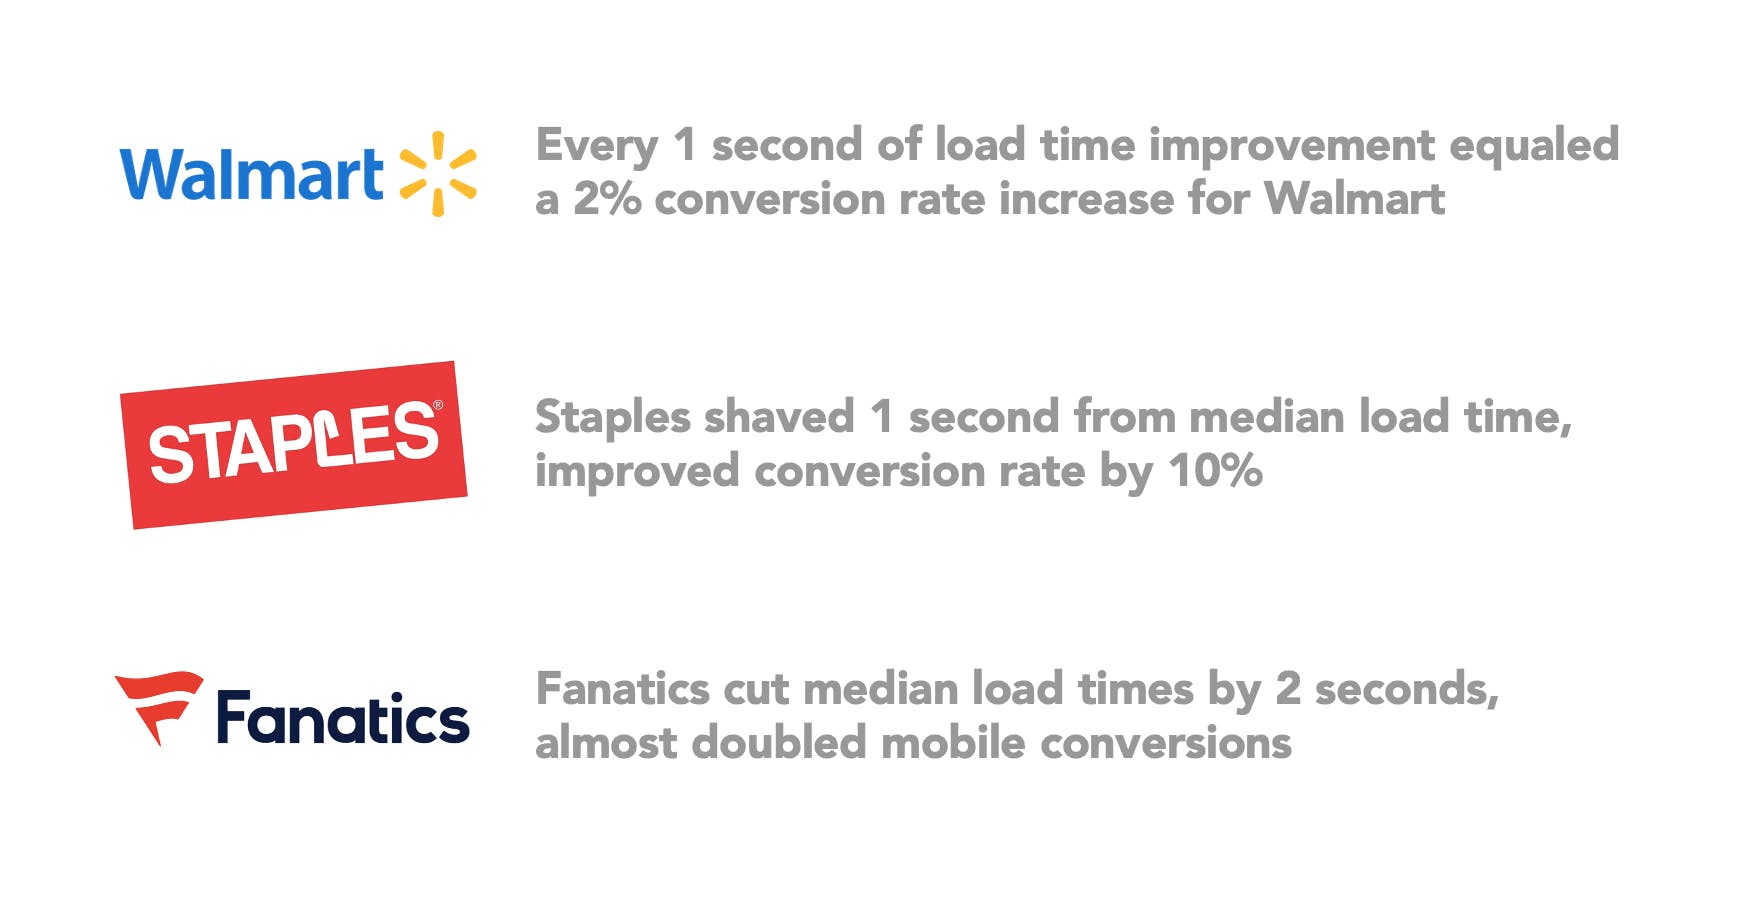
You can find more great web performance case studies on WPO Stats.
But what about your site? To understand the impact of page speed improvements on your own website, you need to look at your own real user monitoring (RUM) data.
Correlation charts are a great way to communicate about performance to everyone in your business. These visualizations – which you can create using RUM, let even the most non-technical stakeholder easily see the correlation between performance and user engagement and business metrics, such as bounce rate and conversion rate.
Correlation charts give you a histogram view of all your user traffic, broken out into cohorts based on performance metrics such as Start Render, Largest Contentful Paint, and Interaction to Next Paint. The chart includes an overlay that shows you a user engagement metric or business metric – such the bounce rate or conversion rate – that correlates to each of these cohorts. This lets you see at a glance the relationship between performance, user engagement, and your business.
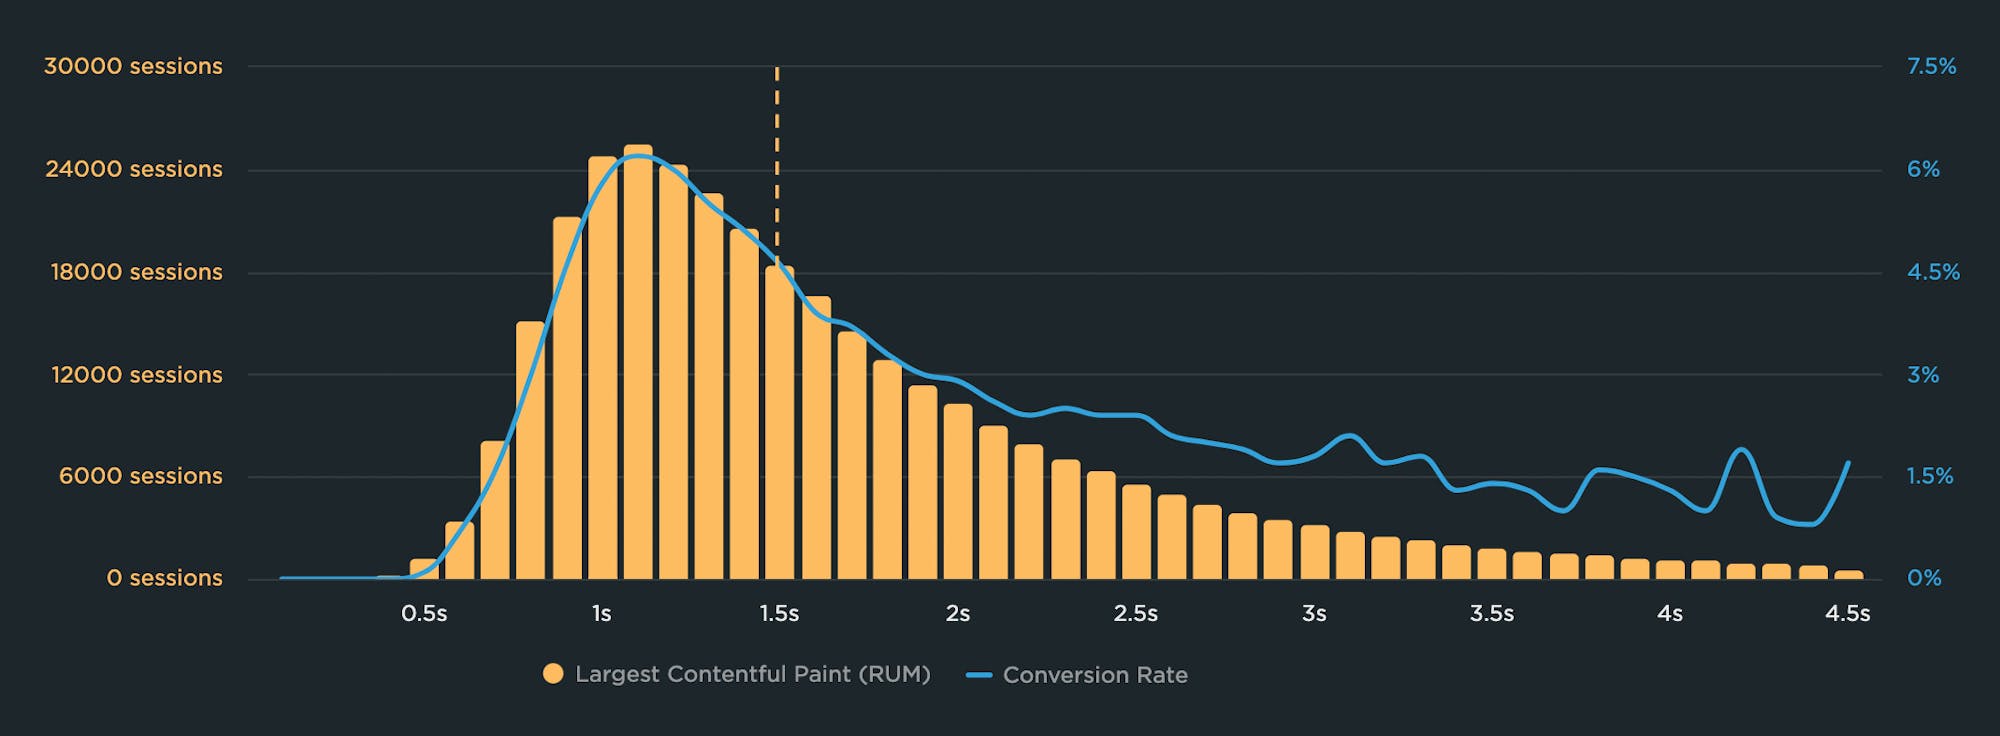
In this correlation chart, you can see that conversion rate peaks at just over 6% for sessions with Largest Contentful Paint (LCP) times of 1.1 second. As LCP gets slower, conversion rate declines quickly and dips below 3% at the 2-second mark.
The takeaway here is that improving LCP time for more of this site's visitors could lead to a higher number of conversions overall, and more revenue.
How does your site stack up against your competitors?
With synthetic performance monitoring, like SpeedCurve Synthetic, you can run page speed tests on any other website in the same way that you can your own website. That means you get all that same, rich, awesome data, screenshots, and filmstrips that you can compare.
Your competitive benchmarking dashboard also lets you drill down and focus in on things like page construction. That page that's rendering twice as fast as yours... what are they doing differently? Have they got more JavaScript? Less? Are you making 400 requests and they're only making 80? This is the place to find that out.
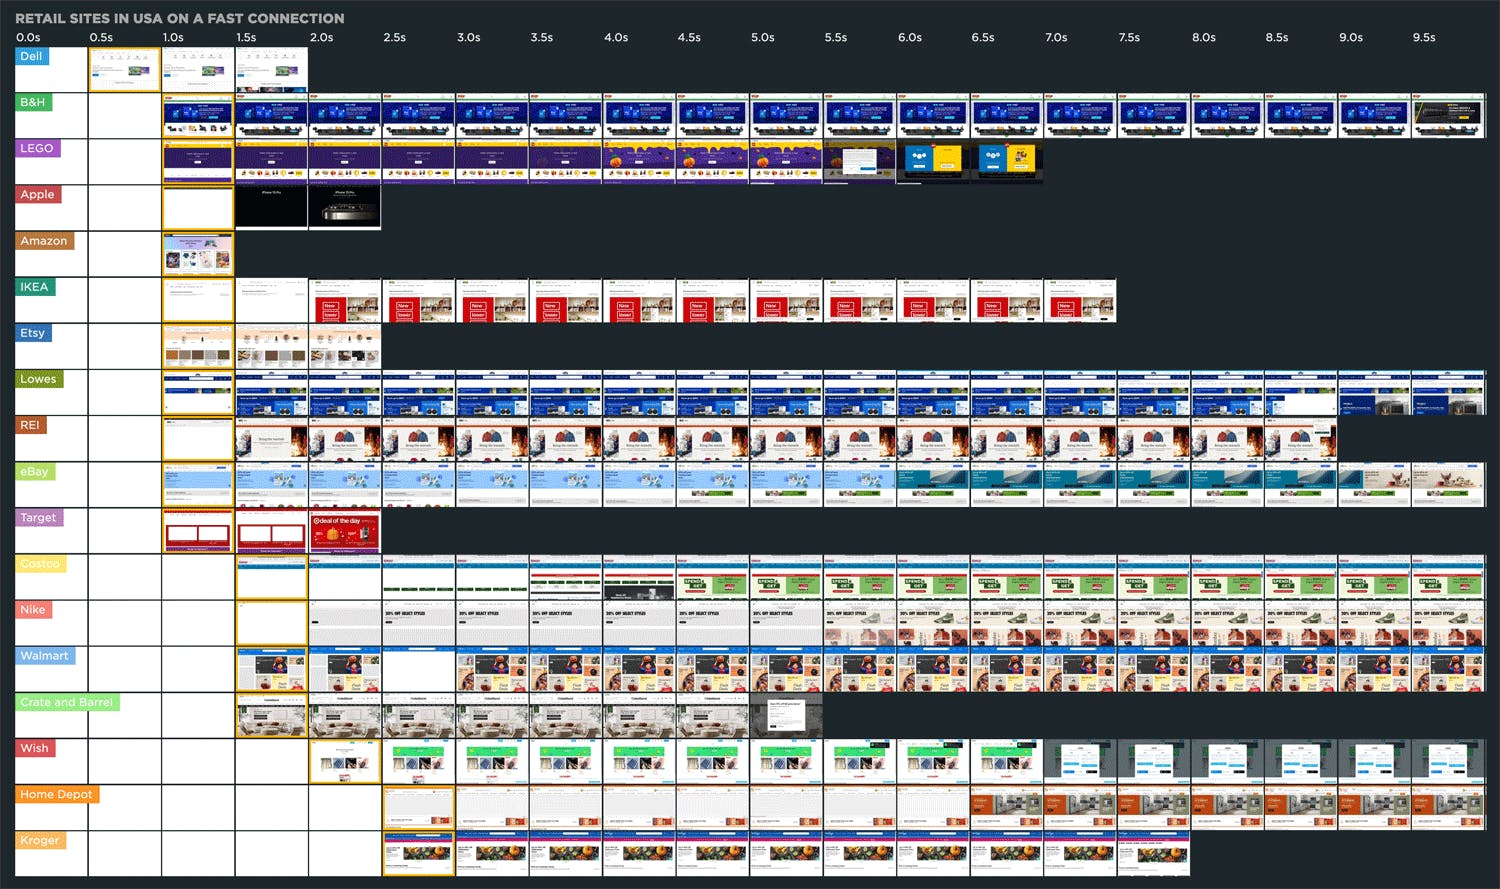
Page Speed Benchmarks is a public-facing dashboard that shows you a current performance snapshot of leading retailers in the US, EU, UK, and Japan.
Getting started with performance optimization
Delivering a great, fast online experience starts with asking two questions:
- What is making my pages seem slower for my users?
- What can I do about it?
The good news is that most of the issues that are making pages slow for your shoppers are right on your pages, which means you have control over them. Here's an overview of the most common performance issues on retail sites, and how you can track them down and fix them.
What's slowing down your pages?
The vast majority of performance issues are caused by four things:
- Third parties, such as trackers and analytics
- Stylesheets
- Custom fonts
- Page size, particularly image size
Third parties
A typical retail web page these days can contain upwards of 75 third-party scripts, such as trackers and analytics beacons.
Third parties add tons of value by increasing conversions (via targeting beacons) and helping you understand your users in unprecedented ways (via analytics tags), so they’re not going away any time soon. But they can significantly affect how – or even if! – your page renders.
What you can do: Monitor the performance of your third parties
Start by taking a proactive approach to understanding any potential performance damage your third parties can cause.
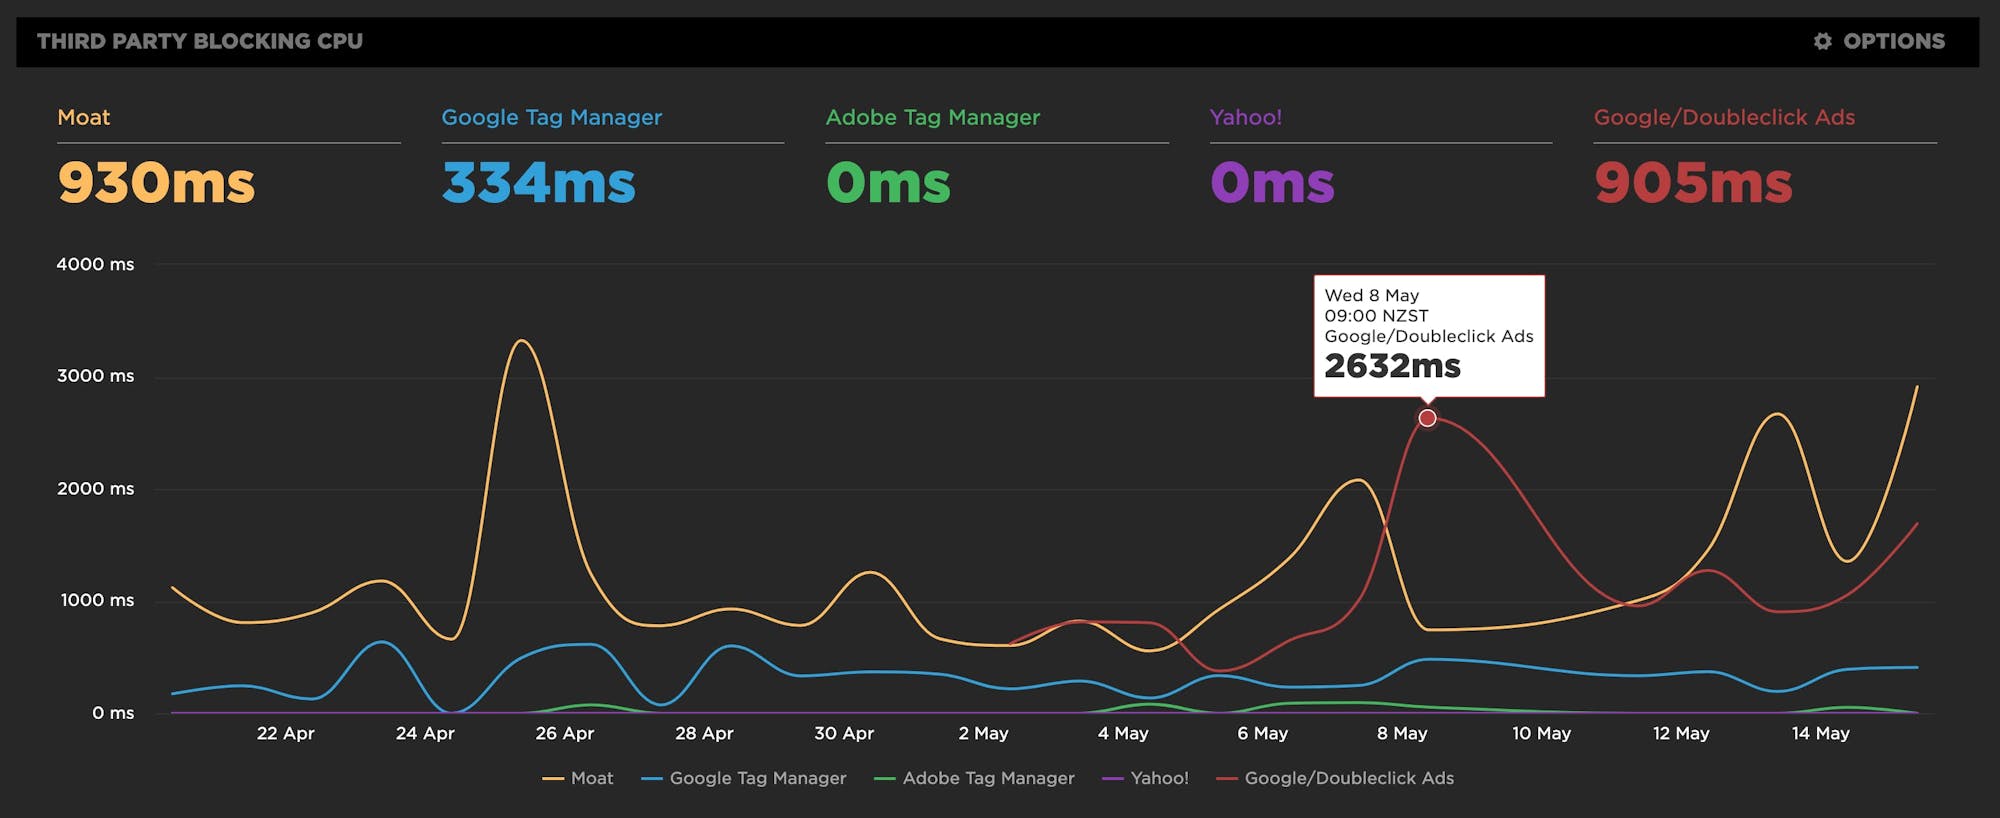
You can't fix what you don't measure. That's why we created a dedicated third-party dashboard in SpeedCurve, so you can see at a glance how your third parties are performing, track individual scripts, and set performance budgets for them.
After you've gained some visibility into the performance of your third-party scripts, you can use your historical data to set SLAs with your vendors.
Case study: Marks & Spencer revolutionized performance by focusing on third party content
Images and page size
While page size doesn’t always correlate to a slower user experience, it often can. Huge unoptimized images are a frequent culprit.
In addition to optimizing your images (to ensure you're not delivering 1MB resources to your users!), you should also make sure that your most important images – such as your main product image – renders as early as possible.
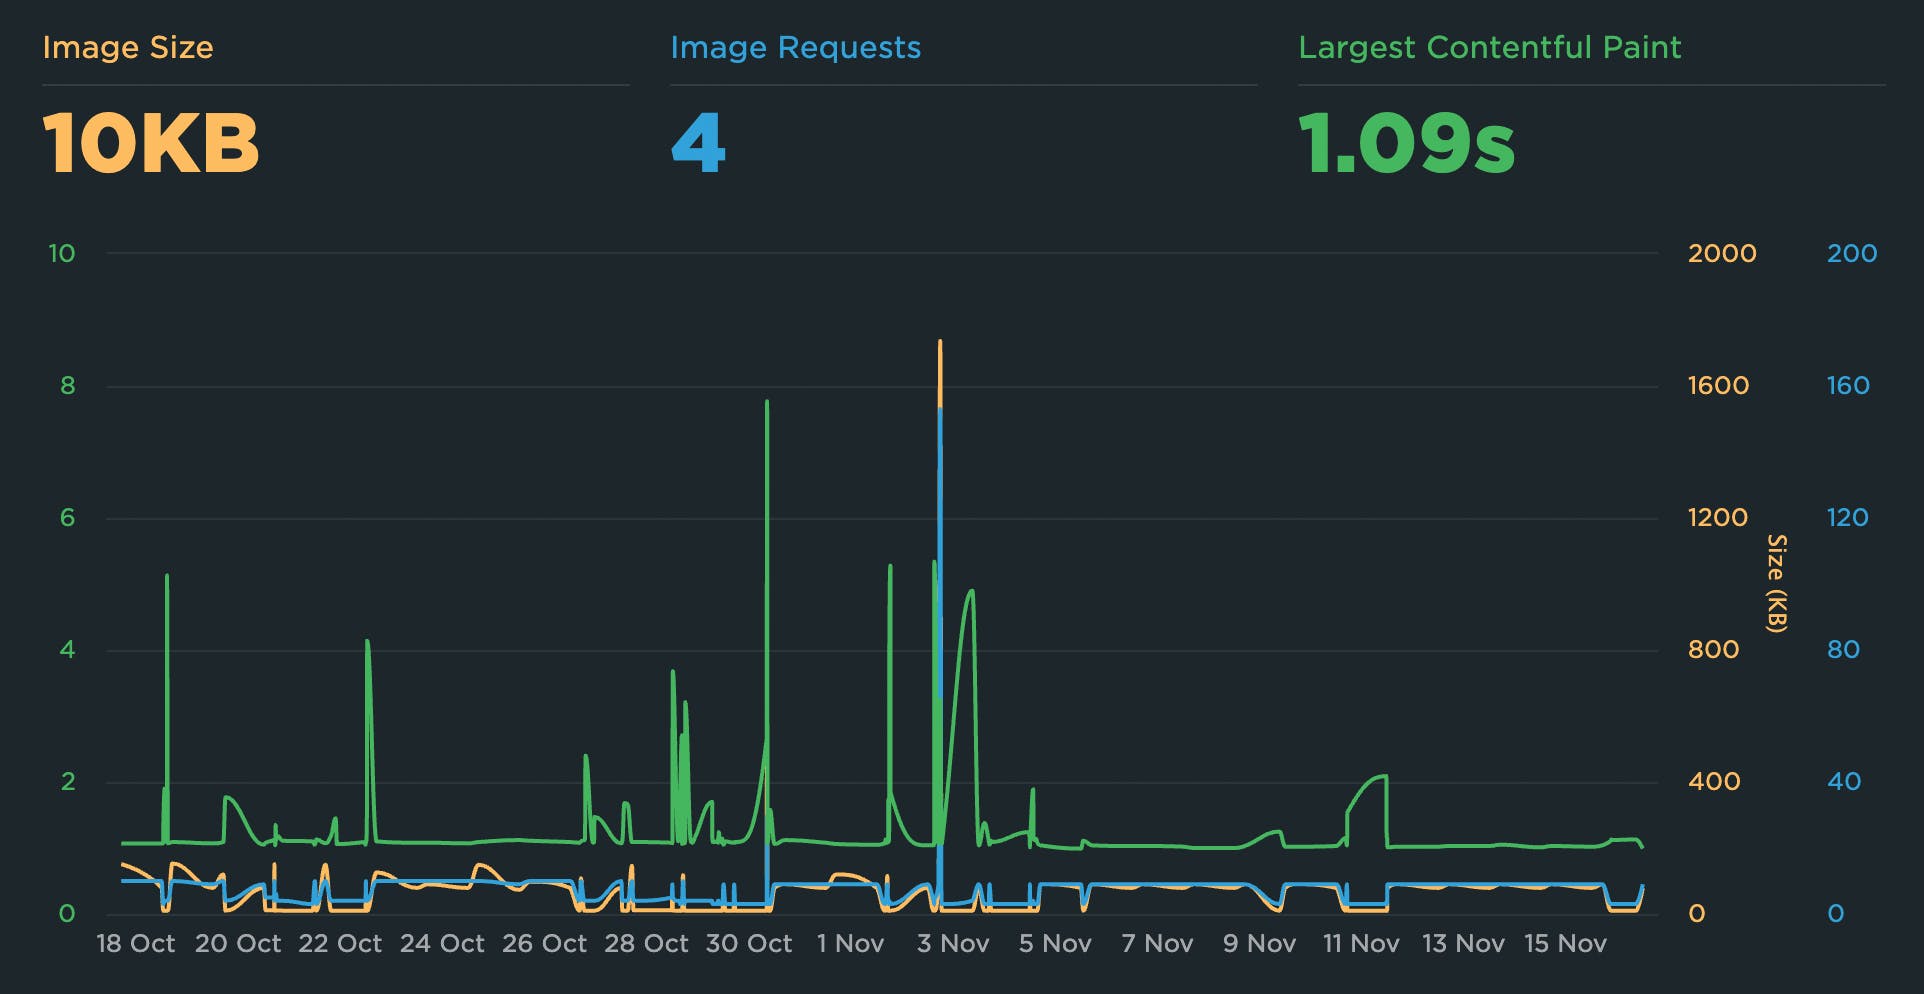
What you can do: Create performance budgets for your image-related metrics
Performance budgets and alerts are a great way to fight regression. A performance budget starts with your team (everybody: marketing, designers and developers) agreeing on the principles around the user experience and how fast your website should feel. First, you need to identify which metrics to track, then set your threshold based on past performance.
For images, here are some metrics to consider:
- Largest Contentful Paint – This is the size of the largest visual element – either an image or video – in the viewport. LCP is one of Google's Core Web Vitals, which is a set of metrics that are part of Google's search ranking algorithm, so it's a good idea to track it.
- Image size – Total size of all images on a page. This is a good way to see at a glance if a large unoptimized image has been added to a page.
- Image requests – Total number of images on a page.
Case study: How Zillow became bigger, faster, and more engaging while on a budget
Stylesheets
Stylesheets are an incredible boon for modern webpages. They solve a myriad of design problems, from browser compatibility to design maintenance and updating. Without stylesheets, we wouldn’t have great things like responsive design.
However, poorly executed stylesheets can create a host of performance problems. These range from CSS that takes too long to download and parse, to improperly placed stylesheets that blocks the rest of the page from rendering.
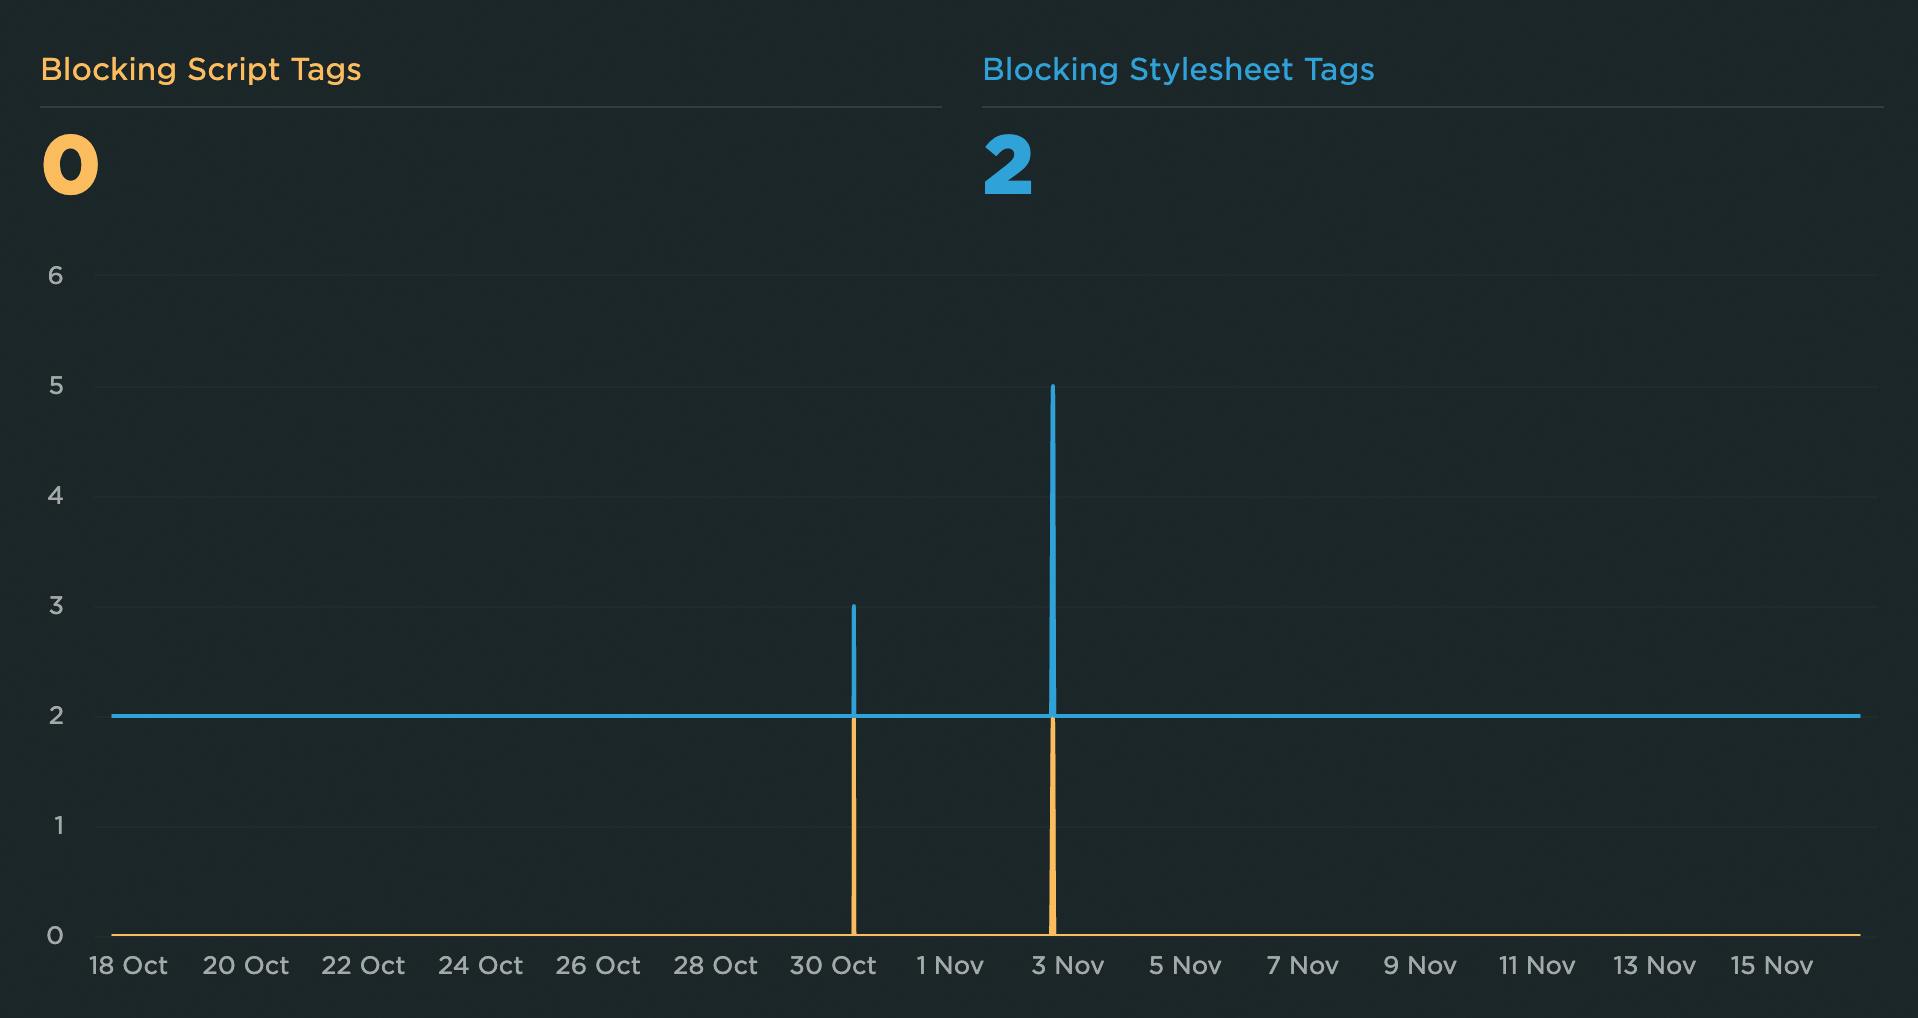
What you can do: Know which of your stylesheets can block your pages from rendering
Again, you can't fix what you don't measure. Your synthetic monitoring tool can tell you:
- How many stylesheets are in my pages, and how many of those are blocking the page from rendering?
- Has that number gone up or down?
- How big are the CSS requests?
- How are stylesheets performing for each of my third parties?
Custom fonts
Custom fonts allow designers unprecedented control over the typefaces used in their designs. This desire for control accounts for the surge in popularity of custom fonts. But this popularity comes with a performance price tag.
Some fonts require huge amounts of CSS code, while others have heavy JavaScript or are hosted externally – all of which can dramatically slow down page rendering.
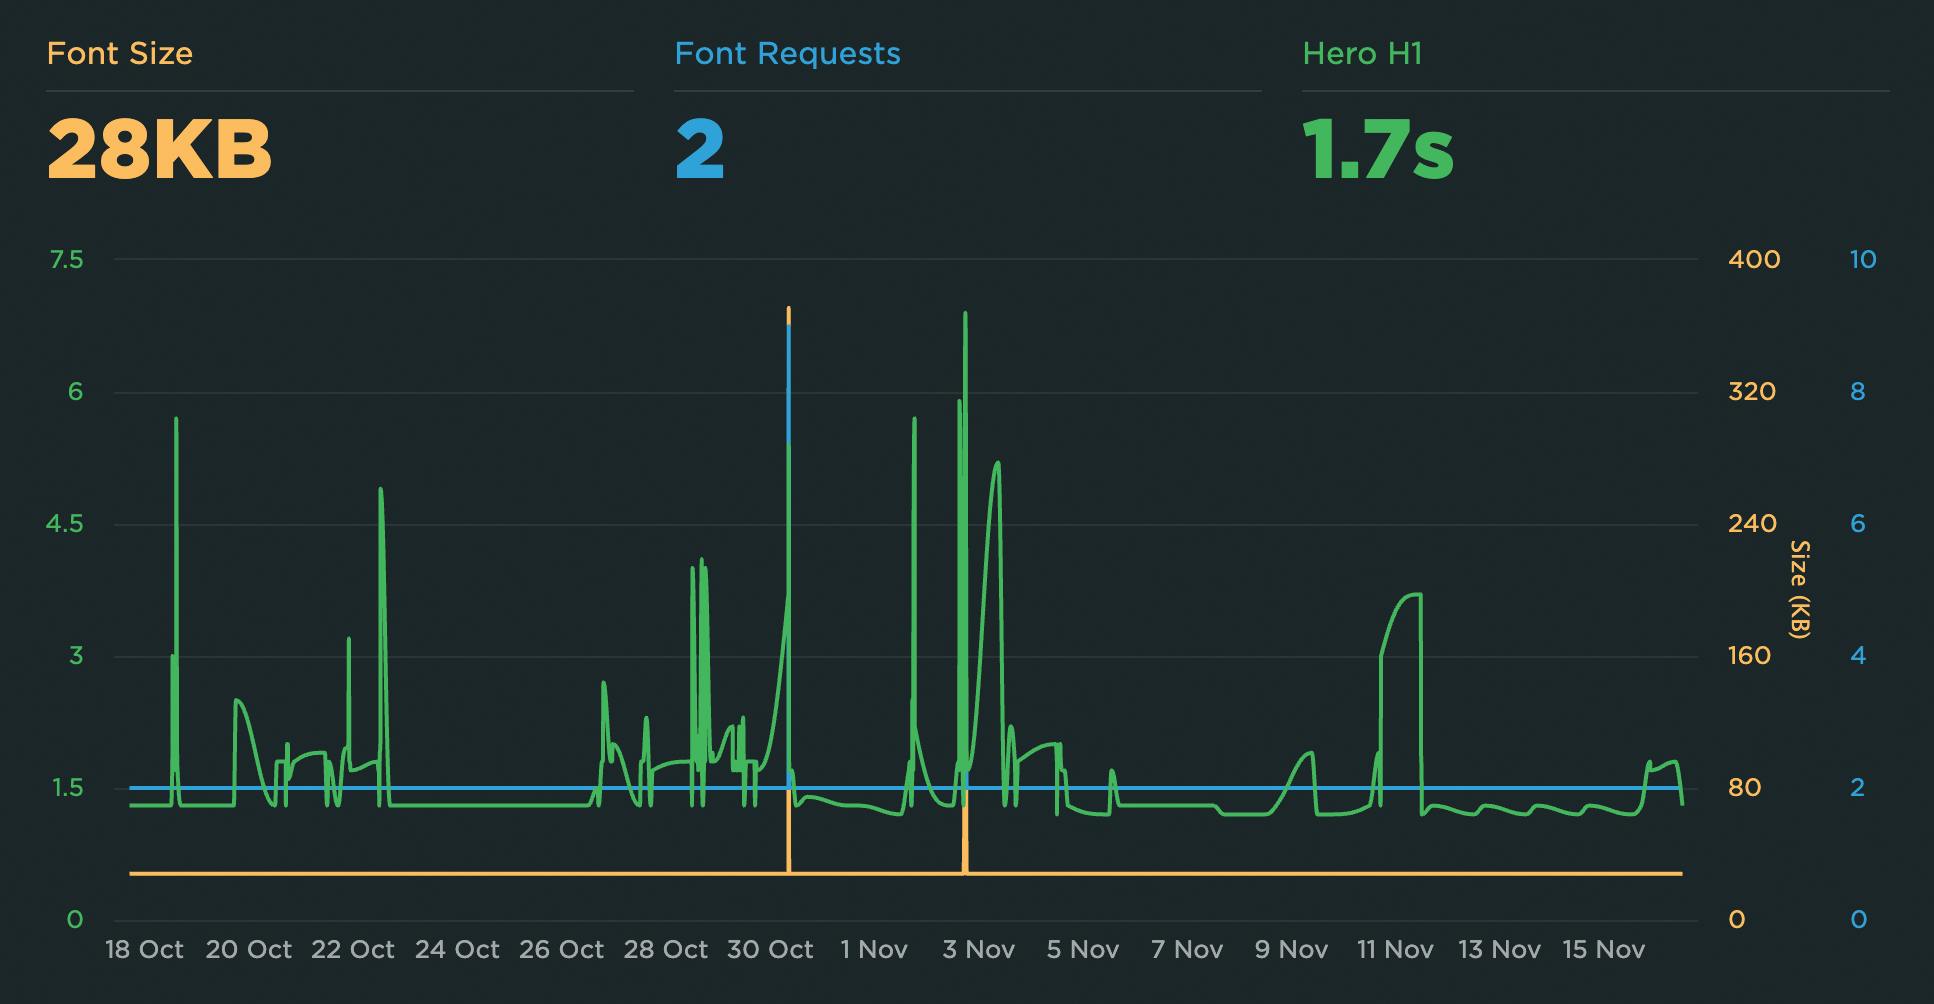
What you can do: Track the size and rendering speed of your fonts
In addition to tracking font size and number of requests, you can also use SpeedCurve to measure when your first H1 element finishes rendering. (In SpeedCurve, we call this metric Hero H1. It's one of a set of three Hero Rendering Times we capture.) If your site uses custom fonts, it's quite likely that those fonts will be applied to H1 copy, which makes this metric an effective way to measure how quickly your custom fonts are rendering.
As with all the other metrics we track for you, you can create performance budgets for any of your font-related metrics and get alerts when they exceed their threshold.
Case study: NerdWallet used the H1 Render metric to help improve font loading by up to 30%
Start monitoring
Delivering fast, joyous experiences to online shoppers has never been as important as it is now. If you're already a SpeedCurve user, you can take advantage of the many ways to make your site feel faster for your users. If you're not already a SpeedCurve user, sign up for your free trial so you can explore these features and get to know your site better – the way your users see it.

Read Next

If you don't consider time a crucial usability factor, you're missing a fundamental aspect of the user experience.

Web performance and SEO are always evolving. That means you need to stay up to date on which metrics to track and how those metrics are faring on your own pages.
