Downtime vs slowtime: Which costs you more?

Comparing site outages to page slowdowns is like comparing a tire blowout to a slow leak. One is big and dramatic. The other is quiet and insidious. Either way, you end up stranded on the side of the road.
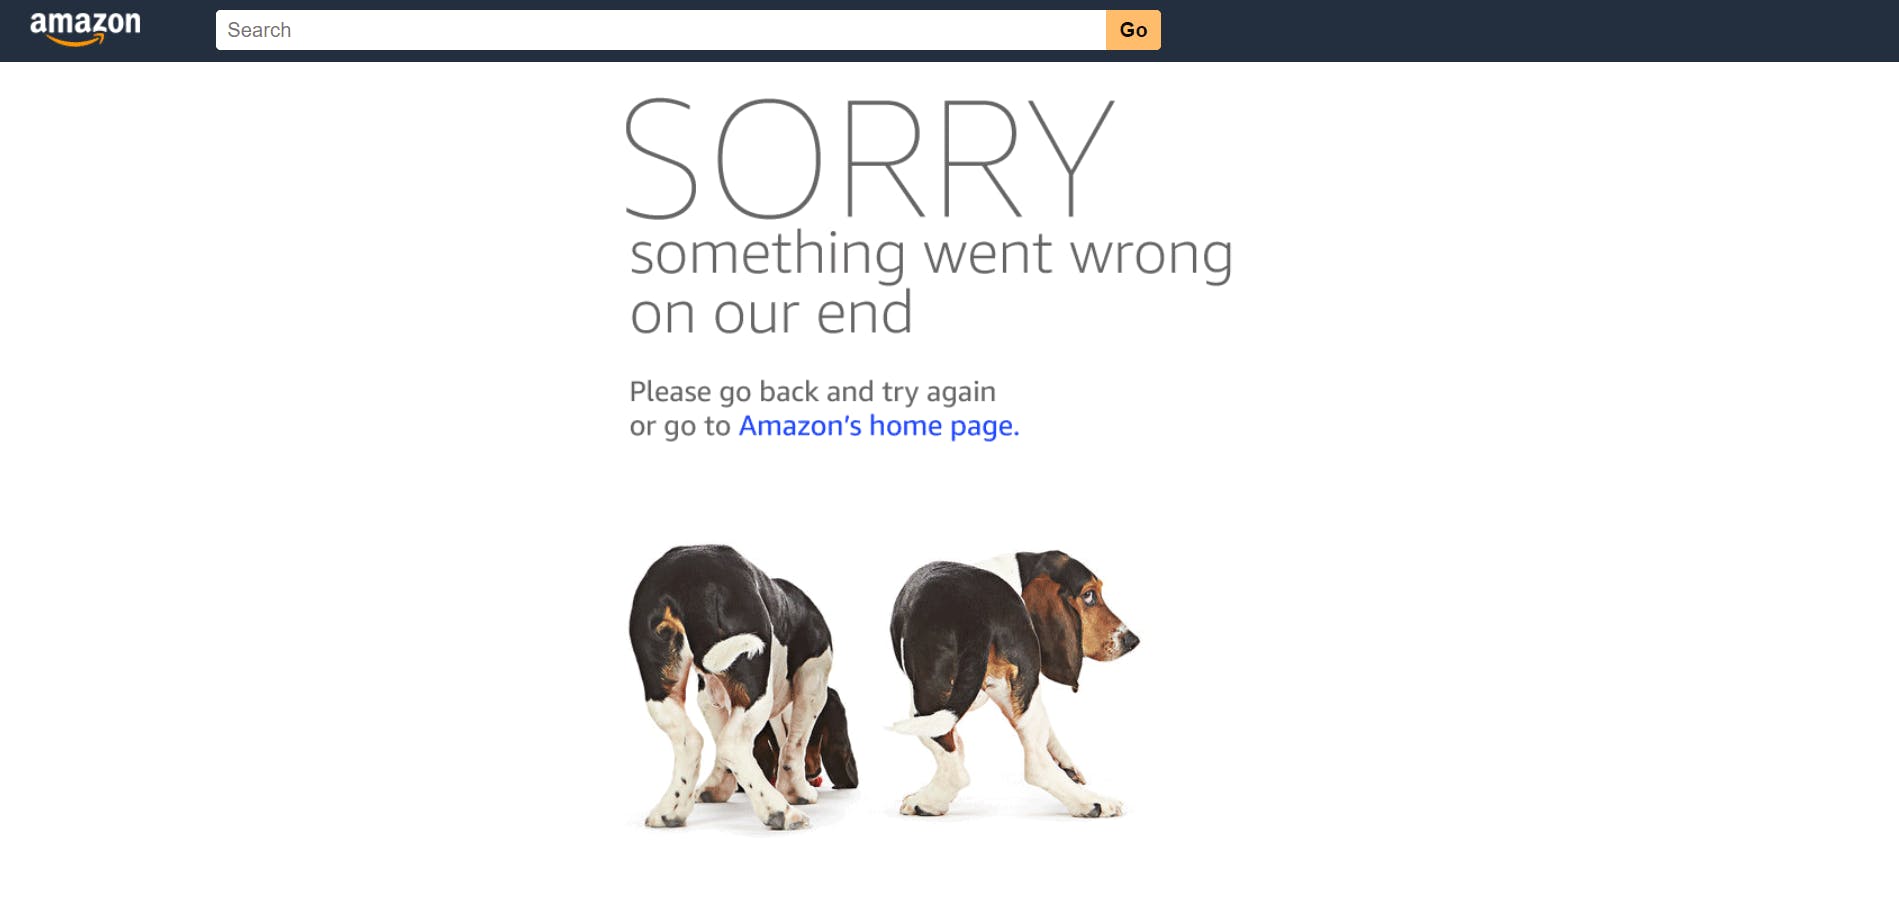
Downtime is horrifying for any company that uses the web as a vital part of its business (which is to say, most companies). Some of you may remember the Amazon outage of 2013, when the retail behemoth went down for 40 minutes. The incident made headlines, largely because those 40 minutes were estimated to have cost the company $5 million in lost sales.
Downtime makes headlines:
- 2015 – 12-hour Apple outage cost the company $25 million
- 2016 – 5-hour outage caused an estimated loss of $150 million for Delta Airlines
- 2019 – 14-hour outage cost Facebook an estimated $90 million
It's easy to see why these stories capture our attention. These are big numbers! No company wants to think about losing millions in revenue due to an outage.
Page slowdowns can cause as much damage as downtime
While Amazon and other big players take pains to avoid outages, these companies also go to great effort to manage the day-to-day performance – in terms of page speed and user experience – of their sites. That’s because these companies know that page slowdowns can cause at least as much damage as downtime.
There are three metrics that are hit hard by slow page load times:
- Abandonment rate
- Revenue
- Brand health
Let’s take a deeper dive into the data behind each of these metrics.
Visitors may be more likely to permanently abandon slow sites than unavailable sites
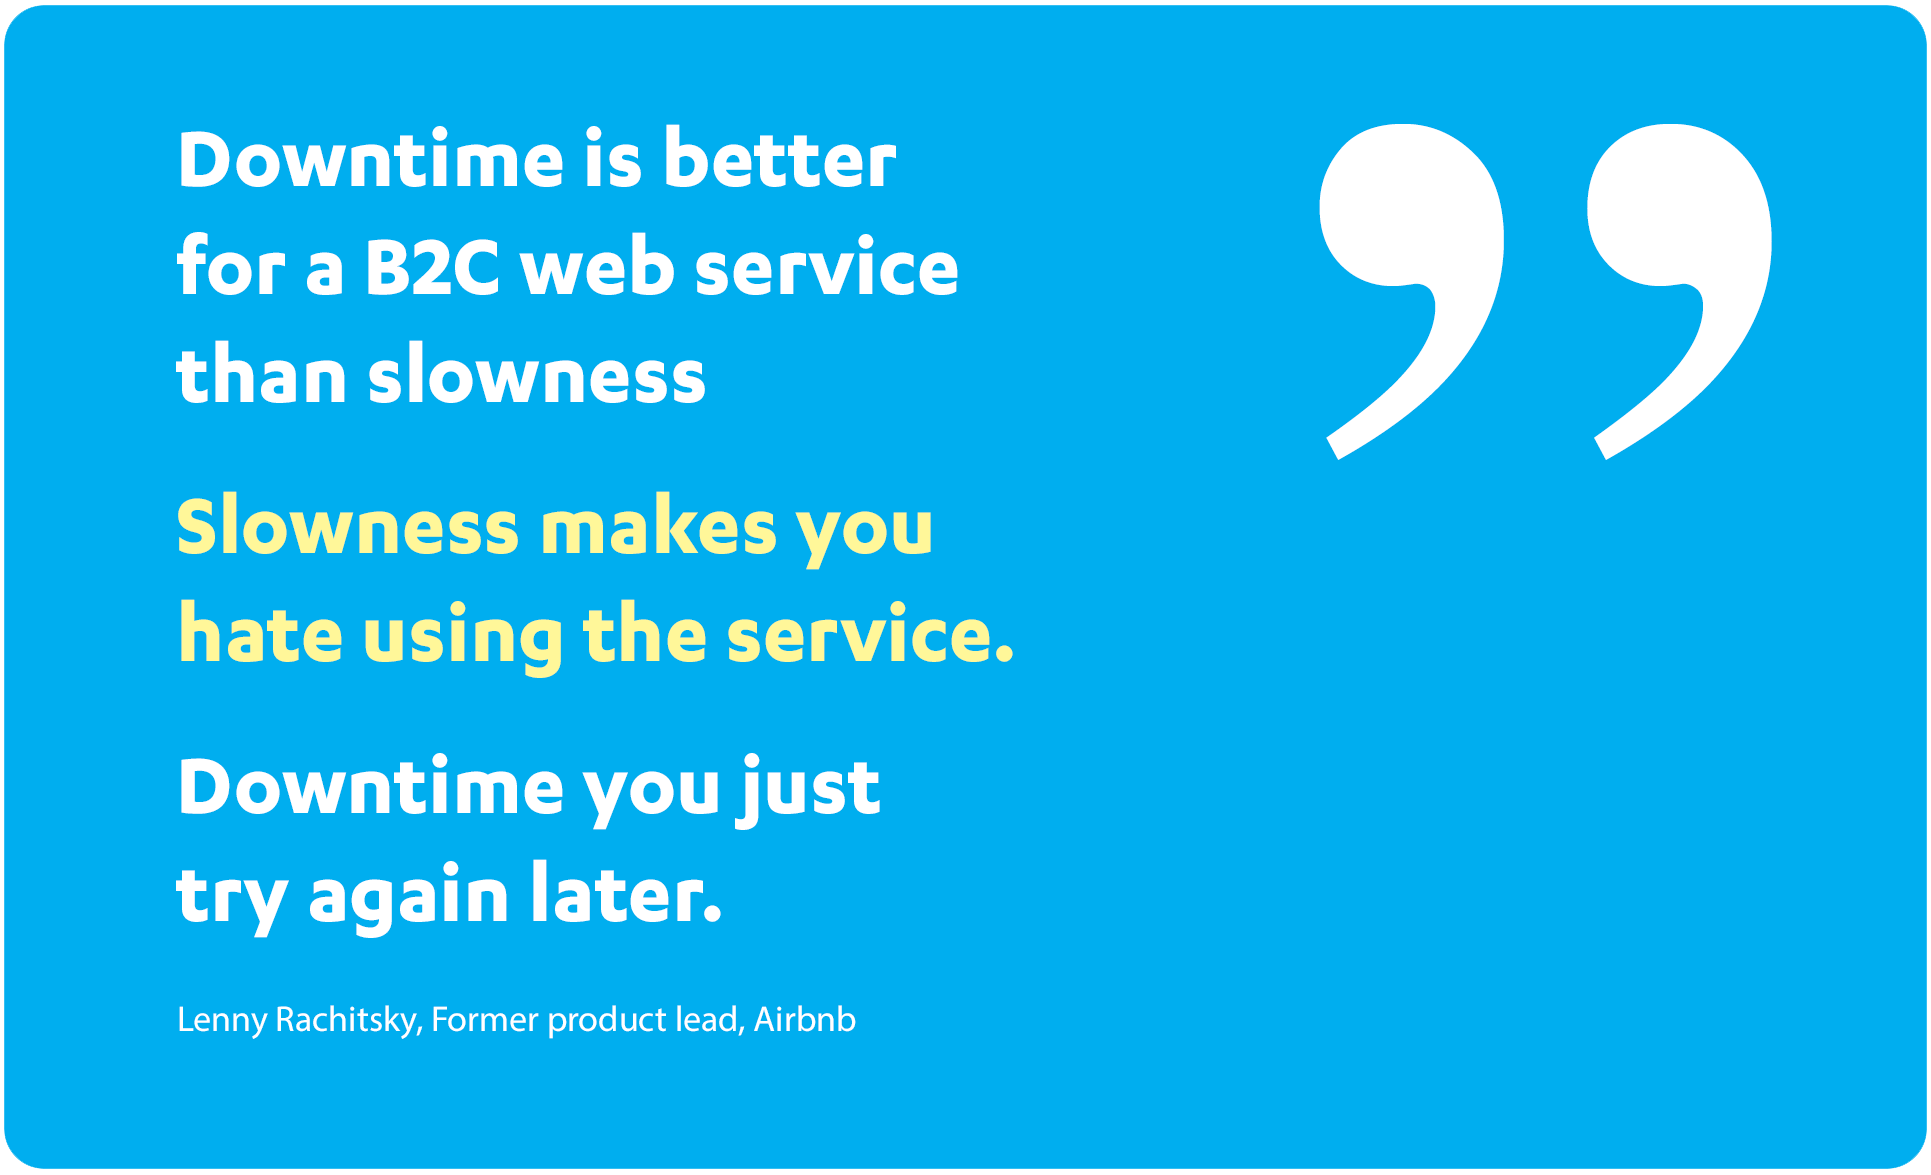
If a website is temporarily down, there’s a reasonable chance you’ll try again later – assuming that you’re reasonably motivated to track down whatever it was you were interested in finding on that site.
But if a website or app is consistently laggy (read: many popular media sites), eventually, you just sort of drift away.
Anecdotally, this makes sense – and there’s research to back it up.
 In one of the only studies (if not the only study) of the impact of outages versus slowdowns on abandonment rates, Akamai found that sites that went down experienced, on average, a permanent abandonment rate of 9 percent. Sites that suffered from slow performance experienced a 28% abandonment rate.
This isn’t to say that site outages are nothing to be concerned about. A 9% permanent abandonment rate is extremely bad for your business. But a 28% abandonment rate is even worse.
Slow pages could have up to 2X more impact on revenue than downtime
This finding comes from a study that, to the best of my knowledge, is the only study that compares revenue losses due to downtime with losses due to page slowness.
TRAC Research surveyed 300 companies and found that the average revenue loss for an hour of downtime was $21,000. For the same set of companies, average revenue loss due to an hour of performance slowdown (which was defined as response times exceeding 4.4 seconds) was much less – just $4,100.
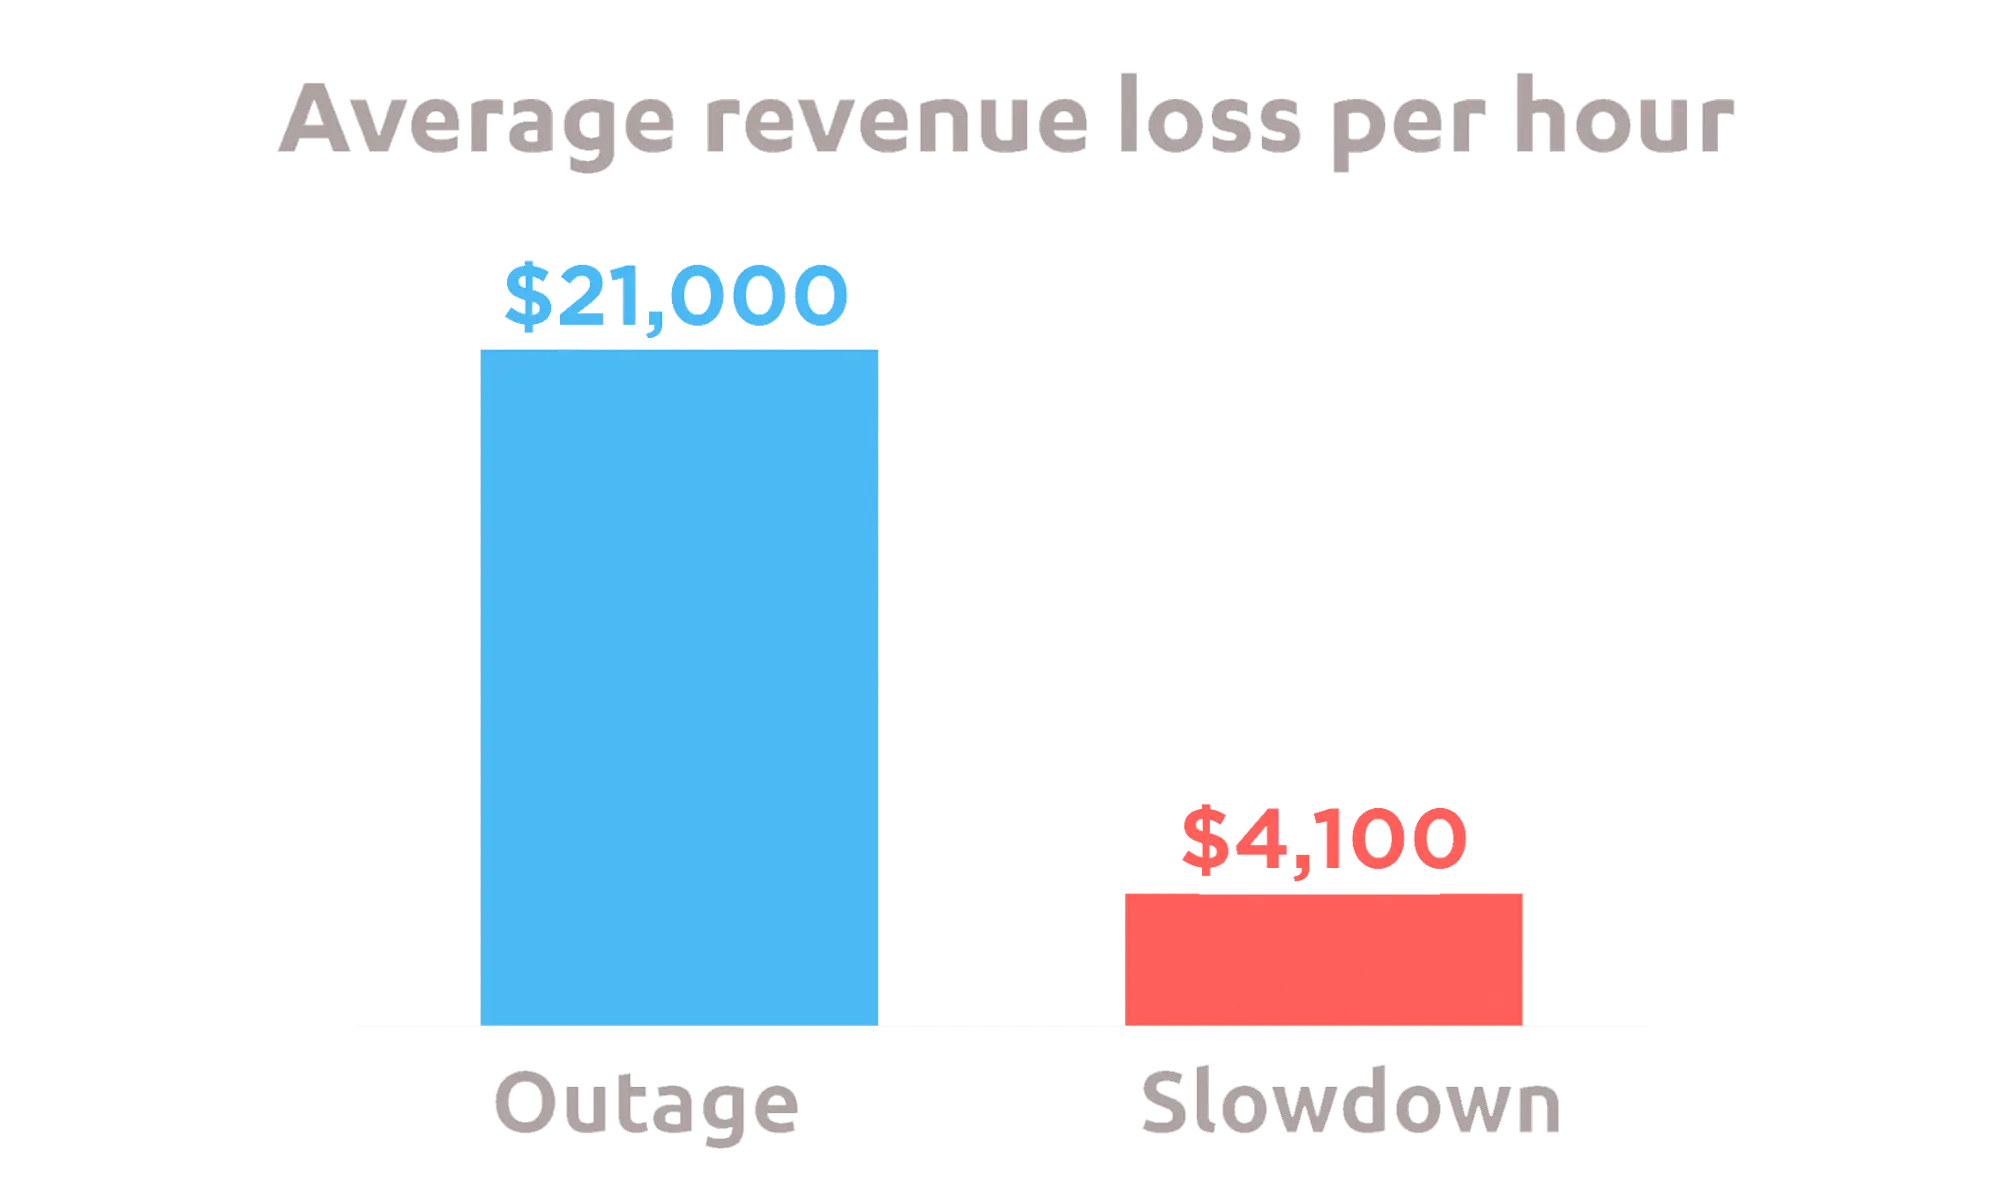 Looking at just these two sets of numbers, outages seem like a bigger source of concern. But wait.
According to the same survey, website slowdowns occurred 10X more frequently than outages. This changes the numbers considerably.
 In other words, according to this research, slow-loading pages could have twice the impact on revenue that site failures do.
Bear in mind, this is just one survey of 300 companies. The results cited here should definitely not be taken as a prediction of how your own site could fare. The most important takeaway from this study is that it forces us to ask ourselves:
- How do I calculate losses due to slowness on my site?
- How do these losses compare to downtime losses?
- Am I at risk of prioritizing one performance issue (downtime) over another equally critical issue (slowness)?
Slow sites may suffer more damage to brand health
Unless your site experiences frequent and noticeable outages, occasional failures won’t undermine your brand. (In fact, remember back when Twitter made outages cute with the fail whale?)
Most users accept sporadic downtime as part of the reality of using the web. They’re less forgiving, however, if your site is routinely slow.
First impressions matter – and they happen faster than you might think. According to one study, we form our opinion of a website within the first 50 milliseconds. And once we’ve formed that opinion, it colours how we feel about a site’s credibility and usability, ultimately affecting whether or not we choose to make a purchase on that site.
A few years ago, I directed a neuroscientific research project in which participants were asked to complete transactions on an e-commerce site using mobile devices. Some participants experienced normal speeds, while others experienced load times that were artificially throttled with a 500-millisecond network delay. Participants believed they were participating in a standard usability/brand perception study, so they had no idea that speed was a factor in the tests.
After each set of tests, the research team conducted exit interviews with the subjects. Our subjects were asked to give their general impressions of each site and company. The results were revealing.
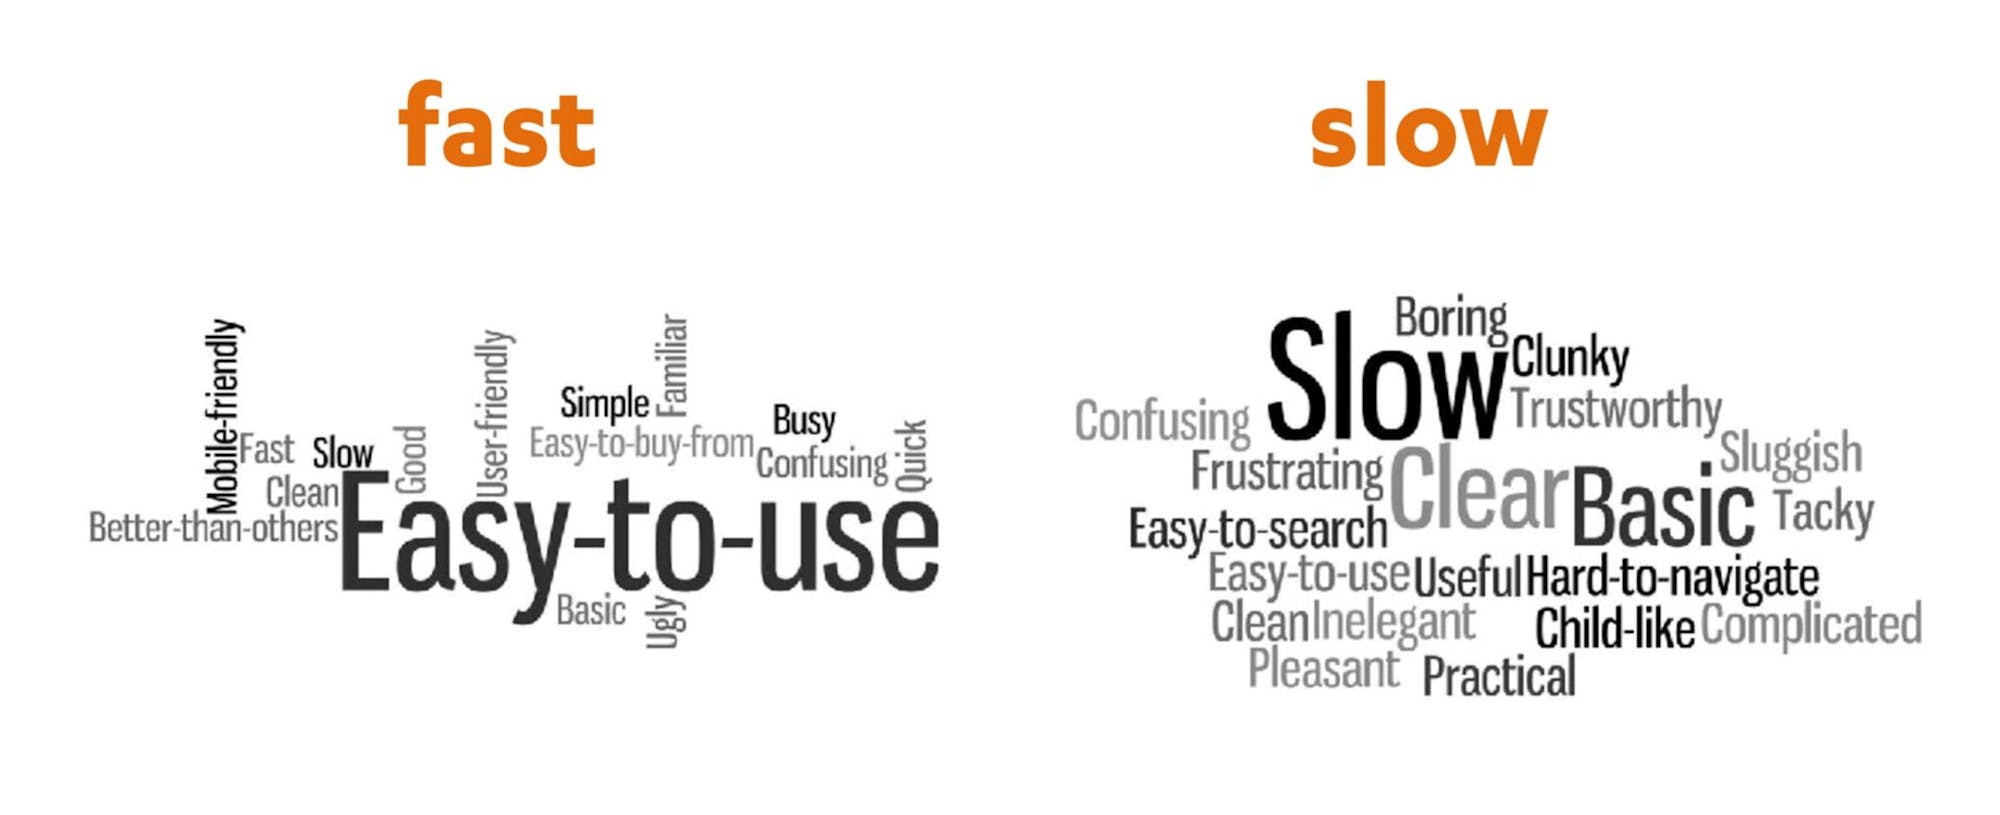
Some participants picked up on the slight deterioration in performance (calling the slower site “slow” and “sluggish”), but those who used the slower site also developed negative perceptions of areas unrelated to speed:
- Content (“boring”)
- Visual design (“tacky” and “confusing”)
- Ease of navigation (“frustrating” and “hard to navigate”)
In other words, the slower pages affected people’s perception of three important aspects of the site that are closely aligned with brand perception.
Calculating the cost of "slowtime"
Calculating downtime loss is pretty straightforward. If your site averages $100,000 per hour in revenue, and you suffer a three-hour outage, you can estimate that you lost $300,000.
Calculating losses due to slowdowns is not as straightforward, but you can still get an idea of what those losses might be.
1. Create a correlation chart for your site
Using your real user monitoring (RUM) data, create a correlation chart for your site. A correlation chart gives you a histogram view (represented in the yellow bars in the chart below) of all your user traffic, broken out into cohorts based on performance metrics (such as Start Render and Largest Contentful Paint).
The chart includes an overlay (represented in the blue line) that shows you a user engagement metric or business metric – such the bounce rate or conversion rate – that correlates to each of these cohorts. This lets you see at a glance the relationship between performance, user engagement, and your business.
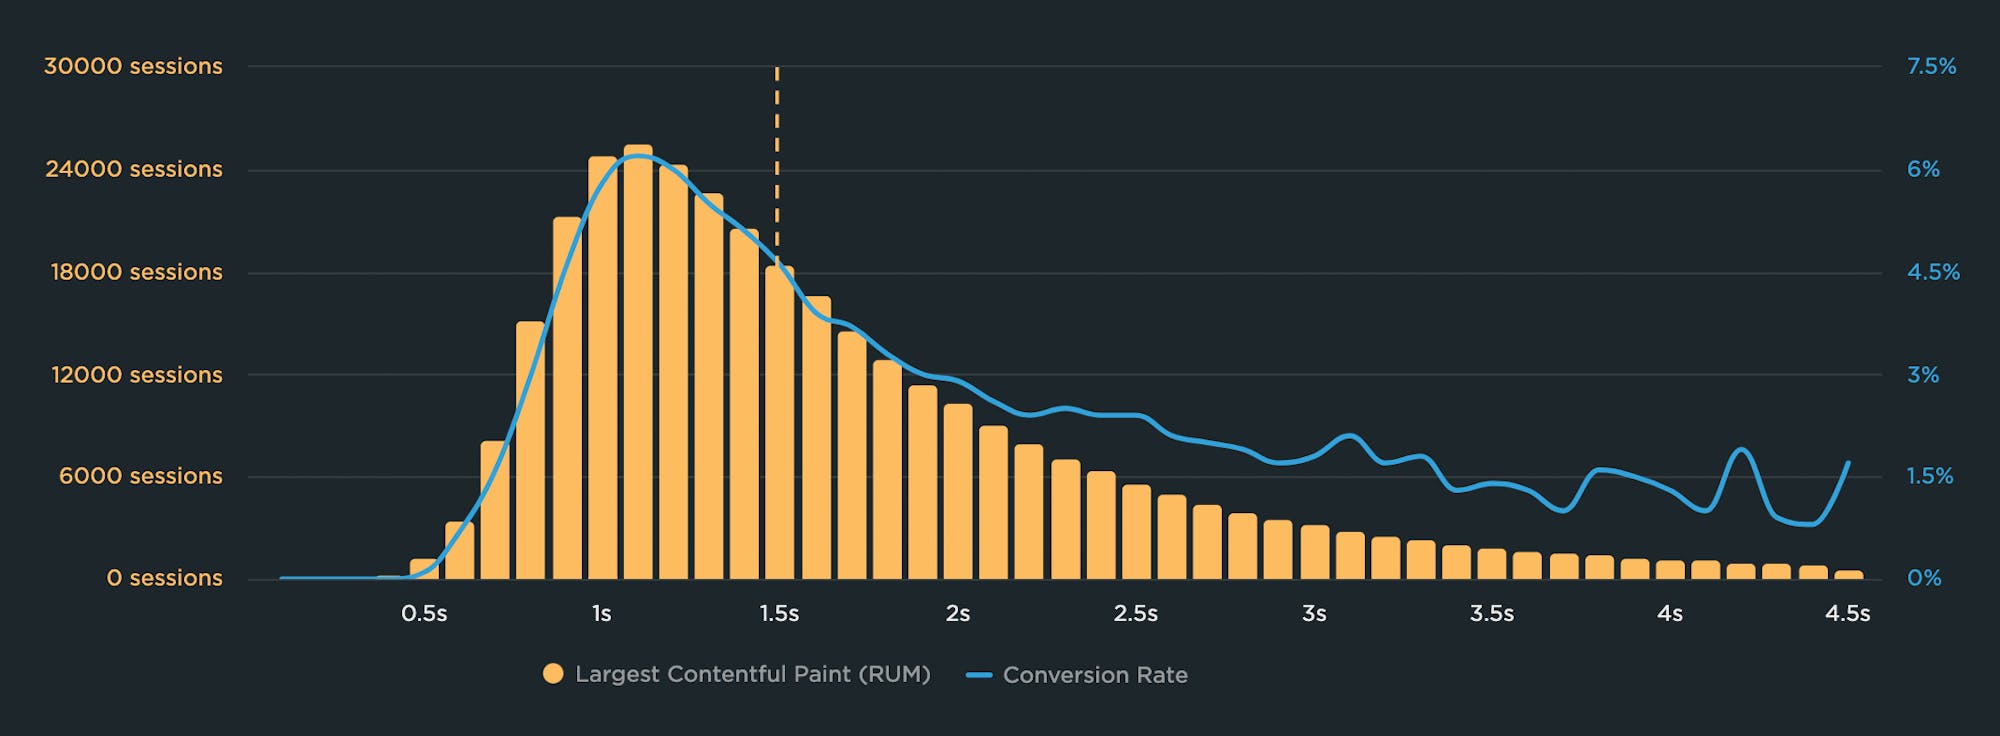
This correlation chart shows that the highest conversion rate – slightly more than 6% – correlates with a 1.1s LCP time. As the LCP time gets slower, conversion rate worsens.
2. Identify the performance plateau for your site
The performance plateau is the point at which changes to your website’s rendering metrics (such as Start Render and Largest Contentful Paint) cease to matter, because you’ve bottomed out in terms of business and user engagement metrics.
In other words, if your performance metrics are on the performance plateau, making them a couple of seconds faster probably won't help your business.
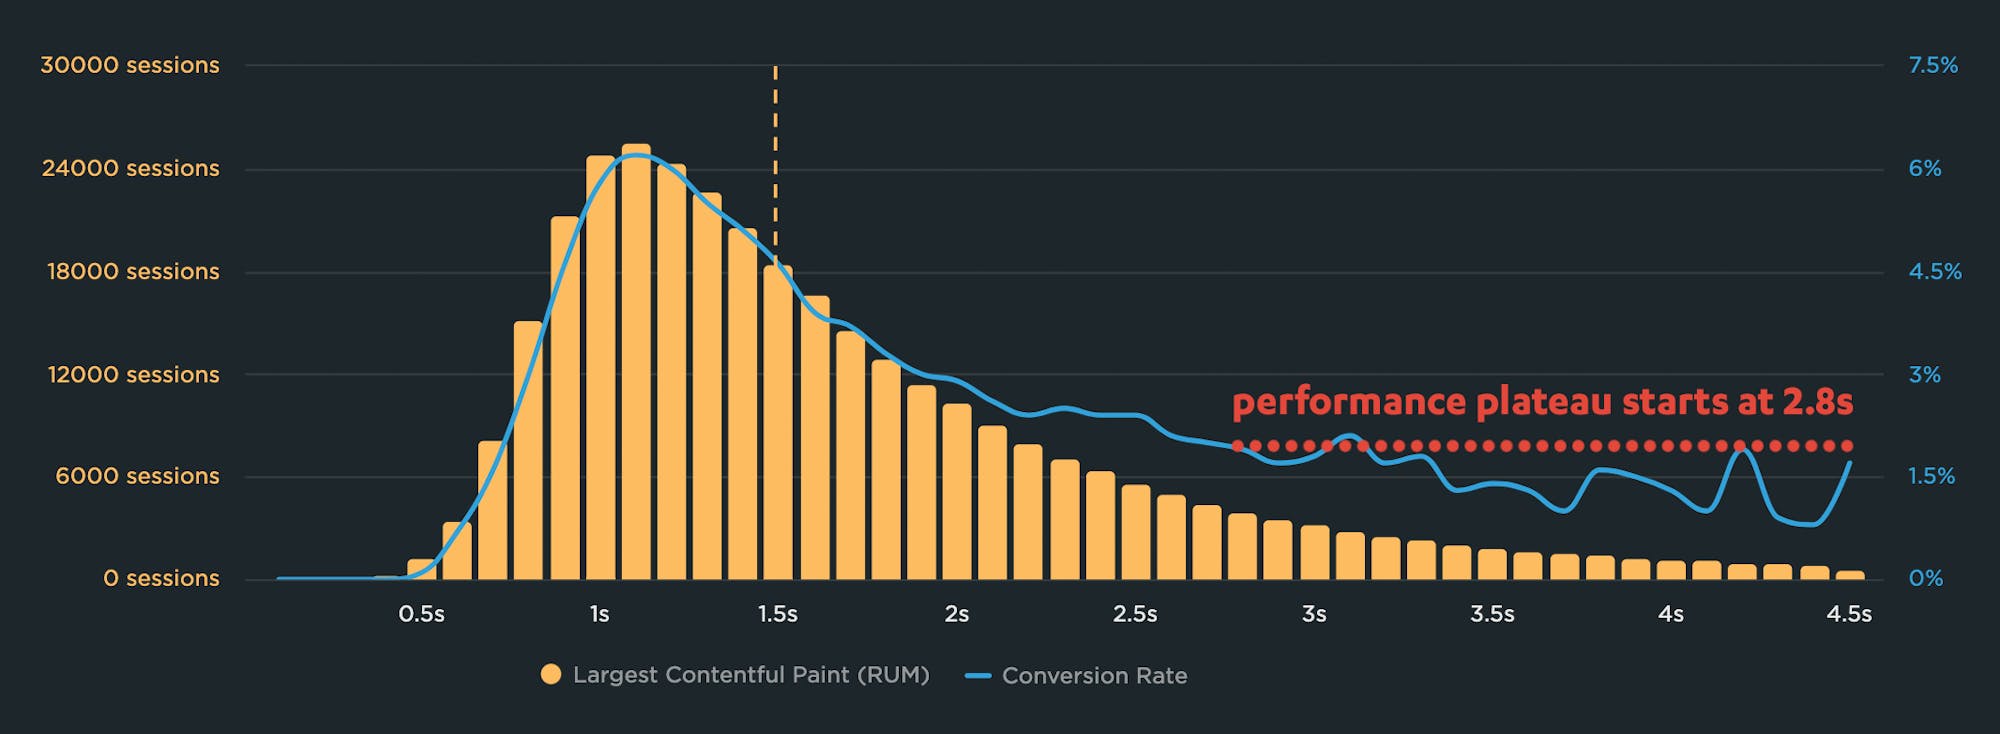
At 2.8 seconds, the conversion rate for this site plateaus. In other words, improving LCP times within the plateau zone – for example, from 4 seconds to 3 seconds – will probably not help conversion rate.
3. Identify your cohort of users who drop off the performance plateau
Using the above data, you can easily calculate the number of users who experience the performance plateau, just by adding up all sessions in the cohorts from 2.8 seconds to 4.5 seconds.
4. Identify average customer lifetime value for your business
Your repeat customers are arguably your most valuable customers. That's why it's helpful to know the average customer lifetime value (CLV) for your business.
CLV is a metric that projects the total average value of your customer based on past spending. Your accounting or finance teams will have this data. Calculating CLV can be complicated (and that complexity goes beyond the purposes of this post), but here's a simple way to approach it:
- Segment your customers based on their purchase recency, frequency, and monetary value
- Determine average order value
- Figure out average purchase frequency
- Calculate customer value
- Multiply customer value by average lifetime value
For example, if you know that the median spend of a returning customer over the past three years is $1,000, then predicted future value for the next three years is $1,000. Total customer lifetime value is $2,000.
5. Calculate the lost CLV
Using the stat that 28% of the customers who fall off your performance plateau will permanently abandon a site that is consistently slow, identify the lost CLV.
Example CLV calculation
For example:
- If the median value of a returning customer over the past three years is $1,000, then predicted future value for the next three years is $1,000.
- Your current converting user base is 100,000 customers. They have a collective CLV of $200 million. Their projected collective spend over the next three years is $100 million.
- 10% of those customers (10,000) experience Largest Contentful Paint times at the poor end of the performance plateau.
- 28% of those customers (2,800) will not return.
- Your projected lost CLV is $2.8 million.
As said, this is a simplistic calculation, but it's a good starting point to calculate your own formula that you can use for your site and your users.
Also note that this formula focuses only on lost CLV. It doesn't consider the immediate lost revenue from customers who abandon their transaction due to slowness.
Preventing outages is just one piece of the performance pie
If your business is reliant on your site, then you most definitely should care about preventing outages. You should, of course, conduct load testing and availability testing, and you should have effective load balancing and failover systems in place wherever possible.
But protecting your site from failure is just one piece of the performance pie. It’s a big piece, to be sure, but there are others. You also need to:
- Track your site’s performance using synthetic monitoring (AKA lab testing) and real user monitoring (AKA field data)
- Correlate performance metrics (such as Start Render, LCP, INP) with business and user engagement metrics (conversions, bounce rate, etc.) using your real user monitoring tool
- Integrate synthetic testing with your CI/CD process to catch regressions in your staging environment
- Create performance budgets to get real-time alerts when key pages slow down
- Drill down into your synthetic/lab data to resolve performance issues as they occur
- Look for opportunities to further optimize your pages (hint: images and third parties are a great place to start)
SpeedCurve lets you fight regressions from multiple angles of attack, so you can keep your site fast and your users happy – and your business successful. Give us a try!

Read Next
Want to truly understand the impact of site speed on your visitors and your business? Combine conversion data with performance data.
Have you ever wondered why your site got faster, but your business and user engagement metrics didn't change? Here's why.