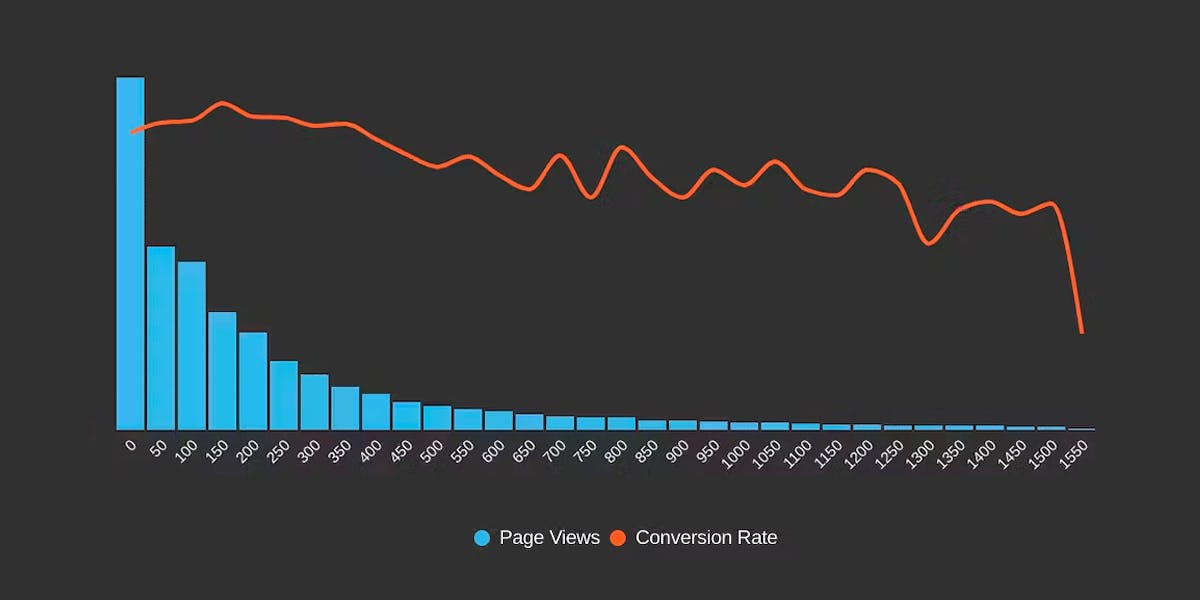
How to find (and fix!) INP interactions on your pages
Andy Davies – fellow SpeedCurver and web performance consultant extraordinaire – recently shared an impressive Interaction to Next Paint (INP) success:
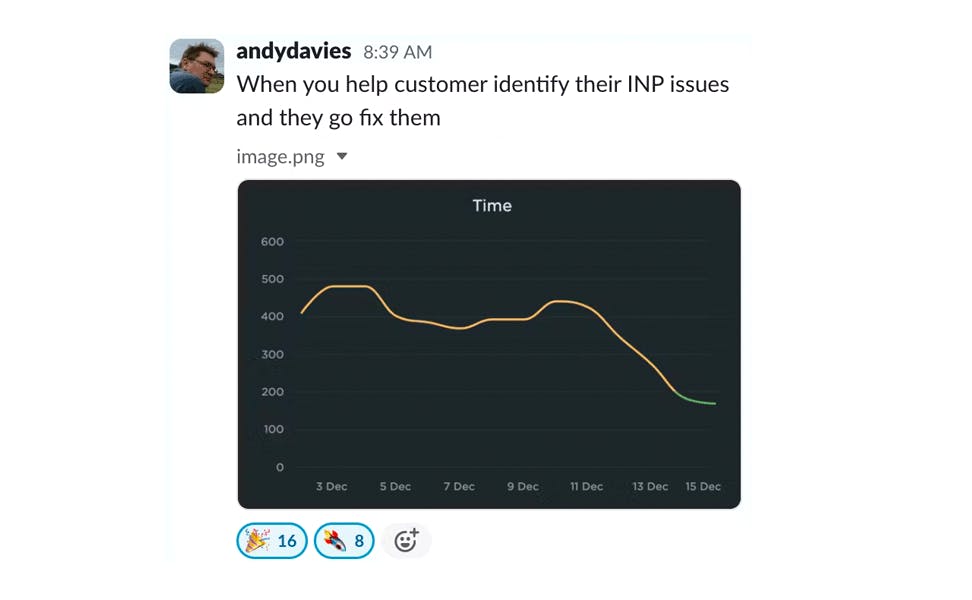
Andy has promised us a more in-depth post on debugging Interaction to Next Paint. While he's working on that, I'll try not to steal his thunder while I share a tip that may help you identify element(s) causing INP issues for your pages.
What is Interaction to Next Paint?
As of March 2024, Interaction to Next Paint (INP) will be one of the three Core Web Vitals, a set of metrics intended to measure web performance from an end user's perspective. INP measures how responsive a page is to user interaction(s). This is measured based on how quickly the page responds visually after a user interaction (i.e., when the page paints something in the browser's next frame after you interact with it).
For the purposes of INP, an interaction is considered any of the following:
- Mouse click
- Touchscreen tap
- Key press
Because INP measures actual user interactions, it can only be monitored using a real user monitoring (RUM) tool. INP is measured using the Event Timing API, which is supported in Chrome, Edge, Firefox and Opera. (Alas, currently there is no support for INP in Safari.)
What are interaction metrics?
Interaction (IX) metrics focus on the first interaction a user has with an element on your page. In SpeedCurve RUM, these interactions include:
- IX Type – Click/tap, scroll, key press
- IX Time – When the first interaction occurred relative to the start of the initial navigation to the page
- IX Element – The element the user interacted with
We've been measuring interaction metrics (IX metrics) in RUM for a while. Knowing when users are able to interact with your site is an important part of understanding the user experience.
We've talked a lot about when a user interacts with the page, which most commonly is well after the page has loaded. This poses a challenge for measurement in the field, as a lot of RUM providers, including us, are somewhat beholden to the onload event to fire our beacon. We've addressed this by sending a second beacon on that first interaction, which in turn has allowed us to capture other metrics such as First Input Delay (FID) and Interaction to Next Paint (INP).

INP measures the responsiveness of those first interactions. We've yet to start exposing the INP element or associated LoAF attribution (coming soon), but have found that a lot of the time you can use the IX element as a starting point for troubleshooting INP.
How to identify popular IX elements in SpeedCurve
With SpeedCurve RUM, we've found that the IX element is likely to be the INP element in A LOT of cases. Here is a quick workflow you can use that may help you find and fix INP issues.
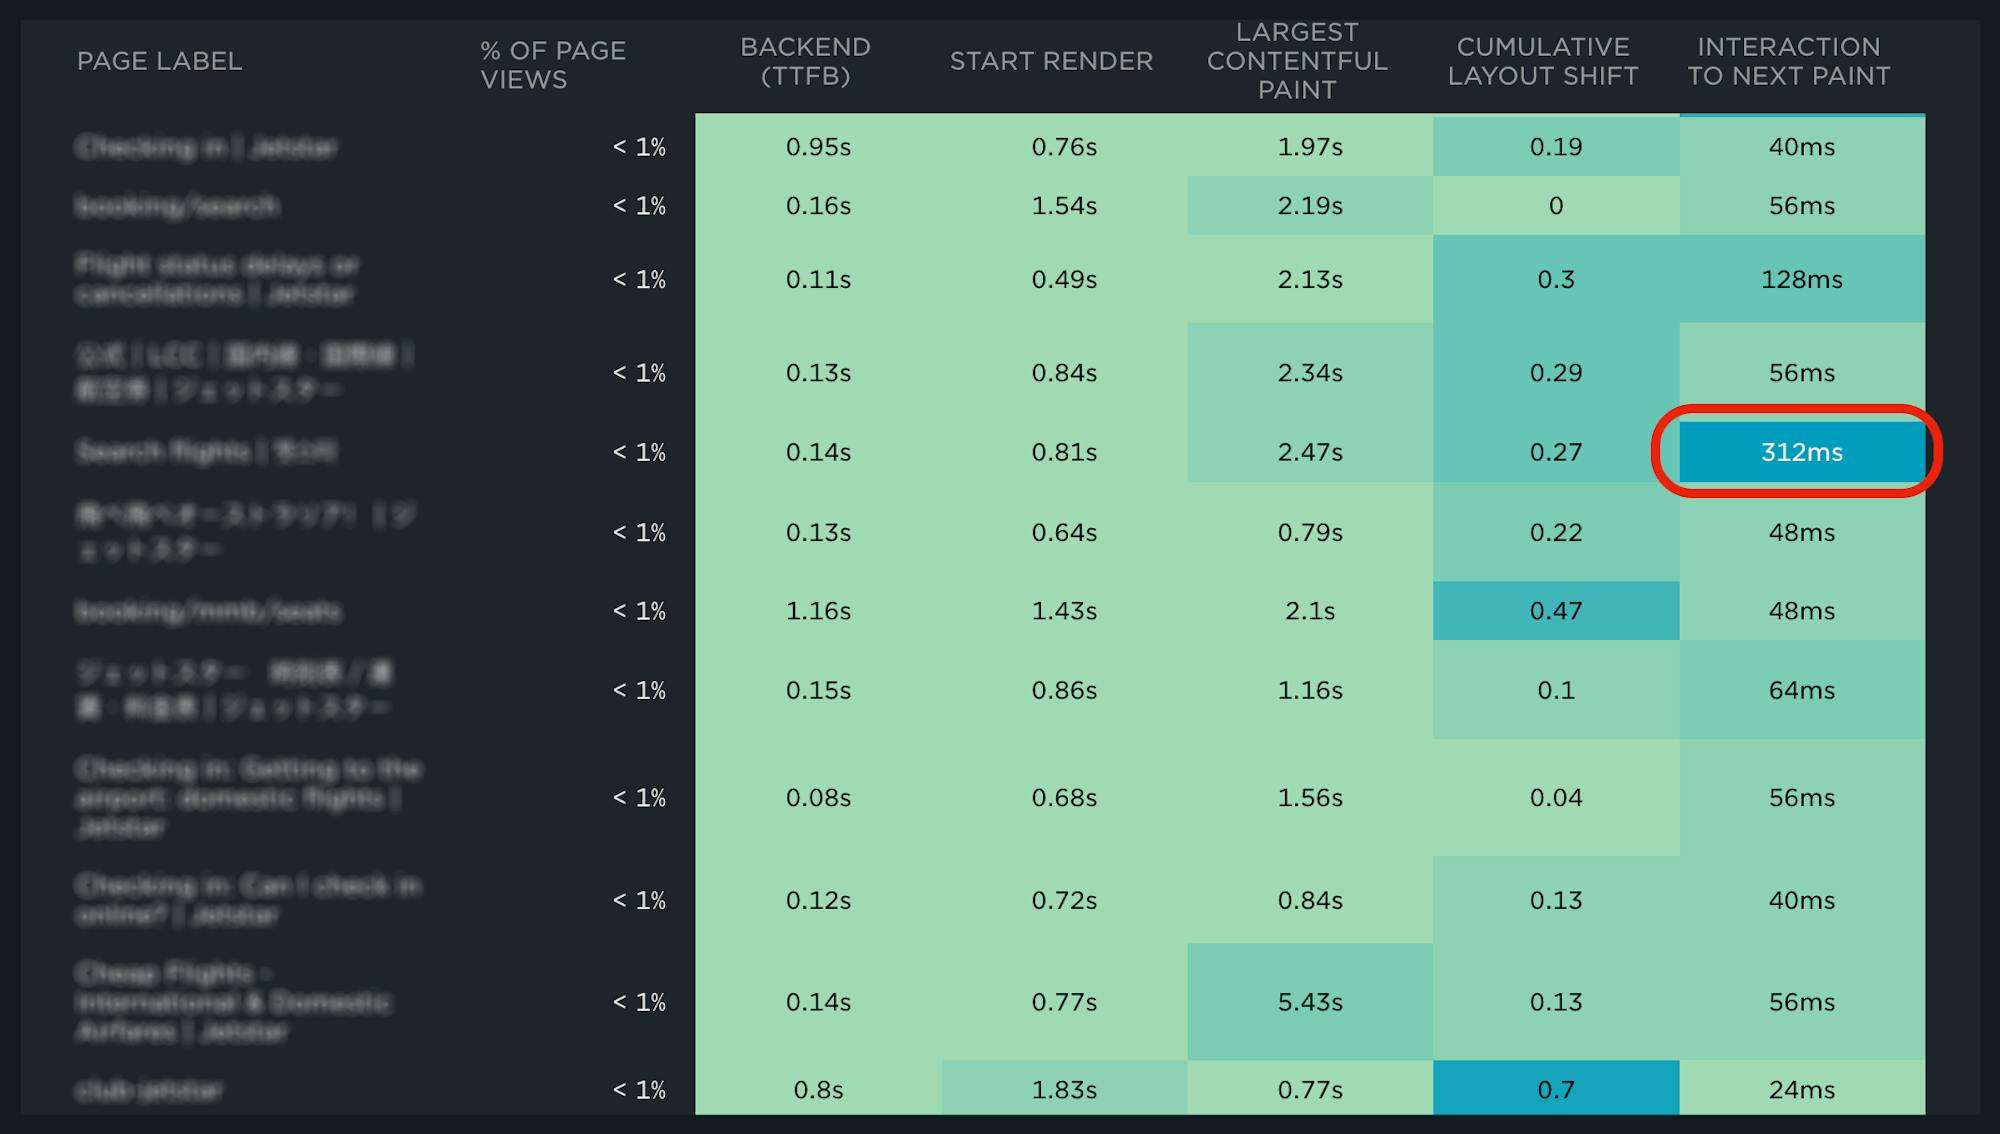
Step 1: Using the heatmap in the RUM Performance dashboard, identify pages with slow INP.
Step 2: Navigate to the RUM Design dashboard and filter the to the page label from the heatmap associated with the slow INP value.
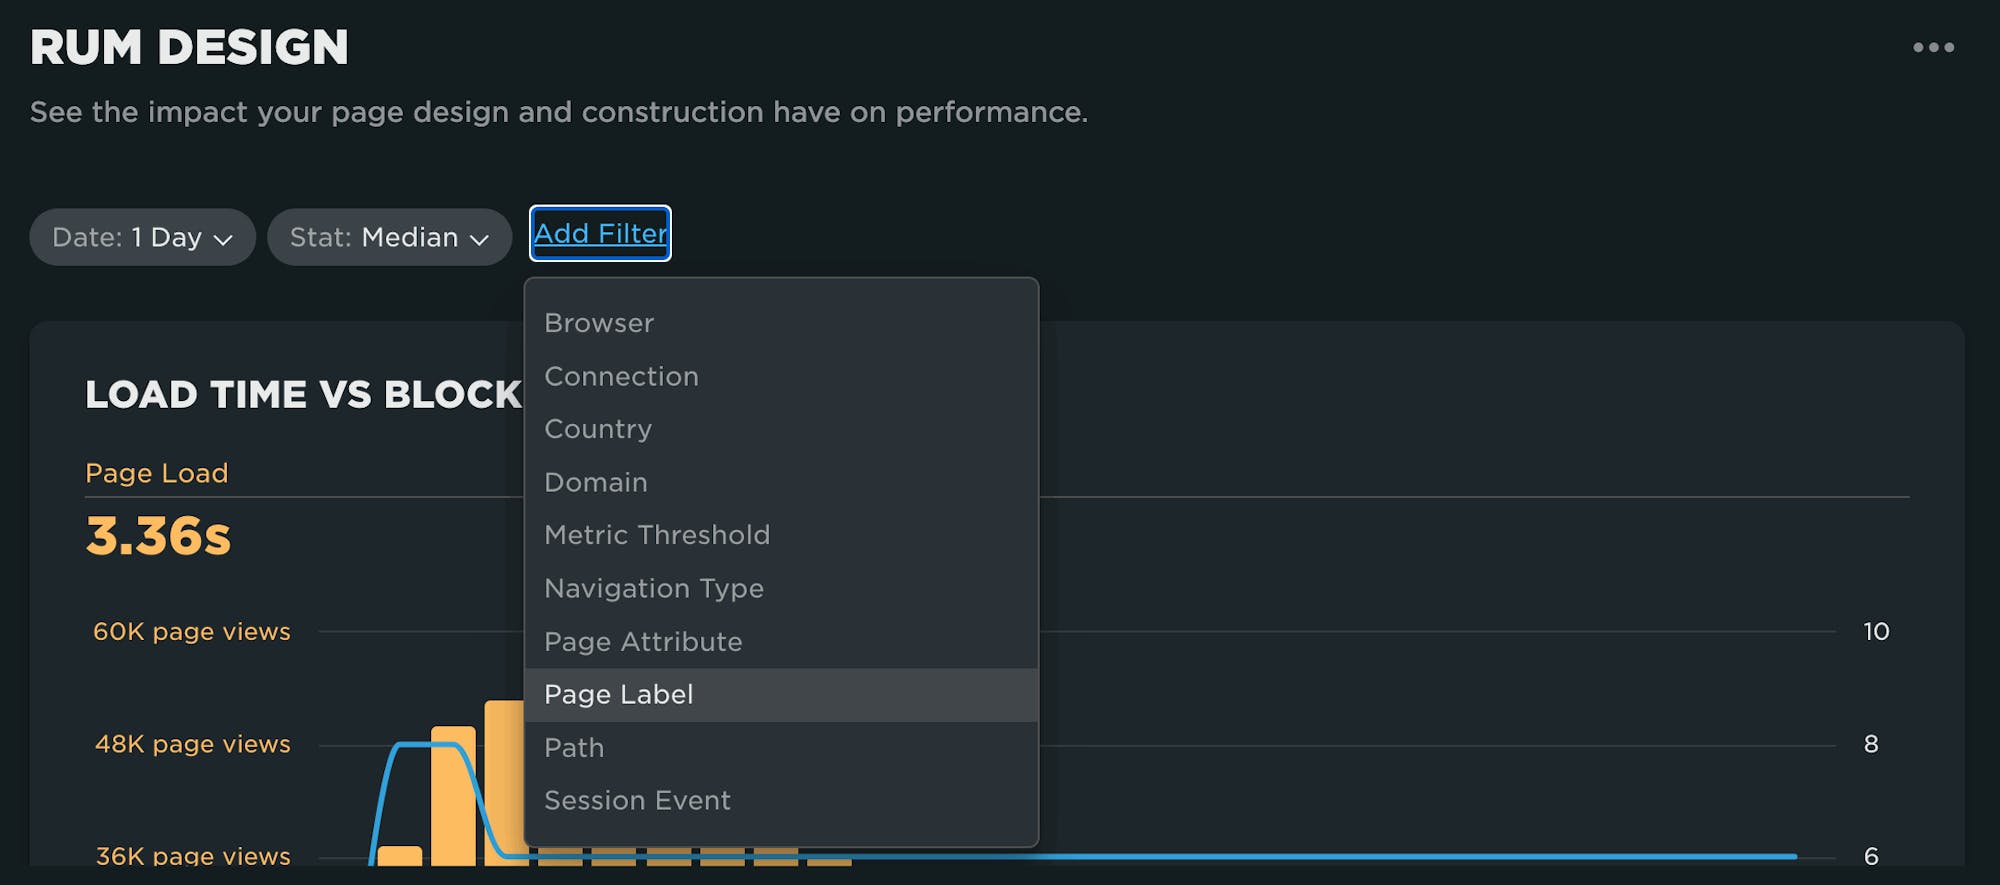
Step 3: Identify the most popular interaction elements for that page shown in the Interaction Element section. (Note that these elements listed are NOT associated with scroll interactions. This is important as INP, FID, LCP, etc. do not consider the scroll event an interaction.)
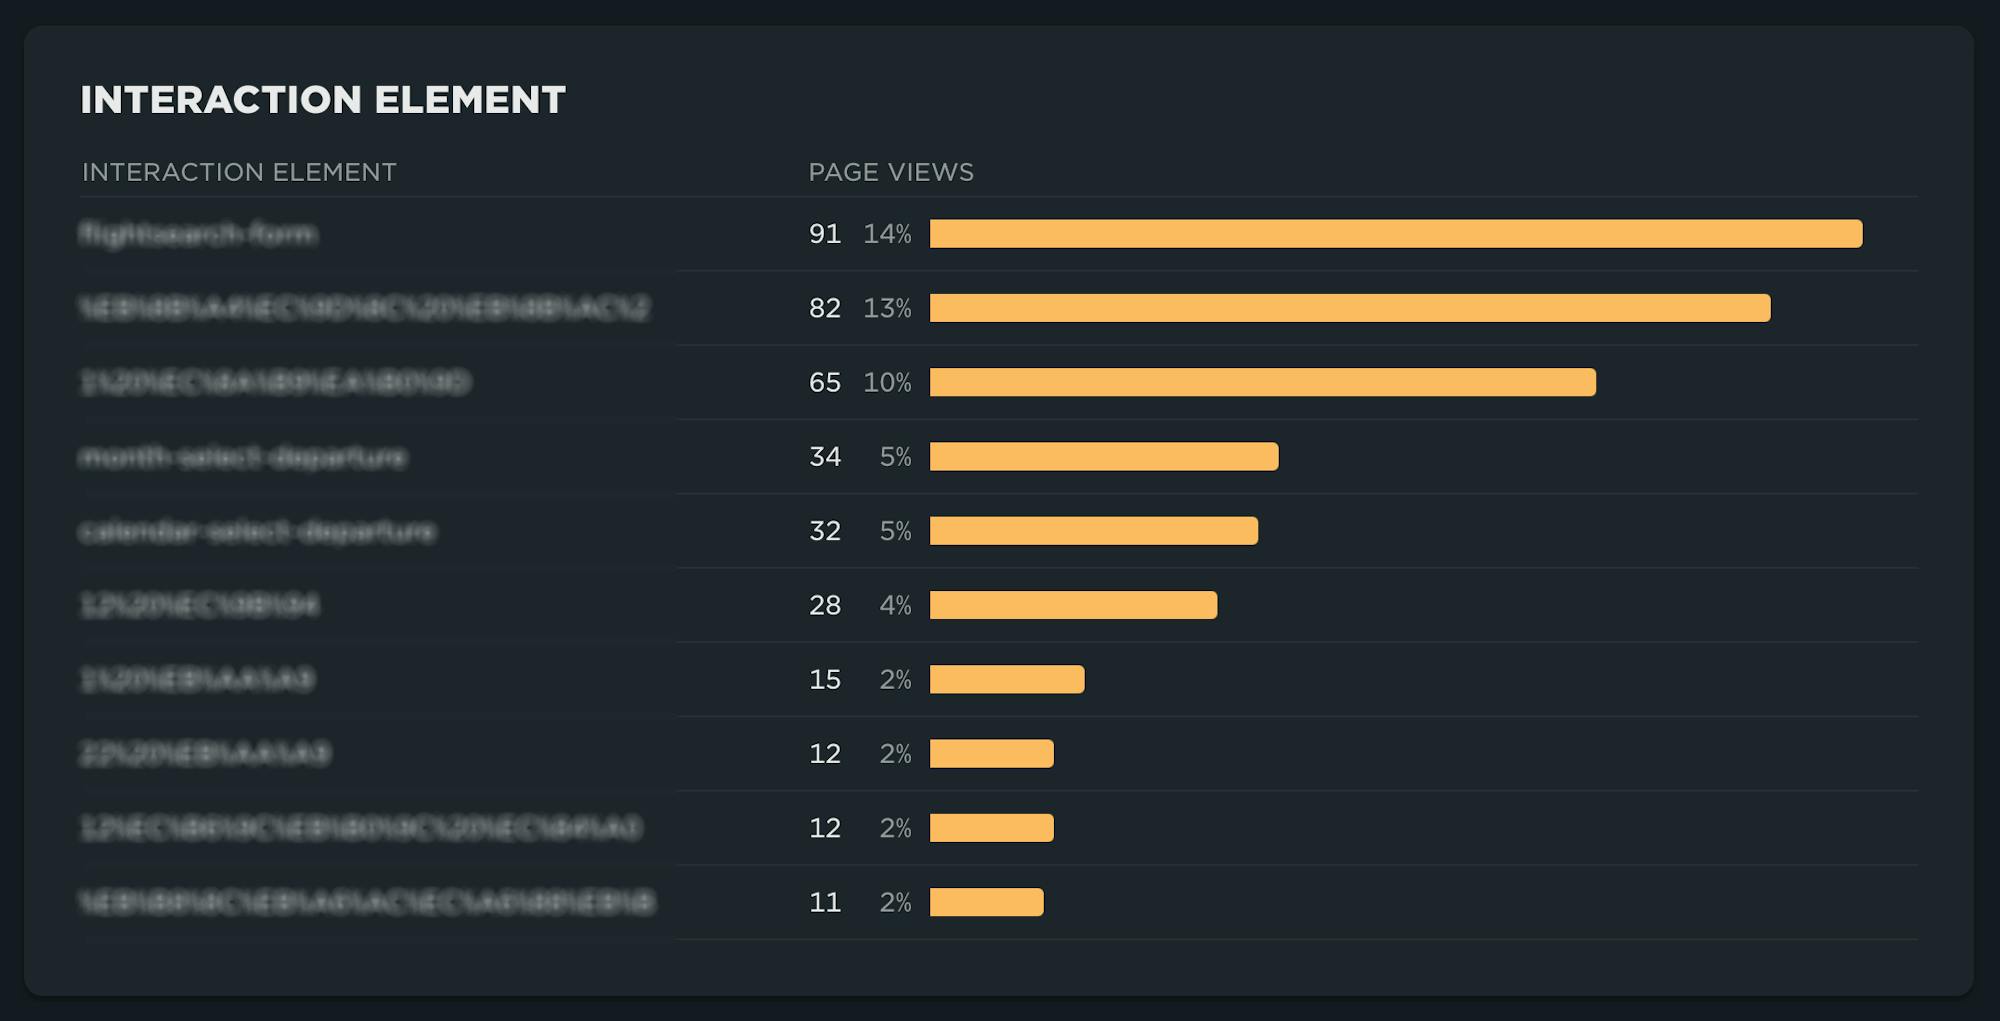
Voila! I hope this helps you address any outstanding INP issues.
We're always working on ways to provide deeper RUM diagnostics. It's going to be a great year!
More INP reading
- Farewell FID... and hello Interaction to Next Paint!
- How to add Interaction to Next Paint to your Core Web Vitals dashboard
- Does Interaction to Next Paint actually correlate to user behavior?
- Mobile INP performance: The elephant in the room
- Get started with Core Web Vitals
Have you tried SpeedCurve RUM?
Existing customer? Reach out to us to enable your free trial.
Not using SpeedCurve yet? Start your free trial.

