Are your JavaScript long tasks frustrating users?

When it comes to long JavaScript tasks, how long is too long?
The general consensus within the web performance community is that any JS scripting task that takes more than 50ms to execute can affect a user's experience. When the browser's main thread hits max CPU for more than 50ms, a user starts to notice that their clicks are delayed and that scrolling the page has become janky and unresponsive. Batteries drain faster. People rage click or go elsewhere.
No one plans to make a page or web app that sucks the life out of their users' devices, so it's super important to monitor the effect your JS is having. (Yes... I'm looking at you, front-end JS libraries and third-party ads!)
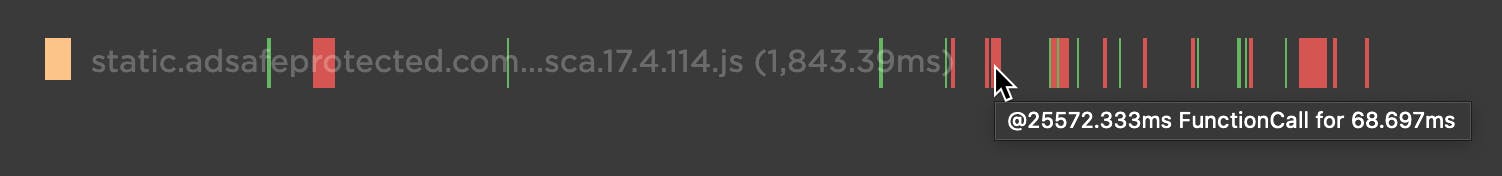
Our waterfall chart shows every long task over 50ms as a red block.
New JavaScript CPU metrics
We've recently added a bunch of new JavaScript CPU metrics that help you understand if your scripts are blocking the main thread and getting in the way of a super smooth experience for your users:
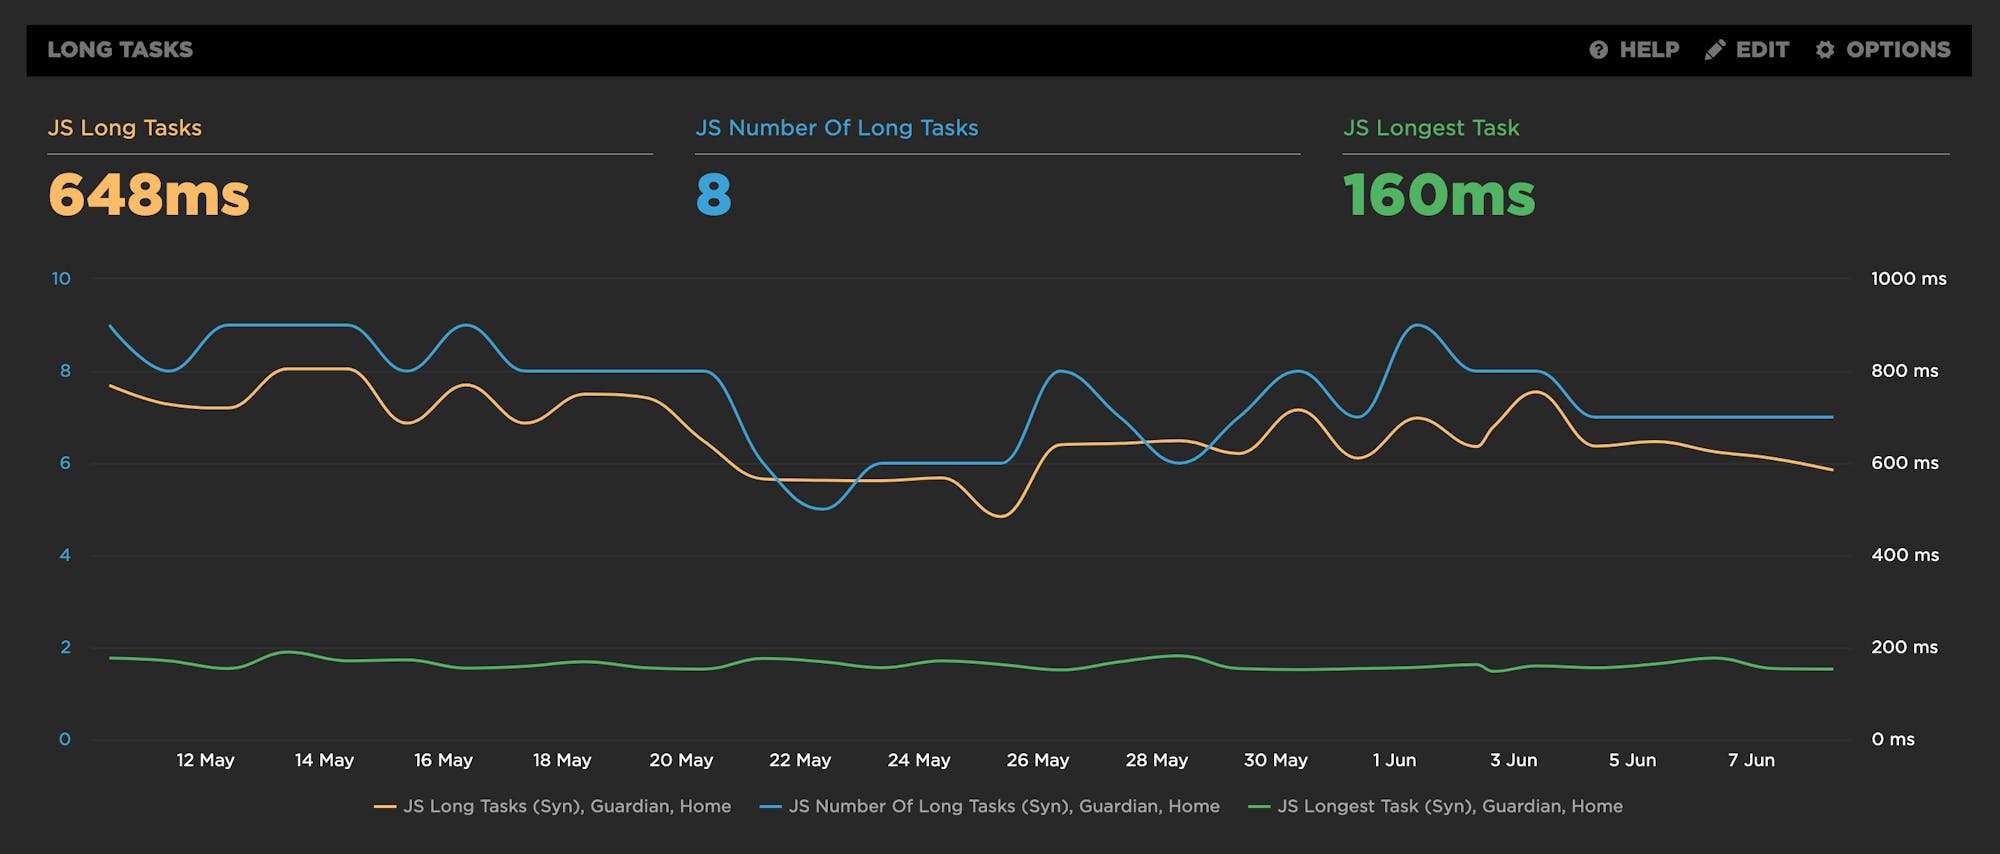
- Long Tasks – The total time of all your JS tasks over 50ms added together – from navigation start till the page is fully loaded.
- Number of Long Tasks – The total number of individual JS long tasks.
- Longest Task – There's a lot that can hide in the details of long task time. One really long task that frustrates your user is an order of magnitude worse than a bunch of long tasks that are just over the 50ms threshold each. For that reason, we track not only the number of long tasks in a page but also the duration of the longest task in the page. (We've seen individual JS long tasks taking over 1,000ms! That's a whole second where the browser just locked up, sat on its hands, and refused to do anything while a poor user mashed on the keyboard and wiggled the mouse wondering what happened.)
Track CPU metrics in your first and third parties
For those three new metrics, you not only get them for the full page load, but you also get them split out by first-party or third-party attribution, so you know exactly where the responsibility for a janky page lies. For any of your request groups, you can track long task time and set a performance budget to keep your own first-party components or any third parties honest.
Total Blocking Time
We've also added Total Blocking Time (TBT), which is one of Google's recommended Core Web Vitals metrics for lab/synthetic testing. It's great that Web Vitals includes a CPU metric, though there are a couple of caveats you should be aware of if you're tracking Total Blocking Time:
- Total Blocking Time only tracks the long tasks between First Contentful Paint (FCP) and Time To Interactive (TTI). For this reason, we think the name "Total Blocking Time" is a bit misleading. Any long tasks that happen before FCP and block the page from rendering are NOT included in Total Blocking Time. TBT is not in fact the "total" blocking time for the page. It's better to think of it as "blocking time after start render".
- TBT doesn't include the first 50ms of each long task. Instead, it reports just the time spent over the first 50ms. A user still had to wait for that first 50ms. It would be easier to interpret TBT if it included the first 50ms and better represented the full length of time a user was blocked by a long task.
Getting a page to render those first critical pixels for a user is arguably one of the most important goals of web performance monitoring. We recommend using our "Long Tasks" metric to track all the long tasks from initial page navigation right through to fully loaded. Do use TBT to help understand your Lighthouse score and Web Vitals metrics, but focus on the Long Tasks time metric to get a full understanding of the impact long tasks have on the whole page load and your users.
We recently encountered a firsthand example of why monitoring all JavaScript execution time and long tasks is so important...
The impact of delaying JS execution
Sander Heilbron from OrangeValley recently shared a fantastic example with us that demonstrates the impact managing exactly when JavaScript gets executed has on user experience.
We here at SpeedCurve had been debating the merits of dropping some JavaScript metrics that measure execution time before the Start Render event. We felt it was an important metric, but we were disappointed with the lack of usage. We actually removed the metric for a few days to see if any customers noticed. That's when Sander sent through this case study.
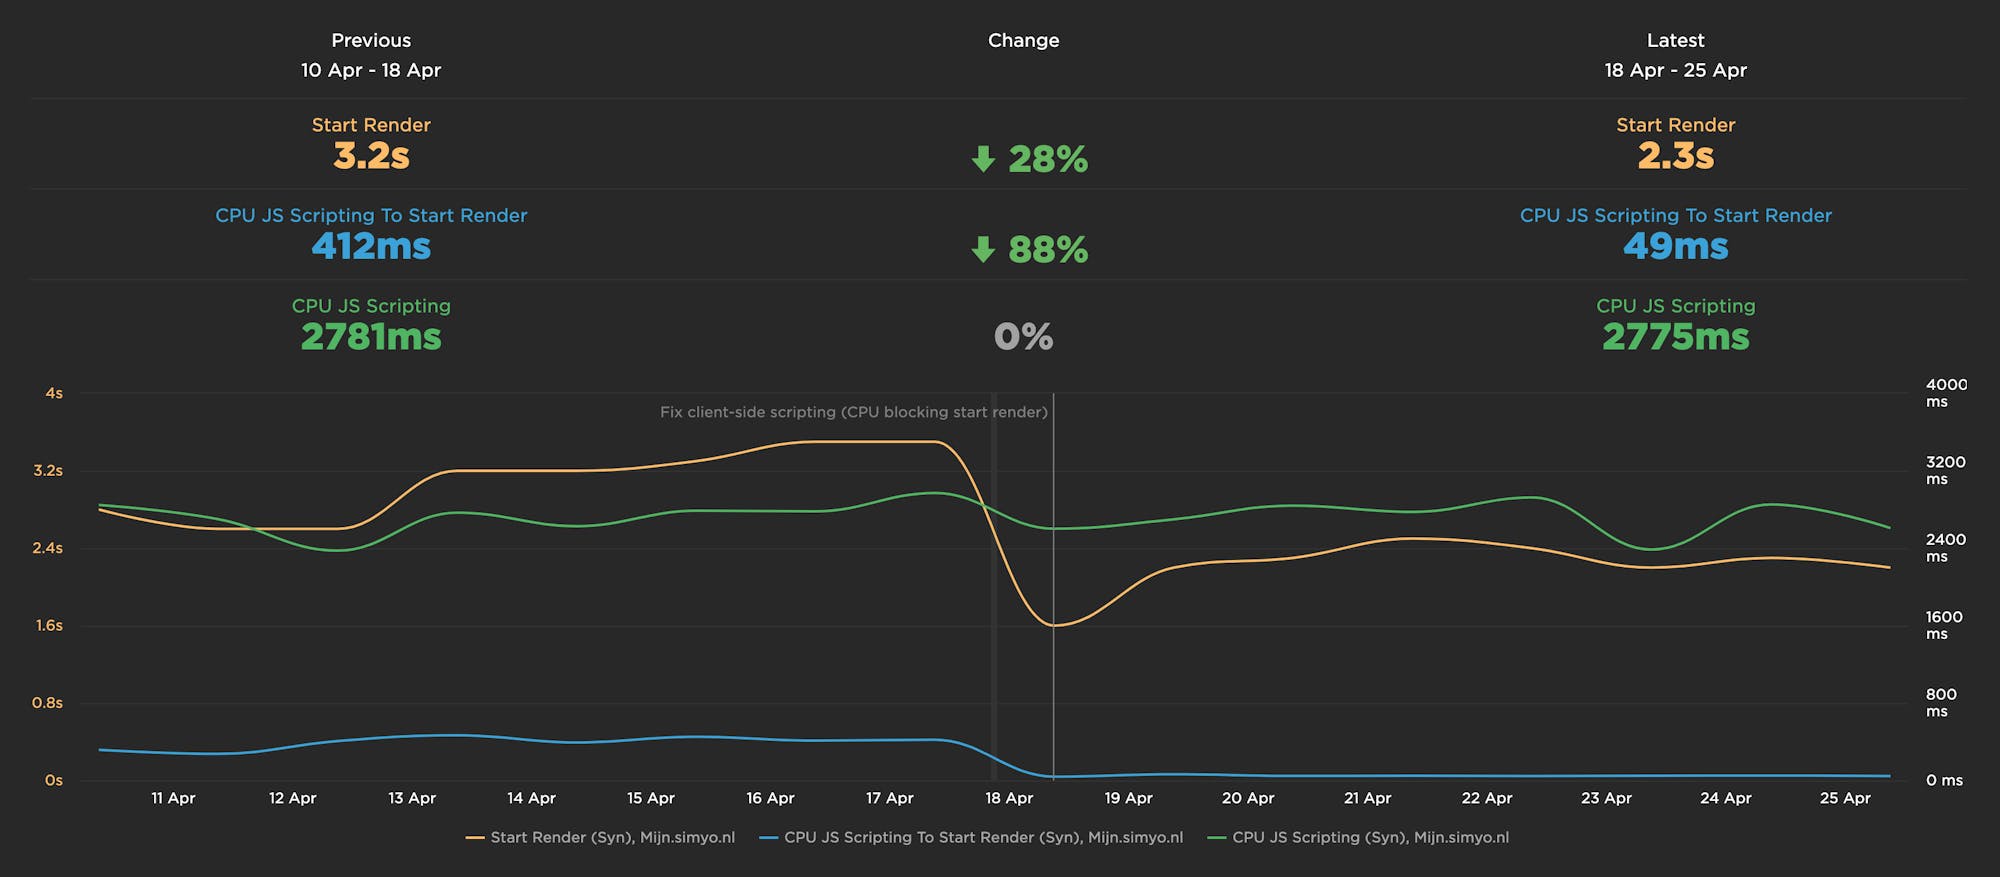
Sander had just finished a project for one of their customers, Simyo, where they focused on moving JavaScript execution from before the page started rendering to after the page was interactive. Overall, they didn't remove any JavaScript or lower the amount of execution time. Instead they carefully managed how and when that JavaScript executed. As a lot of the JavaScript wasn't critical for actually rendering the page, they moved it later in the page load, letting customers see critical content much sooner.
Here's what they found:
- Total JS Scripting time didn't change.
- JS Scripting time spent before start render reduced by a whopping 88%.
- As a result, this sped up Start Render by 28%.
That's huge. Needless to say, we immediately turned the CPU Start Render metrics back on!
You should be tracking not just how much time your pages spend executing JS, but exactly when in the page load that JS execution happens. You, too, might be able to get a big improvement in your user experience simply by consciously managing when your JS script execution happens.
Use these new JavaScript metrics to deeply understand where and when JavaScript impacts your pages. Don't just implement the latest and greatest JS libraries and hope for the best.
Eliminating long tasks
If your waterfall chart suffers from a red rash of long tasks, here are a few techniques to get them under control:
- Optimize JavaScript execution
- Code splitting
- Evaluate code in your idle periods using Philip Walton's Idle Until Urgent
The key principle is to break your JavaScript tasks into smaller chunks. That gives the browser main thread a chance to breath and render some pixels or respond to user input.
As always, we welcome your feedback, best practices, and success stories!