NEW! Chrome Beta and Canary support & LCP element highlighting

Phew! Between the fast-paced release cycle for Chrome and the rapid evolution of Core Web Vitals, the month of May has been a busy one here at SpeedCurve. With that, we are excited to bring you some new features and enhancements to help you stay focused and ahead of the game as we move into summer.
Read on to learn more about:
- Chrome Beta and Canary support
- Largest Contentful Paint (LCP) element highlighting
- Key rendering times
Introducing Chrome Beta and Canary support
Keeping pace with Chrome release cycles is challenging. On one hand, we like to keep our synthetic monitoring agents as stable as possible, while on the other we know how important it is to get in front of changes in order to keep your app running smoothly. We're excited to announce custom browser support for Chrome Beta and Canary, in addition to our stable version.
Understanding Chrome releases
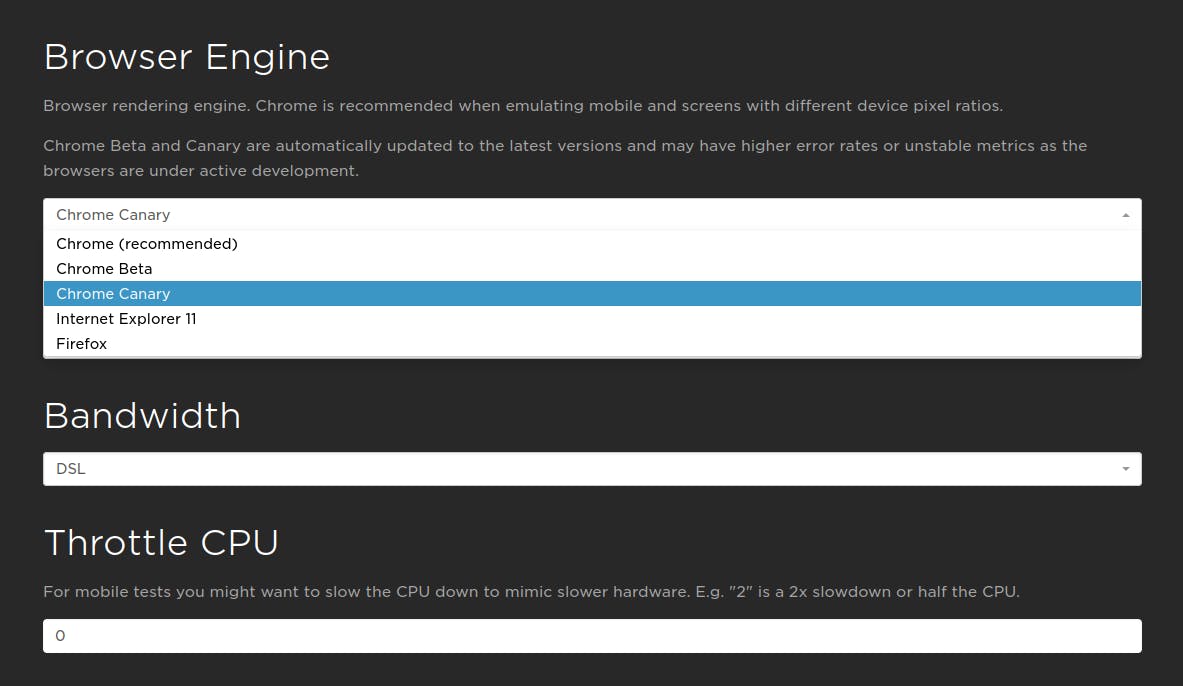
The Chromium team provides the community with early access to all releases. For our purposes, we provide three versions for synthetic testing:
- Stable – This is the latest supported version of Chrome that has been tested for stability on our platform. We update our stable release about once a quarter, so it's quite possible we will be a version or two behind the current stable Chromium build.
- Beta – Think of this as 'What's next'. It's typically very consistent, with builds rolled out about once a week.
- Canary – This is the very latest and greatest. This is expected to be under heavy development, with new builds rolling out daily.
Getting started
Adding Beta and/or Canary to the list of available browsers in your synthetic test settings is quite simple. Check out our guide for a quick walkthrough.
Pro tip: If you want to compare across all three versions, set up a custom stable version as well. While the default desktop version of Chrome is already available, you can ensure that all other settings you select for the profile are the same.
Once created, you can easily add the new profiles to your existing or future site configuration.
Common use cases
Validate changes seen in RUM
Changes to your real user monitoring (RUM) metrics can happen at any time, for any number of reasons. Our stable agents are only updated after extensive testing and can be out of step with the latest Chrome release. Having early access to beta helps you spot browser-related issues before your users do.
Get ahead of key metric changes
Whether its Core Web Vitals, Lighthouse, or your own custom metrics, having early access to Chrome builds can help you manage any surprises coming your way and keep you moving in the right direction.
Future-proof your application
While we've historically seen browsers getting faster, that doesn't mean your application will always follow suit. Understanding the behavior of modern-day applications on a rapidly changing platform like Chrome can bring you peace of mind. Your future self will thank you.
What if things look strange?
Don't panic. The Beta and Canary releases are under active development and it's expected that you'll see some instability. If you see an unexpected change related to your metrics or Lighthouse behavior, we'd love to hear about it. Otherwise, cross-check with Chrome Platform Status and the Web Vitals Changelogs.
LCP highlights and key rendering
Chrome recently did everyone a solid by giving us more context for Largest Contentful Paint. As of Chrome 90, the bounding rectangle of the element classified with LCP has been exposed. (Thanks, Yoav!) This allows us to highlight the element within the frame, removing any doubt of what Chrome identified when reporting LCP.
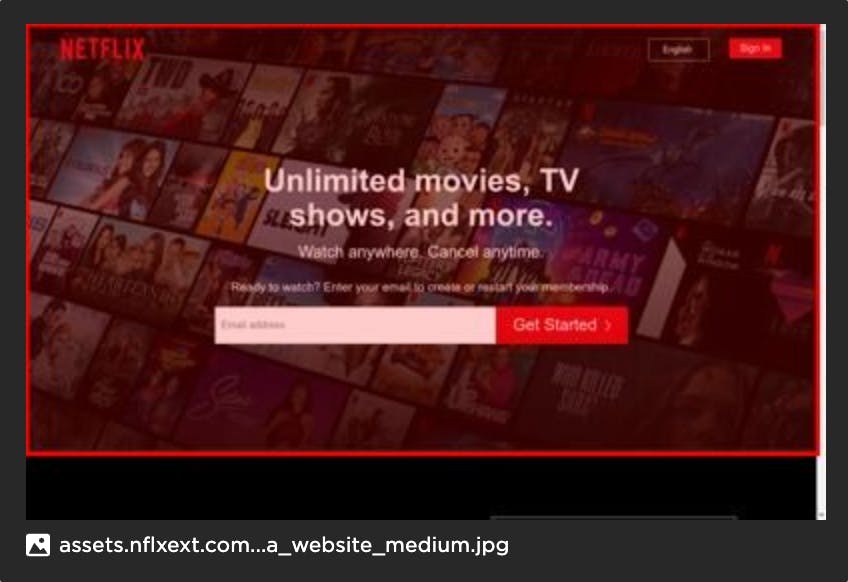
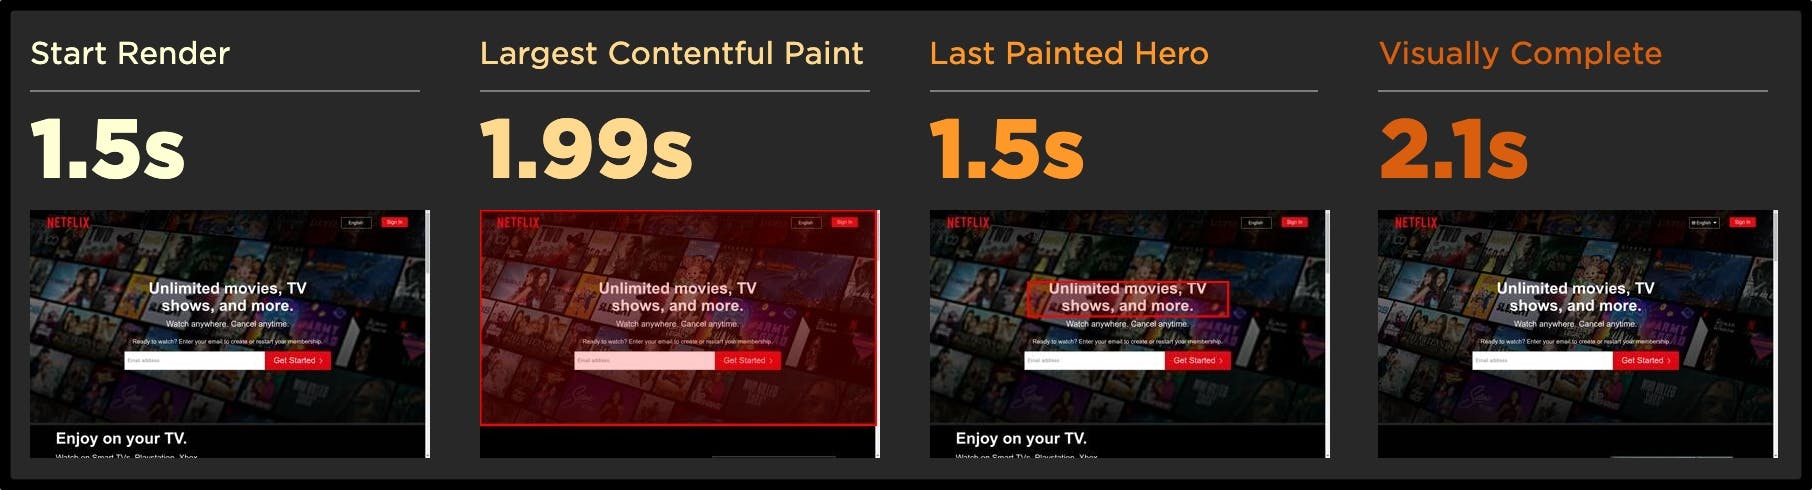
Pairing this with our own Last Painted Hero metric gives you a great way to determine meaningful rendering moments within the page:
Where can I find these visualizations?
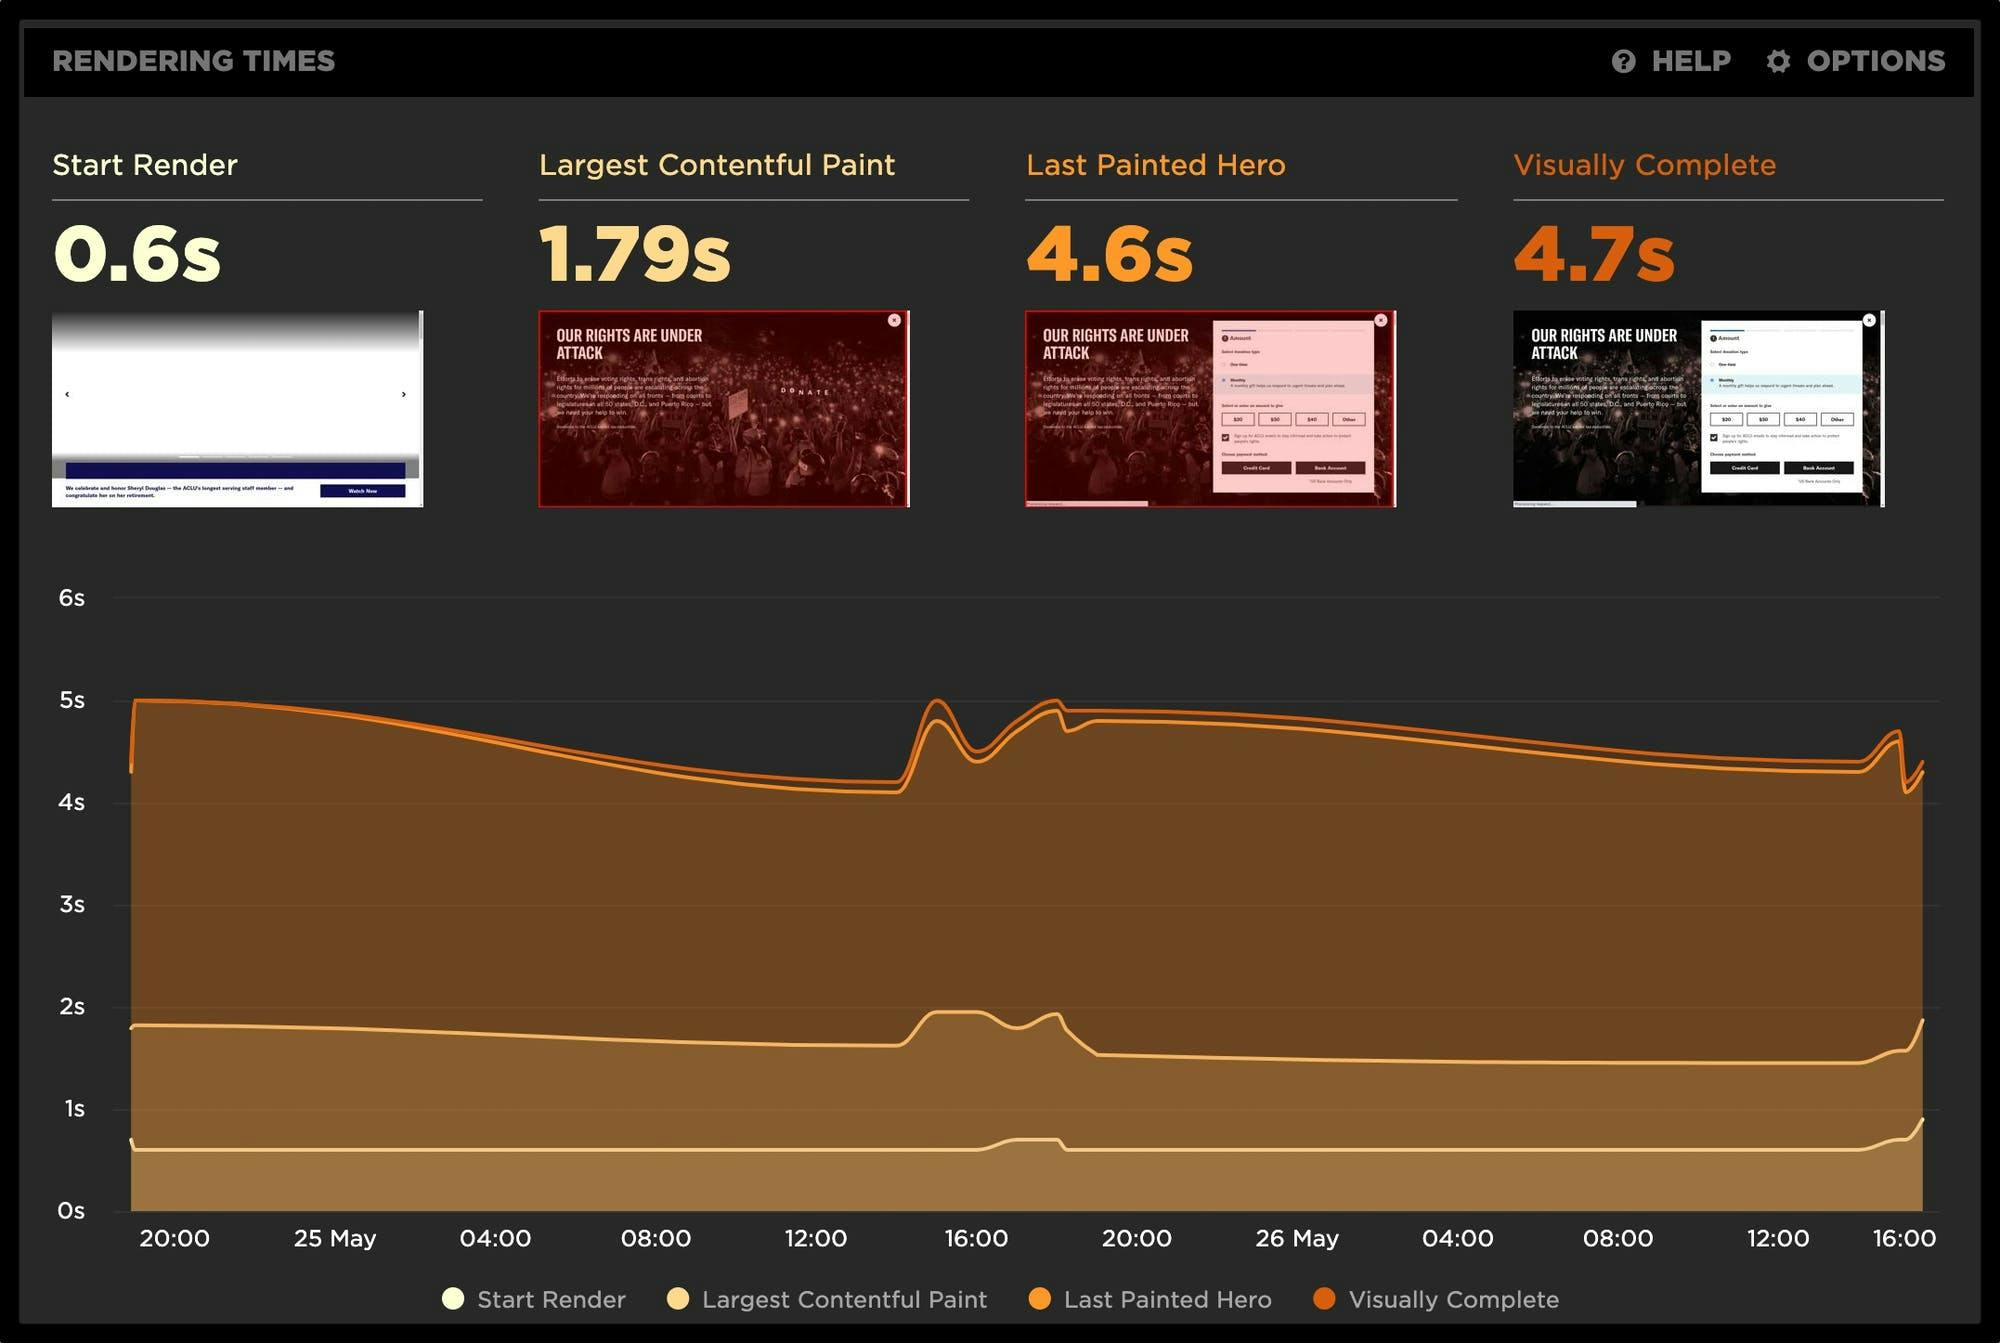
The LCP highlights can be seen in your Vitals dashboard, your test details, and your Sites dashboard, where you'll also see how the metrics are trending over time, like this:

Things are moving pretty fast in the world of performance these days, but we hope this gives you the head start you need to stay out in front. We think these new capabilities are pretty cool and hope you do as well. As always, if you have any questions or feedback, please shout out in the comments or via email at support@speedcurve.com.
Read Next

See how customers are using SpeedCurve to make their sites faster.

See industry-leading sites ranked on how fast their pages load from a user's perspective.