Introducing Last Painted Hero

We're excited to announce that we've launched Last Painted Hero as an official metric. Last Painted Hero is a synthetic metric that shows you when the last piece of critical content is painted. Keep reading to learn how Last Painted Hero works, why (and how) we created it, and how it can help you understand how your users perceive the speed of your pages.
The case for smarter heuristics
When choosing the right performance metric, my soapbox for the last few years has been "not every pixel has the same value". In other words, rather than chase dozens of different performance metrics, focus on the metrics that measure what's critical in your page.
Here at SpeedCurve, we think it's good to focus on rendering metrics, because they're a closer approximation to what the user experiences. There are some good rendering metrics out there, like start render and Speed Index, but the downside to these metrics is that they give every pixel the same value. For example, if the background renders and some ads render, that could improve your start render time and Speed Index score, but it might not have a big impact on the user's experience. Instead, it's better to measure the parts of the page that matter the most to users. We call those parts of the page the "hero elements".
Measuring hero elements sounds logical, but deploying metrics that do this is difficult. It's especially difficult for browsers and performance monitoring tools that don't know the content in the page. How can browsers and tools be expected to know which parts of the page are most important? The people who are best equipped to know this are website owners, which is why we encourage adding custom metrics using User Timing and Element Timing.
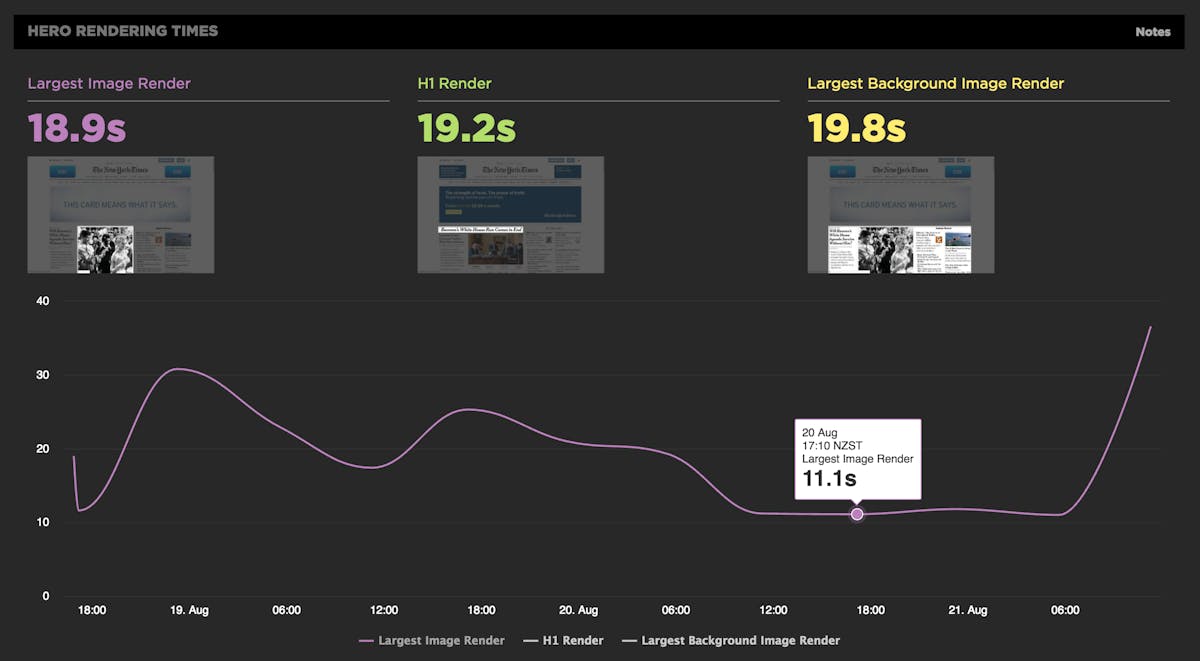
There are two drawbacks to custom metrics and element timing: every website has to do work to implement them and you can't compare your metrics to your competitors. To solve these problems, we came up with Hero Rendering Times, which use heuristics to determine the critical parts of the page. After analyzing thousands of websites we settled on three hero elements that are critical across almost all websites:
- largest image – Many websites have a "hero image" - an eye-catching image that dominates the viewport.
- largest background image – Instead of using an IMG image, sites like Airbnb and Apple use a background image. (In fact, Apple's background image has "heroes" in the URL.)
- largest text – Often the critical part of the page is text, especially on media sites that contain headlines for each story. Since these pages often use custom fonts, measuring largest text (within the first h1 tag on the page) is a good way to track how fonts affect rendering.
We launched Hero Rendering Times last year as part of SpeedCurve synthetic testing. Below is an example from The New York Times. With Hero Rendering Times, site owners can track when critical parts of the page actually render and get a much better idea of what the user experiences.
Other rendering metrics have come along recently, including First Contentful Paint and First Meaningful Paint. These metrics use different heuristics to identify when critical content has been rendered, but the results vary. In my Rendering Metrics blog post – which compares how these metrics work and how well they approximate user-perceived performance – I shared a picker where you can test your own perception of critical content rendering and see how your perceptions align with a variety of popular metrics. For the purposes of that blog post, I had to come up with a composite metric for the Hero Rendering Times:
max(h1, (biggest_img || bg_img))
The composite metric is computed by taking the maximum of the largest text time ("h1") and the biggest IMG time (or biggest background image if biggest IMG doesn't exist).
Introducing Last Painted Hero
While at #PerfMatters Conference last week I bumped into Harald Kirschner (Mozilla) and Paul Irish (Chrome) who were talking about Hero Rendering Times as a standard metric. Paul asked if the composite metric had a name. I said it didn't – and in fact we hadn't yet rolled out the composite metric at SpeedCurve. Paul got on stage the next day and proposed the name Last Painted Hero. I like it!
After a busy few days, today we formally launched Last Painted Hero. If you're already a SpeedCurve user, Last Painted Hero is available in your Favorites dashboards, where you can chart it alongside your other metrics – or alongside your competitors. (If you're not a SpeedCurve user yet, try us for free!)
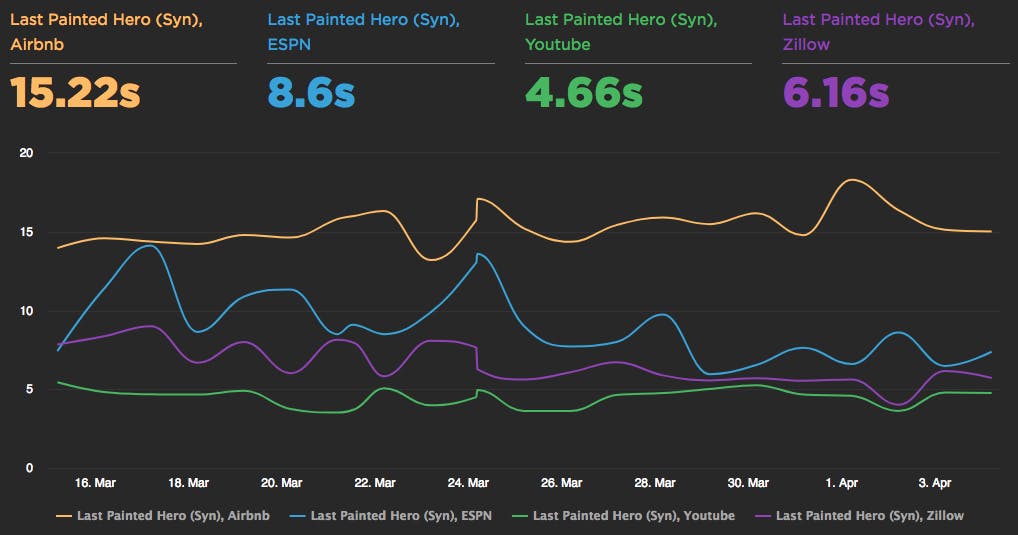
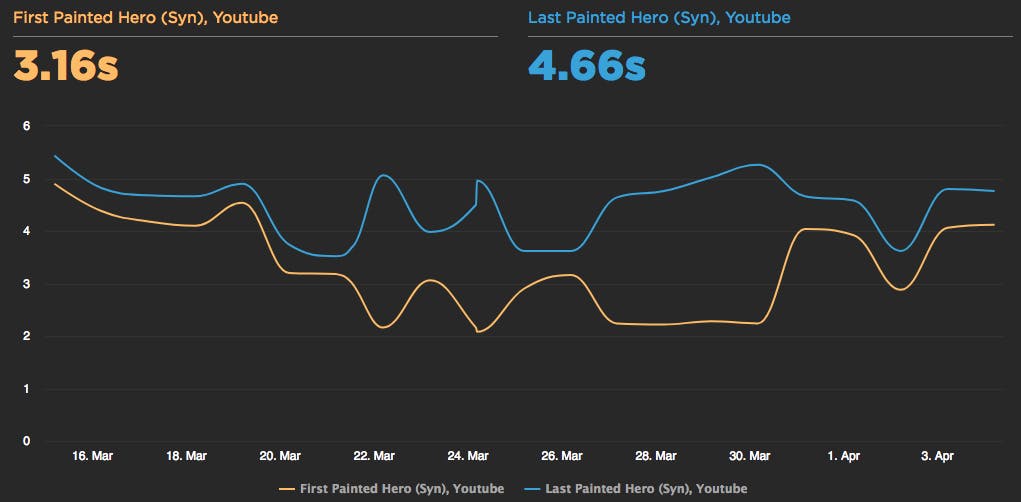
We also provide First Painted Hero, so you can track your best case and your worst case for hero elements in your pages.
This is just the beginning for First and Last Painted Hero
We're excited to get your input and make improvements. To that end, we're working on a pull request to add these metrics to public WebPageTest. Regardless of whether you use SpeedCurve or WebPageTest, we hope you'll take a look at First and Last Painted Hero and give us your feedback.