An analysis of Chromium's paint timing metrics

Here at SpeedCurve, we are continually gathering detailed performance data from tens of thousands of web pages. This gives us a relatively unique opportunity to analyse and aggregate performance metrics to gain some interesting insights. In this post, I'm going to analyse some browser-based paint timing metrics: First Paint & First Contentful Paint (defined in the Paint Timing spec and implemented in Chromium). I'm also going to analyse First Meaningful Paint (defined in a draft spec and implemented as a Chromium trace metric).
What are paint timing metrics?
The aim of almost any performance optimisation on the web is to improve the user experience. The folk at Google have been pushing this sentiment with a focus on user-centric performance metrics, which aim to answer four questions about users’ experiences:
- Is it happening? Is the page that I want to see actually loading?
- Is it useful? Has enough content rendered that I can engage with it?
- Is it usable? Can I scroll and interact with the page, or is it still loading?
- Is it delightful? Are my interactions with the page smooth?
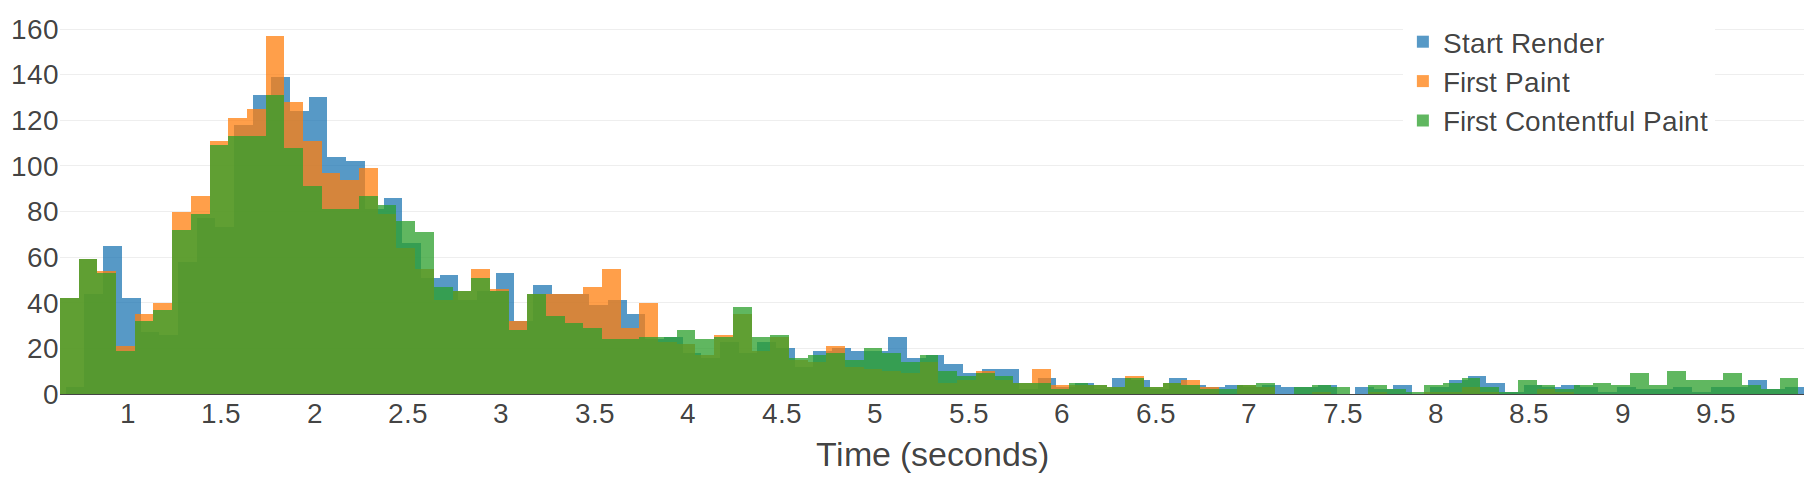
First Paint (FP) measures the point at which pixels are first rendered to the screen after navigating to a new page. First Contentful Paint (FCP) is slightly more specific, in that it measures the point at which text or graphics are first rendered to the screen. Both of these metrics are available in Chromium browsers (Chrome, Opera, Samsung Internet, etc) via the Performance API: performance.getEntriesByType('paint').
The paint timing metrics are important because they aim to answer the first question: is it happening? My analysis will look at performance data from some popular websites in an attempt to figure out whether the paint timing metrics really do answer that question.
Introducing Last Painted Hero

We're excited to announce that we've launched Last Painted Hero as an official metric. Last Painted Hero is a synthetic metric that shows you when the last piece of critical content is painted. Keep reading to learn how Last Painted Hero works, why (and how) we created it, and how it can help you understand how your users perceive the speed of your pages.
The case for smarter heuristics
When choosing the right performance metric, my soapbox for the last few years has been "not every pixel has the same value". In other words, rather than chase dozens of different performance metrics, focus on the metrics that measure what's critical in your page.
Here at SpeedCurve, we think it's good to focus on rendering metrics, because they're a closer approximation to what the user experiences. There are some good rendering metrics out there, like start render and Speed Index, but the downside to these metrics is that they give every pixel the same value. For example, if the background renders and some ads render, that could improve your start render time and Speed Index score, but it might not have a big impact on the user's experience. Instead, it's better to measure the parts of the page that matter the most to users. We call those parts of the page the "hero elements".
Performance budgets in action

Performance budgets are an important tool for ensuring your site is delivering a great user experience. Steve first experienced performance budgets while Head Performance Engineer at Google. The practice of using budgets to track performance took off with Tim Kadlec's blog post Setting a Performance Budget. The idea is to identify your performance goals and track the metrics that help you achieve your goals.
At SpeedCurve, we give performance budgets first-class status by tracking them in the Site dashboard. Here's an example of tracking a budget for image size.
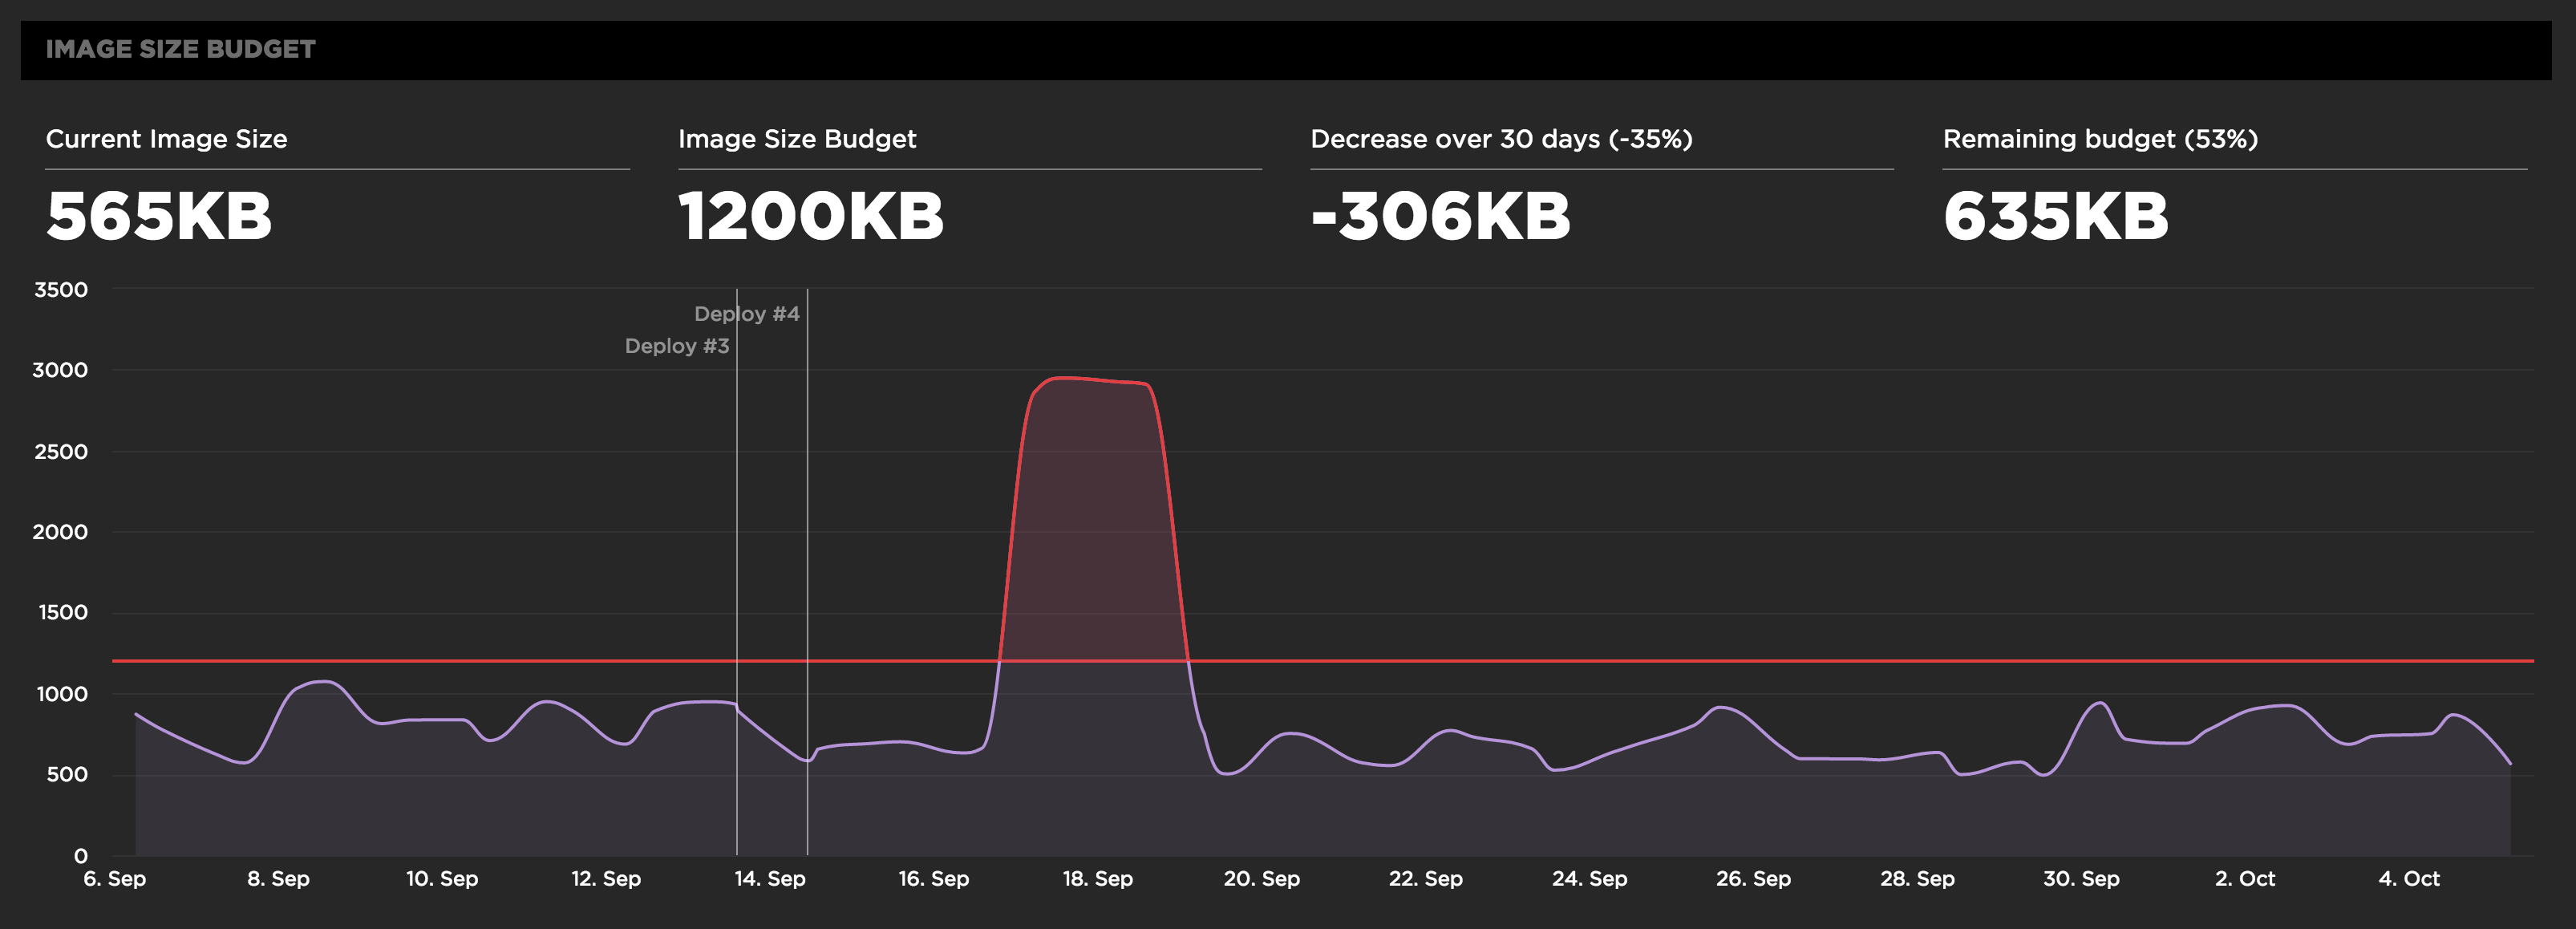
Before setting your performance budgets, you first have to be monitoring your user experience. Only then can you set budgets and thresholds for improving your baseline user experience. This also allows you to quantify the improvements you're making and share success stories across the organization like "We just improved start render by 32% by reducing image requests to half the budgeted amount".