SpeedCurve is now part of the Embrace family! There are no changes to how you use our products. Our founder Mark shares what this means...
Understanding the performance impact of anti-flicker snippets

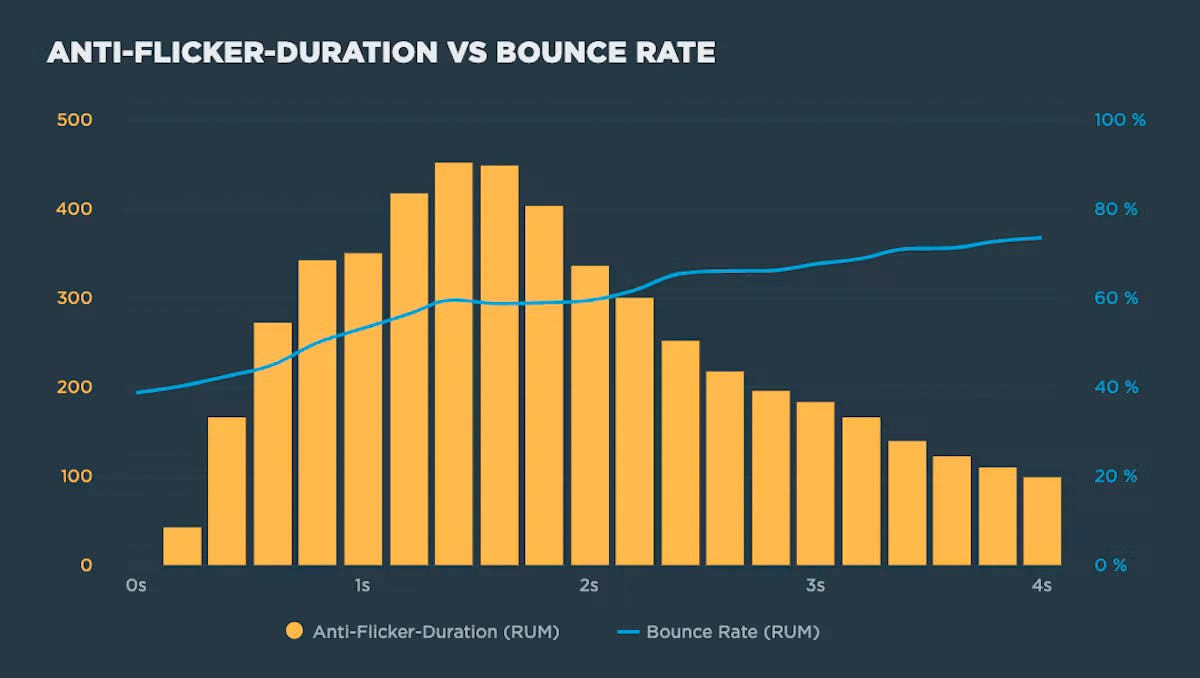
Experimentation tools that use asynchronous scripts – such as Google Optimize, Adobe Target, and Visual Web Optimizer – recommend using an anti-flicker snippet to hide the page until they've finished executing. But this practice comes with some performance measurement pitfalls:
- Hiding the contents of the page can have a dramatic effect on the Web Vitals that measure visual experience, such as First Contentful Paint (FCP) and Largest Contentful Paint (LCP)
- Anti-flicker snippets can also affect Cumulative Layout Shift (CLS) and the synthetic equivalent of First Input Delay (FID), Total Blocking Time (TBT).
In this post we'll look at how anti-flicker snippets work, their impact on Web Vitals, and how to measure the delay they add to visitors' experience.
User Timing Level 3: Set a value!

The Chrome team has snuck a fundamental change to how user timing marks work into Chrome 78. For many years now, our own Steve Souders has championed user timing, and he has always believed you should be able to set a value for a user timing mark or measure.
With User Timing Level 3, now you can! Level 3 lets you explicit set a startTime whereas previously you could only pass in the name of a mark.
performance.mark("name", {startTime: 1000})Waterfall with browser events
We've improved our already fantastic interactive waterfall chart with a new collapsed mode that highlights all the key browser events. This lets you quickly scan all the events that happen as the page loads and if you scrub your mouse across the waterfall you can easily correlate each event to what the user could see at that moment.
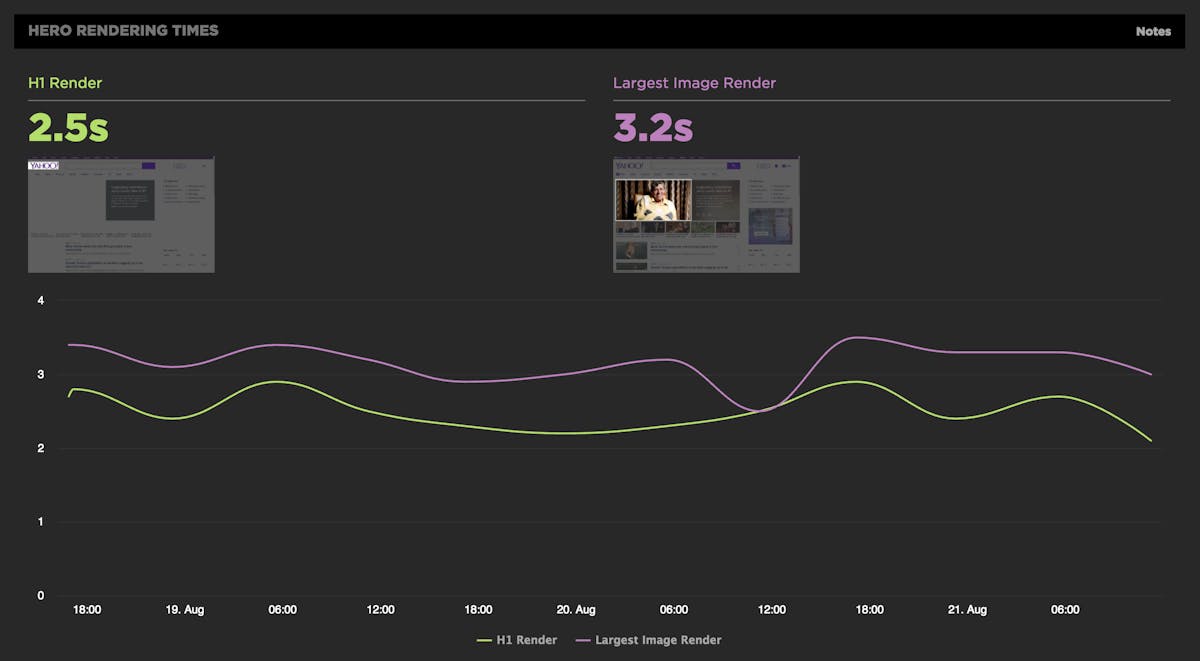
Along with all the browser metrics you also get to see our new hero rendering times in context. Click on any event to see a large version of that moment in the filmstrip.
Hero Rendering Times: New metrics for measuring UX

The key to a good user experience is quickly delivering the content your visitors care about the most. This is easy to say, but tricky to do. Every site has unique content and user engagement goals, which is why measuring how fast critical content renders has historically been a challenging task.
That's why we're very excited to introduce Hero Rendering Times, a set of new metrics for measuring the user experience. Hero Times measure when a page's most important content finishes rendering in the browser. These metrics are available right now to SpeedCurve users.
More on how Hero Rendering Times work further down in this post. But first, I want to give a bit of back story that explains how we got to here.
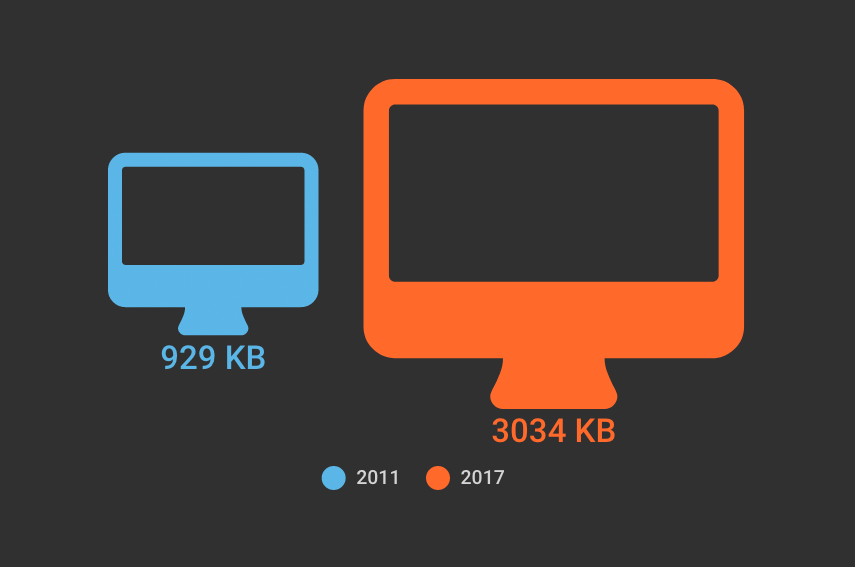
The average web page is 3MB. How much should we care?
See our more recent page growth posts:
- What is page bloat? And how is it hurting your business, search rank, and users? (July 2023)
- 10 years of page bloat: What have we learned? (March 2022)
A couple of month ago, someone asked if I'd written a page bloat update recently. The answer was no. I've written a lot of posts about page bloat, starting way back in 2012, when the average page hit 1MB. To my mind, the topic had been well covered. We know that the general trend is that pages are getting bigger at a fairly consistent rate of growth. It didn't feel like there was much new territory to cover.
Also: it felt like Ilya Grigorik dropped the mic on the page bloat conversation with this awesome post, where he illustrated why the "average page" is a myth. Among the many things Ilya observed after analyzing HTTP Archive data for desktop sites, when you have outliers that weigh in at 30MB+ and more than 90% of your pages are under 5MB, an "average page size" of 2227KB (back in 2016) doesn't mean much.
The mic dropped. We all stared at it on the floor for a while, then wandered away. And now I want to propose we wander back. Why? Because the average page is now 3MB in size, and this seems like a good time to pause, check our assumptions, and ask ourselves:
Is there any reason to care about page size as a performance metric? And if we don't consider page size a meaningful metric, then what should we care about?
Measuring the User Experience

SpeedCurve’s sweet spot is the intersection of design and performance - where the user experience lives. Other monitoring services focus on network behavior and the mechanics of the browser. Yet users rarely complain that “the DNS lookups are too slow” or “the load event fired late”. Instead, users get frustrated when they have to wait for the content they care about to appear on the screen.
The key to a good user experience is quickly delivering the critical content.
User Timing and custom metrics
If you want to improve performance, you must start by measuring performance. But what should you measure?
Across the performance industry, the metric that's used the most is "page load time" (i.e, "window.onload" or "document complete"). Page load time was pretty good at approximating the user experience in the days of Web 1.0 when pages were simpler and each user action loaded a new web page (multi-page websites). In the days of Web 2.0 and single-page apps, page load time no longer correlates well with what the user sees. A great illustration is found by comparing Gmail to Amazon.
In the last few years some better alternatives to page load time have gained popularity, such as start render time and Speed Index. But these metrics suffer from the same major drawback as page load time: they are ignorant of what content the user is most interested in on the page.
Any performance metric that values all the content the same is not a good metric.
Users don't give equal value to everything in the page. Instead, users typically focus on one or more critical design elements in the page, such as a product image or navbar. In searching for a good performance metric, ideally we would find one that measures how long the user waits before seeing this critical content. Since browsers don't know which content is the most important, it's necessary for website owners to put these performance metrics in place. The way to do this is to create custom metrics with User Timing.
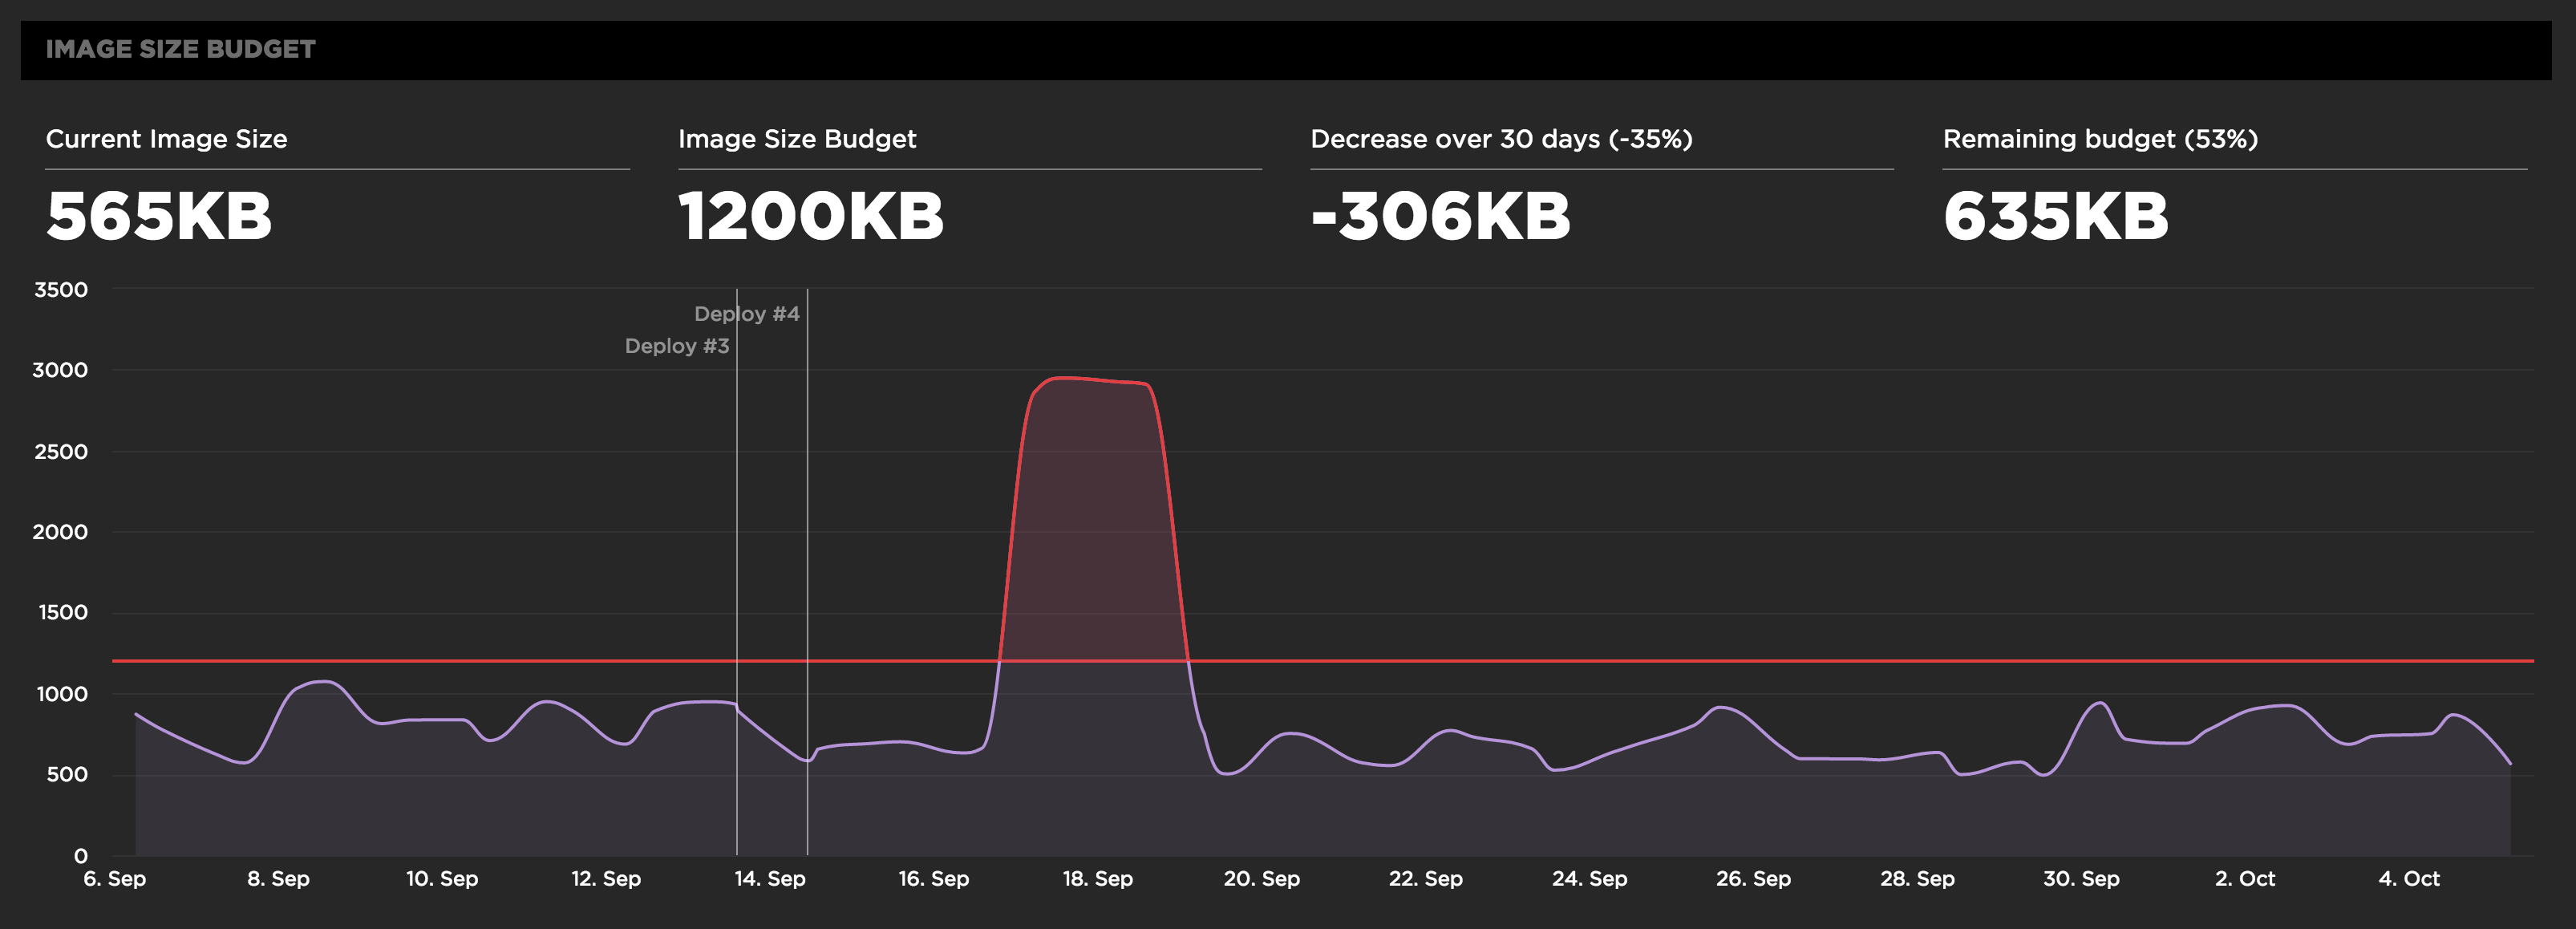
Performance budgets in action
Performance budgets are an important tool for ensuring your site is delivering a great user experience. Steve first experienced performance budgets while Head Performance Engineer at Google. The practice of using budgets to track performance took off with Tim Kadlec's blog post Setting a Performance Budget. The idea is to identify your performance goals and track the metrics that help you achieve your goals.
At SpeedCurve, we give performance budgets first-class status by tracking them in the Site dashboard. Here's an example of tracking a budget for image size.
Before setting your performance budgets, you first have to be monitoring your user experience. Only then can you set budgets and thresholds for improving your baseline user experience. This also allows you to quantify the improvements you're making and share success stories across the organization like "We just improved start render by 32% by reducing image requests to half the budgeted amount".
