User Timing and custom metrics

If you want to improve performance, you must start by measuring performance. But what should you measure?
Across the performance industry, the metric that's used the most is "page load time" (i.e, "window.onload" or "document complete"). Page load time was pretty good at approximating the user experience in the days of Web 1.0 when pages were simpler and each user action loaded a new web page (multi-page websites). In the days of Web 2.0 and single-page apps, page load time no longer correlates well with what the user sees. A great illustration is found by comparing Gmail to Amazon.
In the last few years some better alternatives to page load time have gained popularity, such as start render time and Speed Index. But these metrics suffer from the same major drawback as page load time: they are ignorant of what content the user is most interested in on the page.
Any performance metric that values all the content the same is not a good metric.
Users don't give equal value to everything in the page. Instead, users typically focus on one or more critical design elements in the page, such as a product image or navbar. In searching for a good performance metric, ideally we would find one that measures how long the user waits before seeing this critical content. Since browsers don't know which content is the most important, it's necessary for website owners to put these performance metrics in place. The way to do this is to create custom metrics with User Timing.
User Timing Spec
The W3C User Timing spec provides an API for developers to add custom metrics to their web apps. This is done via two main functions: performance.mark and performance.measure.
- performance.mark records the time (in milliseconds) since navigationStart
- performance.measure records the delta between two marks
There are other User Timing APIs, but mark and measure are the main functions. Once your page is chock full of marks and measures, the question arises as to how to actually collect these metrics so you can track them. Thankfully, because User Timing is an official W3C specification, many metrics services automatically extract and report these custom metrics in their dashboards. This is true for SOASTA's mPulse, WebPageTest, and SpeedCurve.
Sample Custom Metrics
While the User Timing API is simple, it can sometimes be difficult to know where and when to capture these marks and measures. This is due to the complexity of the browser's inner workings, primarily the way that stylesheets and synchronous scripts block parsing and rendering. Let's look at a few examples of likely custom metrics to gain a better understanding.
A quick note about browser compatibility: User Timing is available in most browsers except Safari. In the examples below we use the native API, but in your live code you'll need to check for compatibility and either use a shim or wrapper. A good polyfill is available from Pat Meenan.
Example 1: stylesheets done blocking
Loading a stylesheet blocks the entire page from rendering. This is true in all browsers as well as for stylesheets that are loaded dynamically. Therefore, knowing when stylesheets are done blocking is a good metric for understanding why rendering might start later than desired. Here's sample code for capturing this custom metric:
<link rel="stylesheet" href="/sheet1.css">
<link rel="stylesheet" href="/sheet4.css">
<script>
performance.mark("stylesheets done blocking");
</script>
The key to this snippet is making sure that it's placed below all the stylesheet LINK tags in the page. That's a reasonable requirement since most stylesheets are listed at the top of the page. While simple in appearance, some complex performance know-how is behind this snippet:
- Inline scripts are not executed until all previous stylesheets are downloaded, parsed, and applied to the page. Therefore, placing the inline script after the LINK tags ensures that the mark is set after all the blocking CSS has been processed.
- It's possible that a stylesheet might include
@importwhich would pull in other stylesheets, for example, sheet1.css might cause sheet2.css and sheet3.css to be downloaded, parsed, and applied. Therefore, simply tracking a stylesheet's load time (with Resource Timing for example) isn't enough. Doing so would produce a measurement that was too short and underestimated the impact of stylesheet blocking.
In order to produce a good (fast) user experience, it's important to understand what might be blocking your web app's rendering. The likely culprits are stylesheets and synchronous scripts, but often it's hard to disambiguate which is responsible for delayed rendering. This "stylesheets done blocking" custom metric is handy because if rendering starts well after the "stylesheets done blocking" metric, then the investigation should focus on synchronous scripts, which leads to our next example.
Example 2: scripts done blocking
Synchronous scripts block rendering for all following DOM elements, so knowing when script blocking is finished is also important. Here's a snippet for capturing this measurement:
<script src="a.js"></script>
<script src="b.js" async></script>
<script>
performance.mark("scripts done blocking");
</script>
The inline script (which calls performance.mark) is guaranteed to execute after script a.js has been downloaded, parsed, and executed. On the other hand, the mark will be recorded before b.js is done loading because b.js has the async attribute. This behavior matches our goal of measuring script blocking because a.js blocks rendering, but b.js doesn't.
Capturing an accurate "scripts done blocking" metric is a bit more challenging than its stylesheet counterpart. The reason is that, similar to stylesheets, the User Timing mark must be placed below all synchronous scripts. This can be difficult since websites frequently sprinkle scripts throughout the page. If that's the case, the mark measurement may occur after earlier DOM elements have rendered, and thus it doesn't accurately measure when rendering starts.
Therefore, this example is only useful for pages that have their synchronous scripts in the HEAD. Even with this limitation, this custom metric can be very useful for pages that have large scripts where the blocking time is much longer than the download time due to parsing and execution. When looking at waterfalls for these types of pages, all the scripts finish downloading but there's still a long gap before rendering starts. With a "scripts done blocking" mark, it would be possible to identify long parse and execute times as the culprit for render blocking.
Example 3: fonts loaded
If your site uses custom fonts, it's important to know that some browsers won't render the text that use those fonts until after the font file is downloaded. In other browsers the text may be rendered in a system default font and then re-rendered ("flash"ed) when the custom font is loaded. Therefore, a "fonts loaded" custom metric would be valuable to indicate when text elements were rendered.
Currently, there is not an "onload" event for fonts. Nevertheless, there are techniques for observing fonts and determining when they load, for example, Font Loading Revisited with Font Events by Scott Jehl from the Filament Group as well as Web Font Loader used by Typekit and Google Fonts. You could use these to track when your fonts are done loading, and include a call to performance.mark to set the "fonts loaded" custom metric at that time.
Example 4: hero images
A "hero image" is often the most important element in the page when it comes to user experience. The Hero Image Custom Metrics article describes an innovative technique for measuring when images are rendered. The snippet looks like this:
<img src="hero.jpg" onload="performance.clearMarks('img displayed'); performance.mark('img displayed');">
<script>
performance.clearMarks("img displayed");
performance.mark("img displayed");
</script>
The innovation is to take the greater of the image onload mark and the inline script mark. This accurately captures when the image is actually rendered. The image onload mark reflects the render time when the image download takes longer than any blocking resources. The inline script mark reflects the render time when the image downloads quickly but blocking resources prevent it from being rendered. In many cases, the most critical content in a page involves images, so this snippet is useful for a wide variety of custom metrics.
Example 5: paragraph of text
Surprisingly, one of the most challenging custom metrics is determining when text is displayed. In addition to being blocked by stylesheets and synchronous scripts, text elements (P, SPAN, LI, DIV, etc.) can also be blocked from rendering if they use a custom font that takes a long time to download.
If the text element does not use a custom font, then the time at which it renders is captured by simply putting an inline script after the text element:
<p>This is the call to action text element.</p>
<script>
performance.mark("text displayed");
</script>
If the text element DOES use a custom font, then the render time is the maximum of the inline script's mark and the font loading mark (see previous example). The key here is to use a pattern similar to the hero image where we record the "text displayed" mark twice: once in the font-loading snippet and again in the inline script after the text element. Additionally, we clear any previous marks of the same name before setting the new mark, thus ensuring that we get the maximum of the two values which properly reflects when the text is displayed.
Example 6: Single Page Apps
One of the drawbacks of relying on page load time as a metric is that it doesn't measure user actions inside a single page app (SPA) where window.onload only fires once but the user might perform multiple actions, each of which should be measured. Custom metrics solve this problem, but it requires taking on the added responsibility of creating an appropriate start time.
In order to show some sample code, lets assume we have a SPA that has an "Update" button. When clicked, an XHR or JSON request is launched to fetch new data. That returned data is passed to the updateData() function which changes the DOM. Here's sample code that measures this SPA user action:
<input type=button value="Update" onclick="fetchData()">

<script>
function fetchData() {
    performance.clearMarks("start update");
    performance.mark("start update");

    // Do an XHR or JSON request that calls updateData() with the new data.
}

function updateData(data) {
    // Update the DOM with the new data.

    performance.clearMarks("finish update");
    performance.mark("finish update");
    perforance.measure("update data", "start update", "finish update");
}
</script>
Notice that the "start update" mark is the first JavaScript in the SPA action, and "finish update" is the last JavaScript executed in the SPA action. This ensures that the entire SPA action is measured, including downloading the XHR or JSON and updating the DOM. Also notice that we used performance.measure for this first time. That's because we want to get the delta relative to a start time other than navigationStart.
Custom Metrics in SpeedCurve
A big benefit of building custom metrics with User Timing is that many performance metric services automatically extract the User Timing marks and measures to show in your performance dashboards. WebPageTest does this, and since SpeedCurve is built on top of WebPageTest we do it as well.
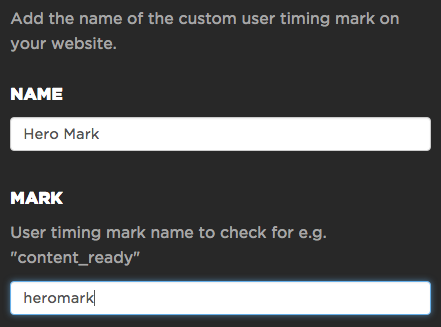
You can see your custom metrics in SpeedCurve by giving them a name in your Settings. In the speedcurve.com website, we use a custom metric called "heromark" to measure when the hero image (typically the chart at the top of the page) is displayed. We can give it a prettier name, "Hero Mark", using the form found under Settings:
You can add multiple custom metrics to SpeedCurve Settings. Since some pages contain dozens of marks and measures, including ones set by third party scripts, this step ensures that only the most important custom metrics are shown.
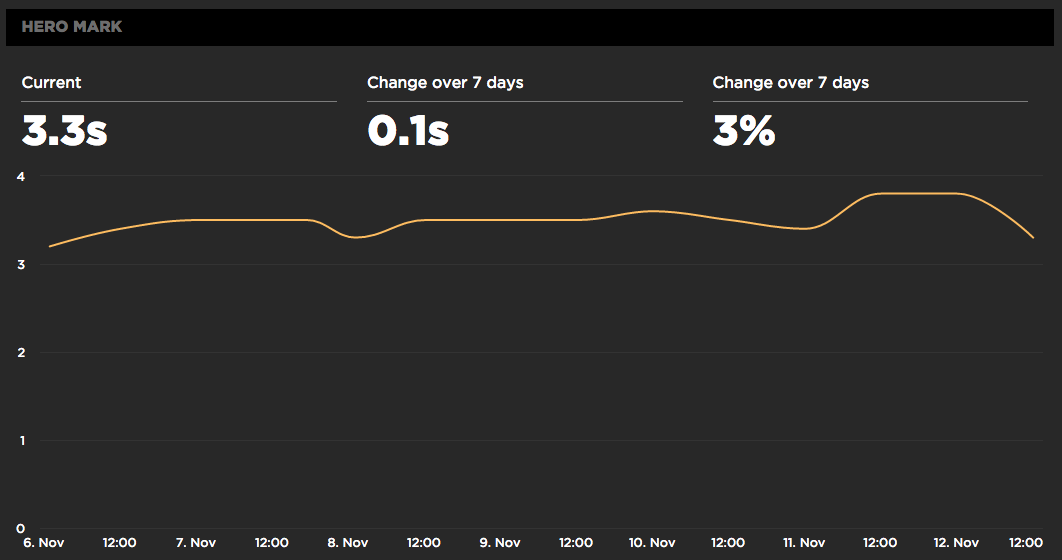
Custom metrics are visible on various SpeedCurve dashboards. For example, the Site dashboard shows a trendline of our "Hero Mark" custom metric over time.
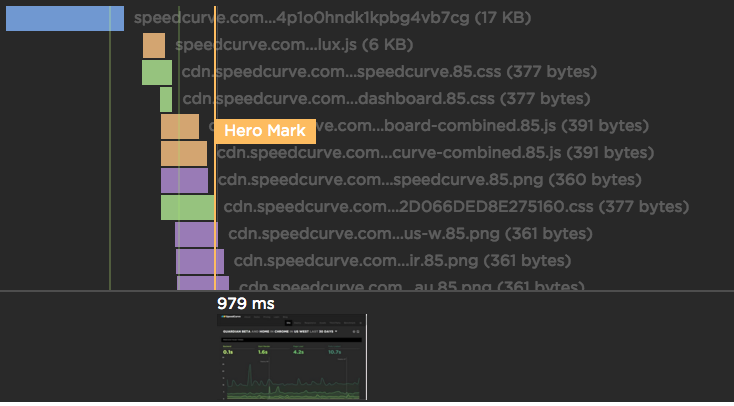
It's extremely valuable to see custom metrics on a waterfall chart. This allows you to "debug" if your custom metric is measuring the right thing. For example, in the waterfall below for speedcurve.com, we can see that the "Hero Mark" custom metric is blocked until all the preceding scripts (orange) and stylesheets (green) are done downloading. Using the thumbnails at the bottom confirms that this is when the hero image (the chart) actually gets displayed.
No one knows your website as well as you do. Therefore, it's important that you add custom metrics that measure the content that you and your users care about most. This allows you to track the speed of what your user's are experiencing in both synthetic and RUM.
If you're not already using SpeedCurve to create custom metrics and monitor your site's performance, set up your free trial here.