Hero Rendering Times: New metrics for measuring UX

The key to a good user experience is quickly delivering the content your visitors care about the most. This is easy to say, but tricky to do. Every site has unique content and user engagement goals, which is why measuring how fast critical content renders has historically been a challenging task.
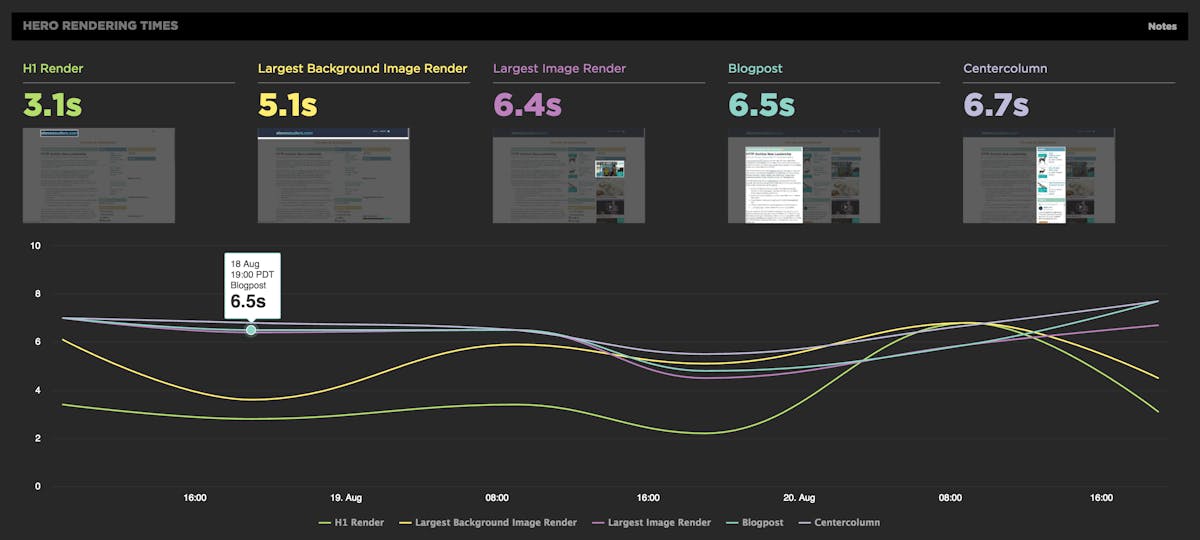
That's why we're very excited to introduce Hero Rendering Times, a set of new metrics for measuring the user experience. Hero Times measure when a page's most important content finishes rendering in the browser. These metrics are available right now to SpeedCurve users.
More on how Hero Rendering Times work further down in this post. But first, I want to give a bit of back story that explains how we got to here.
A brief history of UX metrics
In the beginning, there was load time. But then we realized that there was too much stuff on pages (e.g., third parties, outside-the-viewport content) that resulted in long load times, and these long load times didn't actually reflect how fast pages felt to users.
Start render is better than load time, because it measures when content starts to render – and when users can ostensibly begin to interact with the page. The other advantage is that it can be used in synthetic, so it's a good-enough way to compare the UX of your site to your competitors. But start render isn't ideal, because it only measures the beginning of content rendering, not when users can actually engage meaningfully with the page.
Then Speed Index came along. This metric, which is measured in WebPageTest, identifies when the visible parts of a page are displayed. This was a huge evolutionary leap in that it represented the first time any tool attempted to tackle the issue of measuring what users actually see. Speed Index is based on measuring when visual content (e.g., images and video) render within the viewport.
We like Speed Index (which is why we've included it in SpeedCurve), but because it's dependent on how the page is built, it's not a one-size-fits-all metric. For example, I recently spoke with a customer who was getting confusing Speed Index results for mobile. It turned out that the reason why their Speed Index was fast – despite the fact that their viewport was almost empty – was because most of their "above the fold" content was not image-based.
Recently, metrics like Time to Interact (TTI) and Time to First Meaningful Paint (TTFMP) have gotten a lot of attention. But TTI doesn't consistently and accurately measure user experience. And while TTFMP – which is available through the new Paint Timing API – does illustrate when content becomes visible in the browser, its weakness is that, like Start Render and Speed Index, it gives equal value to every pixel. In other words, it doesn't discriminate between useful and non-useful content. (This is a hugely fascinating topic for discussion, which is why I'll be talking more about these metrics in an upcoming post.)
Custom metrics are a great solution (and they remain the best solution for real user monitoring), but they require additional dev time and expertise, which might be why only 14% of sites use them.
We need better metrics for measuring user experience
Given the constraints and limitations of existing metrics, we realized we need a solution that:
- Correlates to what users actually see in the browser.
- Recognizes that not all pixels and page elements are equal, from a user's perspective.
- Allows us to customize what we measure on specific pages.
- Is easy to use and accessible right out of the box.
Introducing Hero Rendering Times
Here's the great news: You don't have to do anything at all to get started! If you're a SpeedCurve user, these core Hero Rendering Times are already sitting in your Sites dashboard. If you're not a SpeedCurve user, click on each of the images below to check out these metrics in our live demo dashboards.
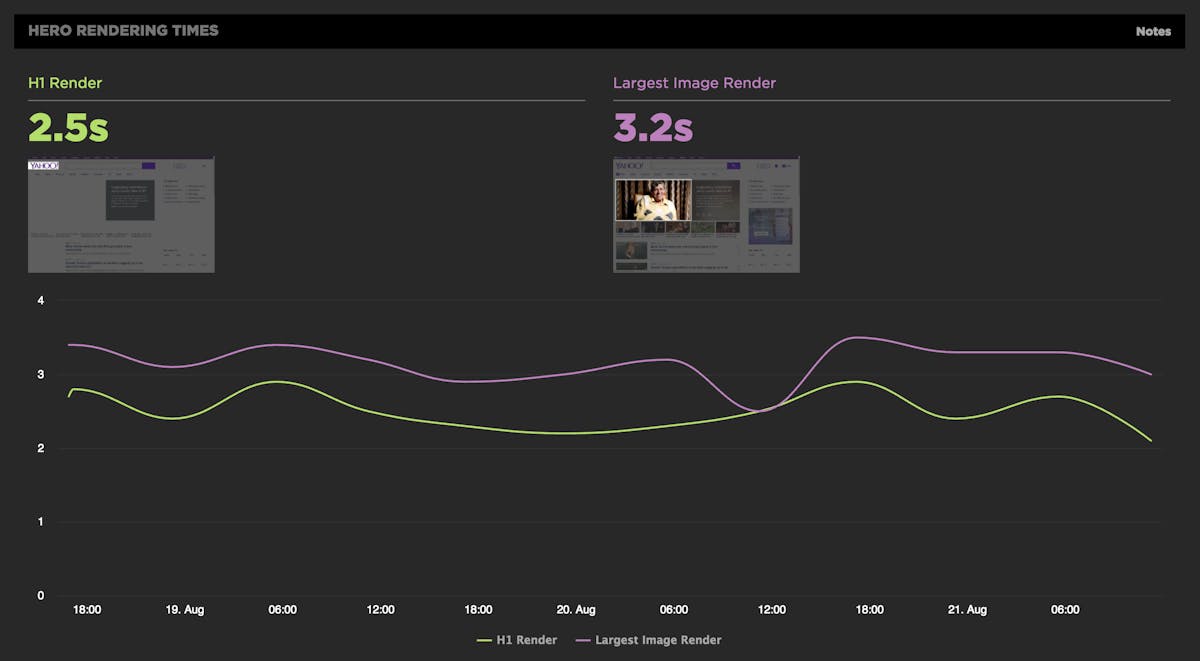
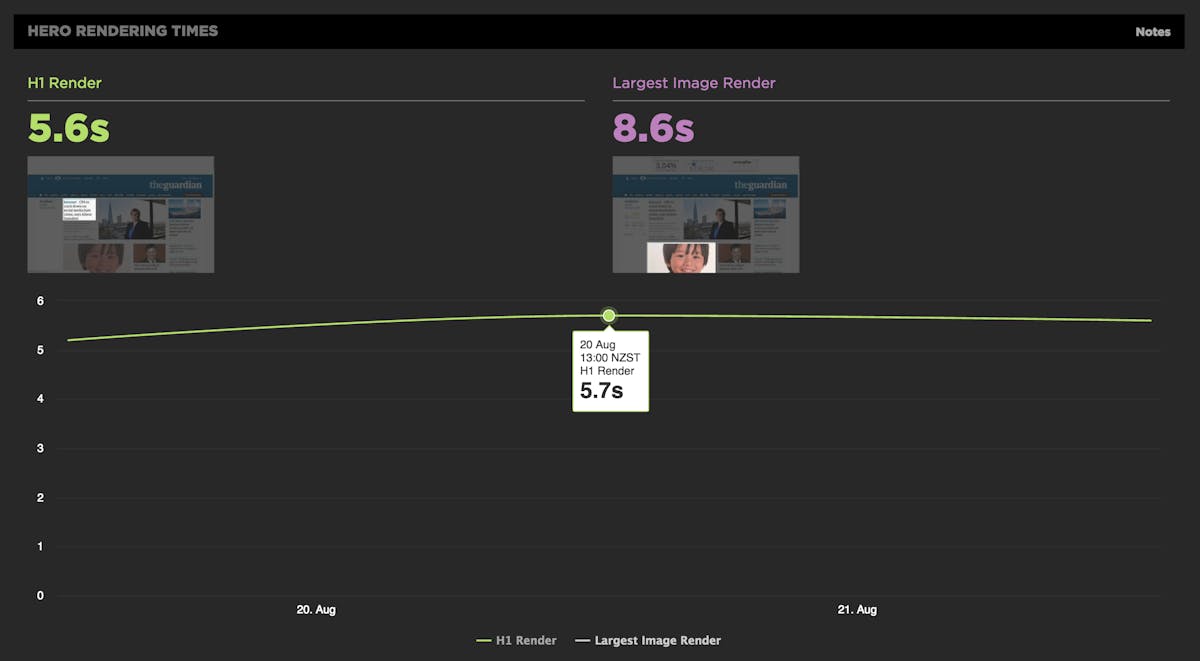
Largest Image Render
Just as its name suggests, Largest Image Render identifies when the largest image in the viewport finishes rendering. This metric is especially relevant to retail sites, where images on home, product, and campaign landing pages are critical elements.
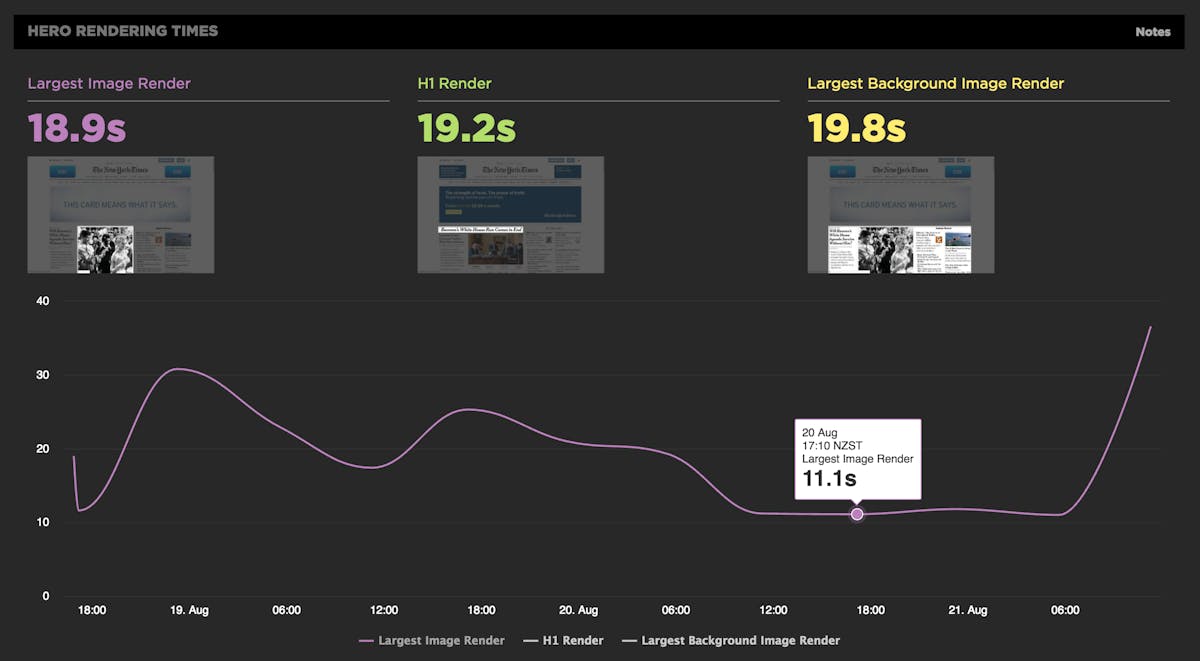
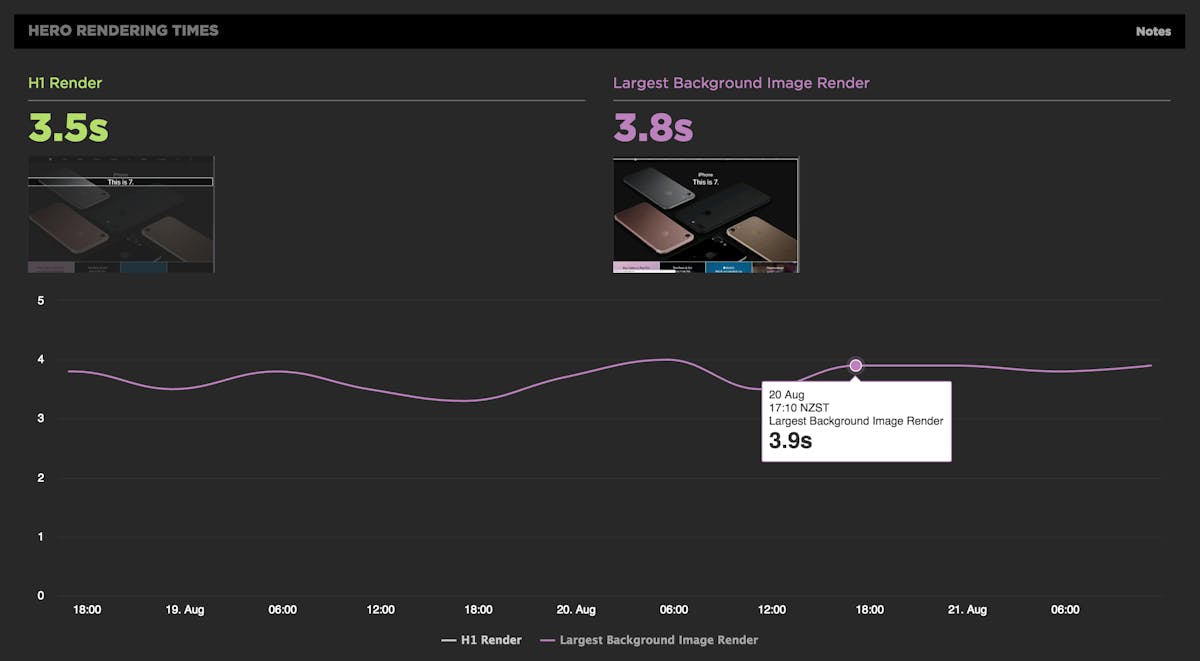
H1 Render
H1 Render measures when your first H1 element finishes rendering. This metric is especially useful to media and informational sites. Because the H1 tag is usually wrapped around header copy, there's a reasonable assumption that this is copy you want your users to see quickly.
>> Case study: How NerdWallet used H1 Render Time to help improve font loading by up to 30%
Largest Background Image Render
For some pages, the background image is just as – or more – important than the largest image. We created this metric to ensure that you're not missing out.
These core hero metrics are a great start, and they're now available by default in SpeedCurve. We've also created one more Hero Rendering Time that requires a bit more work on your end, but which will allow you to fine-tune your monitoring...
Hero Element Timing
Default metrics are important to have – not least because they're based on universal page elements, which means you can use them to compare your site to your competitors. But chances are you want to get a more nuanced look at hero elements that are unique to your site, your pages, and your users. This is where Hero Element Timing comes in.
Hero Element Timing – which is based on the Hero Element Timing API – lets you select and annotate specific hero elements on your pages, such as search boxes, image carousels, and blocks of text.
Right now, if you're a SpeedCurve user, you can follow the instructions in the API spec to annotate your pages, and see the results in your SpeedCurve results. (As a bonus, when browsers inevitably catch up and adopt the spec, you'll be ahead of the game.)
Get started
That's it! Login to your SpeedCurve account to check out your core Hero Rendering Times and start exploring Hero Element Timing. If you're not already using SpeedCurve, sign up for a free trial.
If you have any questions or feedback about Hero Rendering Times, we'd love to hear them.