An analysis of Chromium's paint timing metrics

Here at SpeedCurve, we are continually gathering detailed performance data from tens of thousands of web pages. This gives us a relatively unique opportunity to analyse and aggregate performance metrics to gain some interesting insights. In this post, I'm going to analyse some browser-based paint timing metrics: First Paint & First Contentful Paint (defined in the Paint Timing spec and implemented in Chromium). I'm also going to analyse First Meaningful Paint (defined in a draft spec and implemented as a Chromium trace metric).
What are paint timing metrics?
The aim of almost any performance optimisation on the web is to improve the user experience. The folk at Google have been pushing this sentiment with a focus on user-centric performance metrics, which aim to answer four questions about users’ experiences:
- Is it happening? Is the page that I want to see actually loading?
- Is it useful? Has enough content rendered that I can engage with it?
- Is it usable? Can I scroll and interact with the page, or is it still loading?
- Is it delightful? Are my interactions with the page smooth?
First Paint (FP) measures the point at which pixels are first rendered to the screen after navigating to a new page. First Contentful Paint (FCP) is slightly more specific, in that it measures the point at which text or graphics are first rendered to the screen. Both of these metrics are available in Chromium browsers (Chrome, Opera, Samsung Internet, etc) via the Performance API: performance.getEntriesByType('paint').
The paint timing metrics are important because they aim to answer the first question: is it happening? My analysis will look at performance data from some popular websites in an attempt to figure out whether the paint timing metrics really do answer that question.
What makes a metric useful?
If paint timing metrics accurately reflect users’ experiences, then we can use that information in real user monitoring (RUM) to gain insights into how web pages perform in the real world. Since these metrics are supposed to answer the question is it happening? then doesn’t that make them useful by default? Well, maybe not. There’s an important caveat that is mentioned in the Paint Timing spec:
The rendering pipeline is very complex, and the timestamp should be the latest timestamp the browser is able to note in this pipeline (best effort). Typically the time at which the frame is submitted to the OS for display is recommended for this API.
Even once the operating system gets hold of a frame, there can be a noticeable delay before that frame is actually rendered to the screen. So when we use a browser’s paint metrics, we have to deal with the possibility that they do not accurately represent when a user actually sees anything on their screen.
It just so happens that we can test the accuracy of the paint timing metrics by comparing them to the Start Render metric in WebPageTest. WebPageTest loads a web page in a real web browser and captures a video of the screen as the page loads. It calculates the Start Render time by performing a frame-by-frame comparison to find the point at which the first pixels are rendered to the screen. This means that Start Render represents when a user would actually see the pixels, accurate to within 16.6667ms (the frame duration for a video captured at 60 fps).
Before I continue, it's important to note that while First Paint is analogous to Start Render, First Contentful Paint by definition is not. However, I’ve chosen to include FCP in this analysis anyway, because I think the data is quite interesting.
Doing the analysis
Under the hood, SpeedCurve uses WebPageTest to run performance tests, which means we have access to plenty of data that will enable us to compare the browser's paint metrics to WebPageTest's Start Render. I collated data from one of our test accounts that routinely runs performance tests on 40 of the Alexa top sites, and performed some basic statistical analysis on it. This data, along with the code that I used to perform the analysis are both available on GitHub.
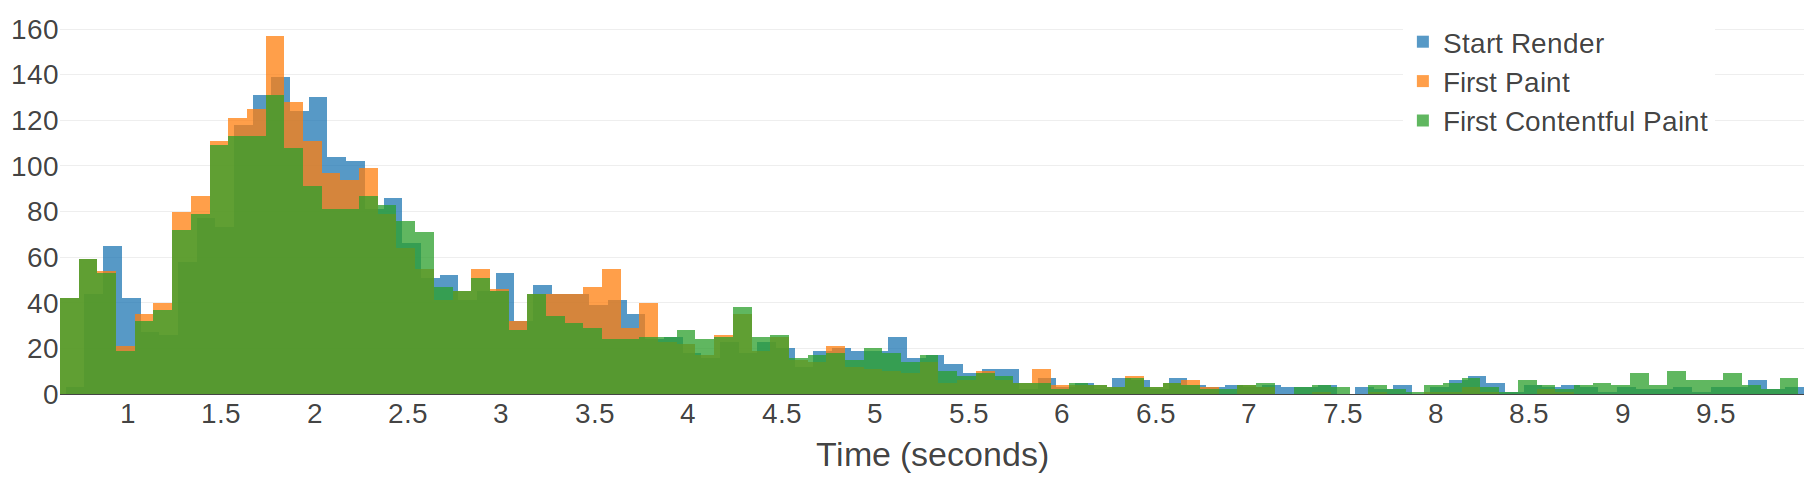
The main question I have about the paint metrics is how much do they differ from Start Render? To answer this, I calculated how different First Paint and First Contentful Paint are from Start Render in every test result (FP − SR and FCP − SR) Then I plotted this data as a histogram. Let’s take a look.
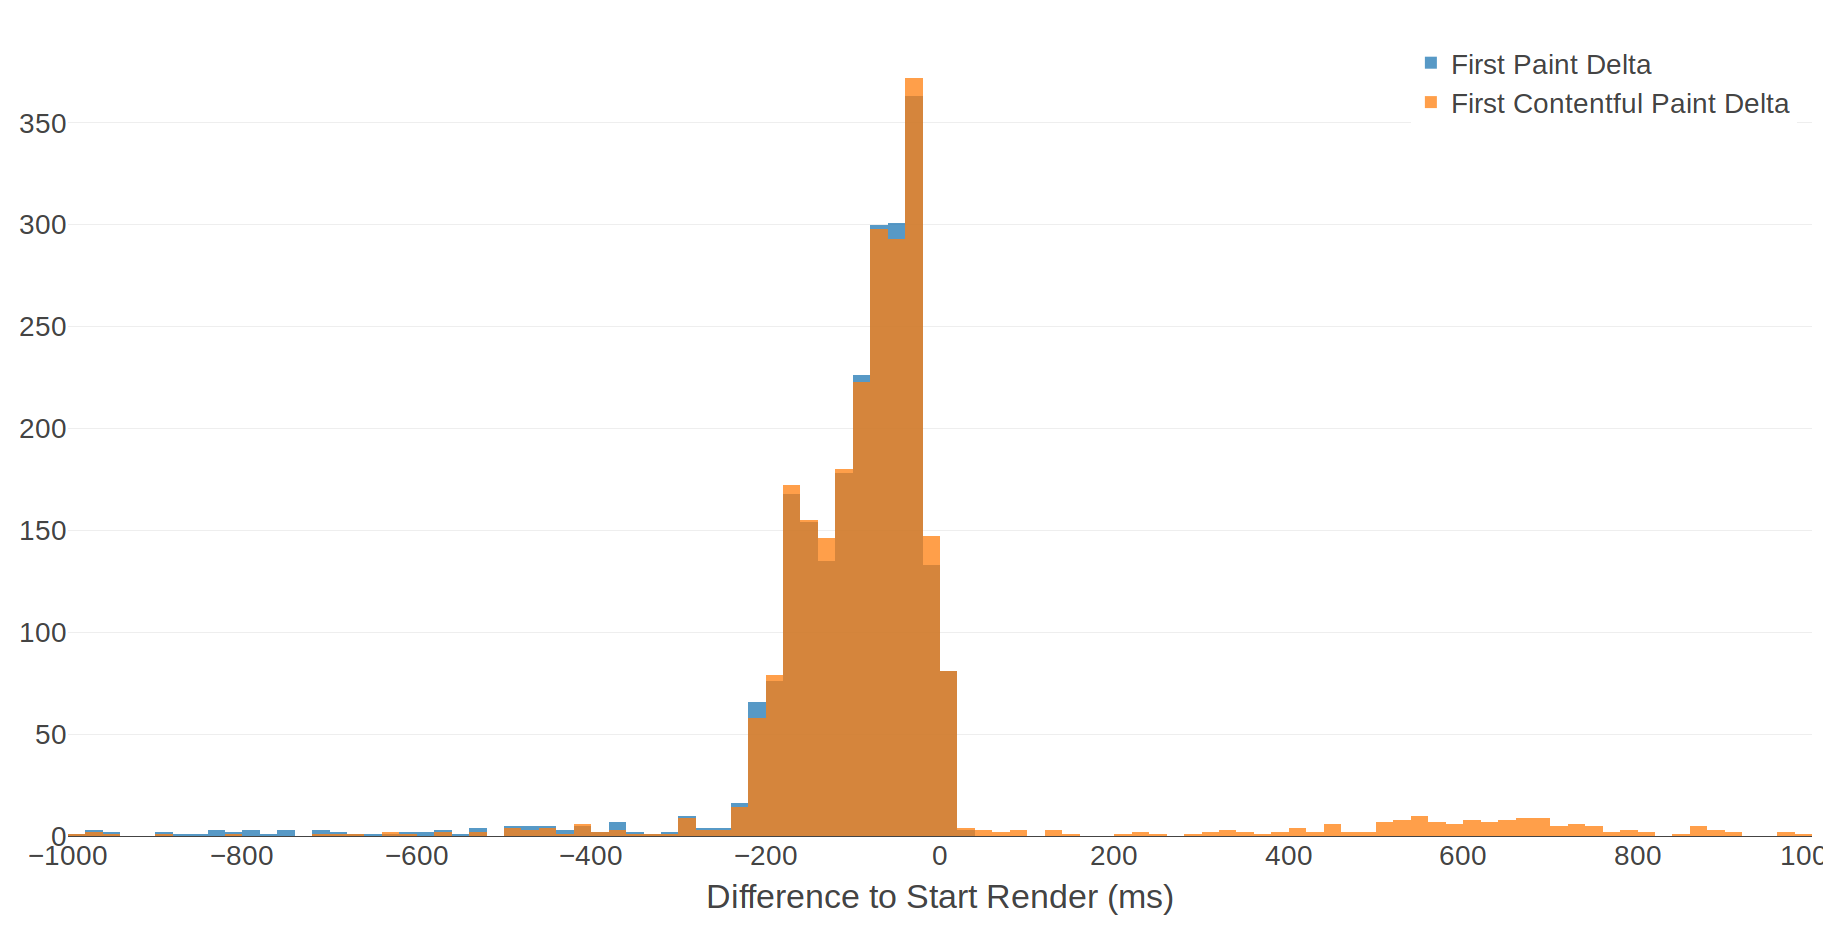
In case you're not familiar with histograms, here's how you can interpret this chart:
- The X-Axis is how many milliseconds different each metric is to Start Render. A negative value means that the metric occurred before Start Render. Each bar on the X-Axis is a 20ms bucket.
- The Y-Axis is the number of tests whose metric falls into each bucket. For example there are 372 tests for which First Contentful Paint happened between -40ms and -21ms before Start Render.
The first thing I notice about this histogram is how it shows that more often than not, the paint timing metrics occur before Start Render. To put this another way: more often than not, FP and FCP are recorded before anything is rendered to the screen. That's an interesting discovery, although it's not entirely unexpected given the "complex rendering pipeline" caveat.
We can extract some human-friendly conclusions from this data by calculating some percentiles:
- 95% of FP and 85% of FCP events occur before Start Render.
- 50% of FP and FCP events occur within 90ms of Start Render.
- 80% of FP and FCP events occur within 200ms of Start Render.
Since this data comes from pages with varying load times, it might be more useful to view the deltas as a percentage of Start Render time:
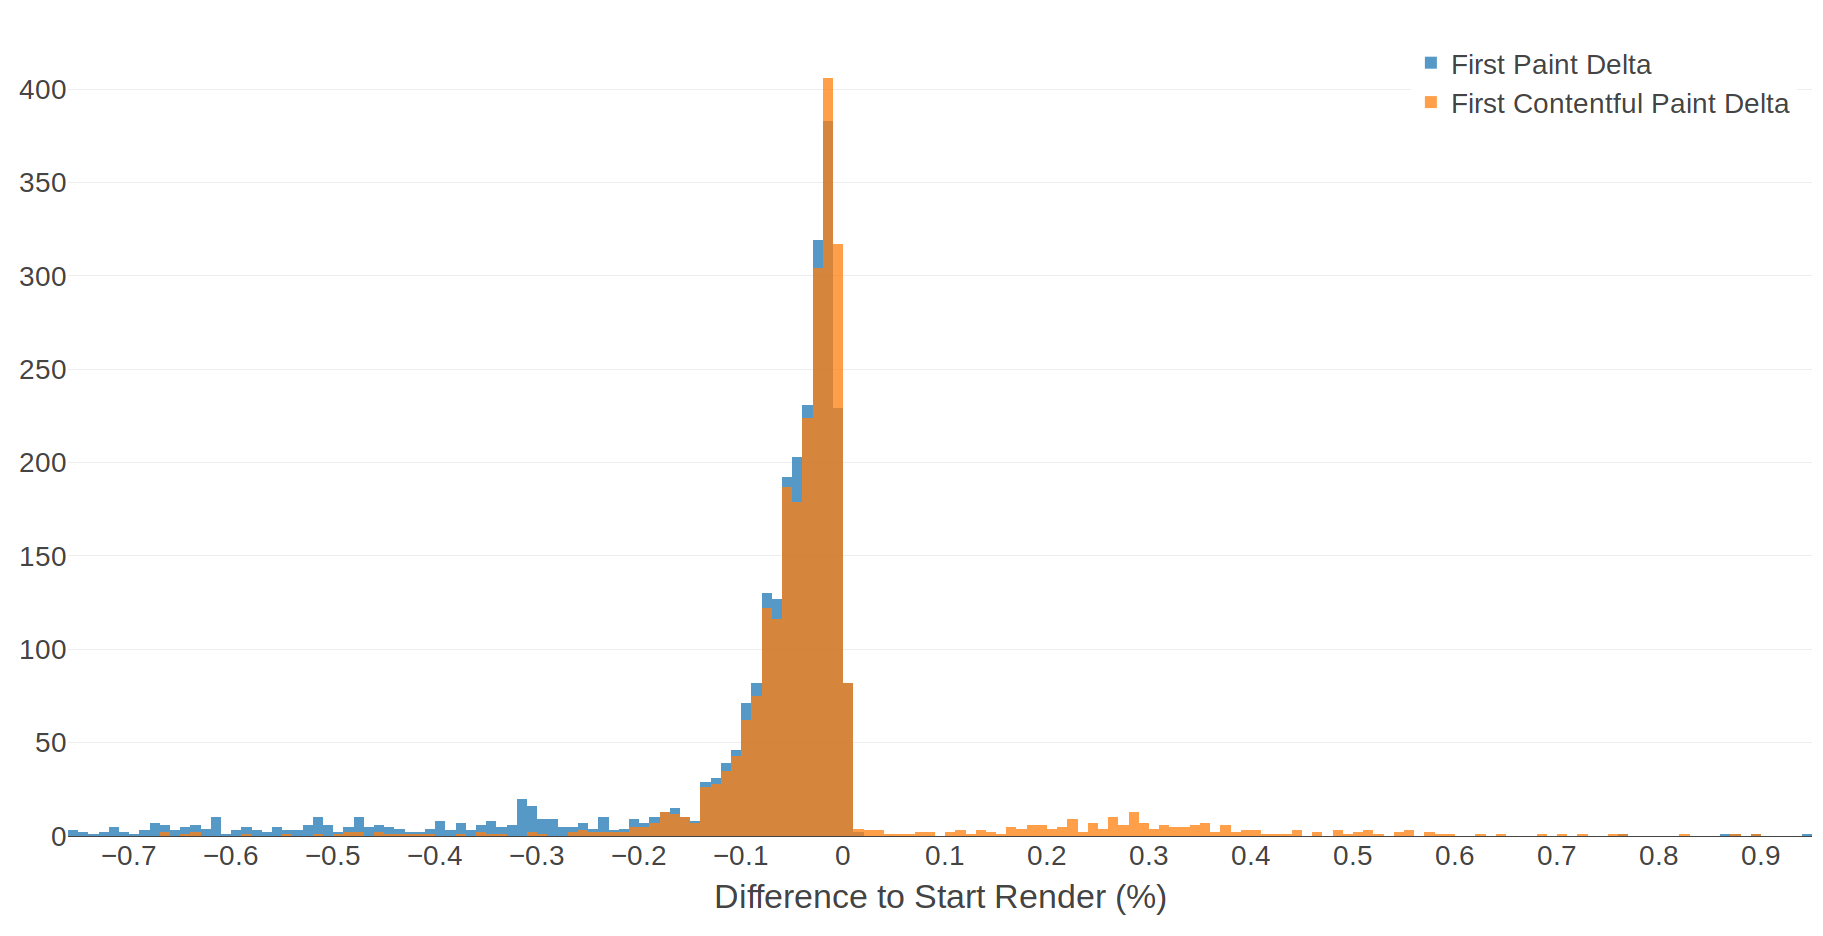
The shape of the histogram hasn't changed too much, but this time we have a slightly more useful scale and we can see that in most cases the paint timing metrics occur within 10% of Start Render. Some human-friendly conclusions from this data:
- 50% of FP and FCP events occur within 4% of Start Render.
- 80% of FP and FCP events occur within 10% of Start Render.
Put in this context, the difference between the paint timing metrics and Start Render seems much more reasonable.
What to make of these numbers?
If we can accept that 10% is a reasonable margin of error, then this data tells us that 80% of FP and FCP times are a reasonably accurate representation of when the first pixels are rendered to the user's screen.
What about the remaining 20% of page loads?
The FP values that fall outside of our 10% margin of error are all before the Start Render time, which means that they represent a point in time when the screen is still blank. The outlying FCP values, on the other hand, are mostly after the Start Render time. I would guess this is where the contentful part of First Contentful Paint is having a positive effect. While these outliers don’t represent the first render, they at least represent a point in time where something has been rendered. It feels like this difference makes FCP a slightly more useful metric than FP, at least for representing when users see the first render on their screens.
What about First Meaningful Paint?
I said that I would also analyse First Meaningful Paint. Just like First Contentful Paint, FMP is intended to be a fundamentally different metric to Start Render. The "meaningful" part of First Meaningful Paint comes from a set of heuristics like the number of layout objects, page height, and web fonts. You would therefore expect FMP to occur much later than Start Render. Let's take a look at a histogram of the difference between Start Render and FP, FCP, and FMP.
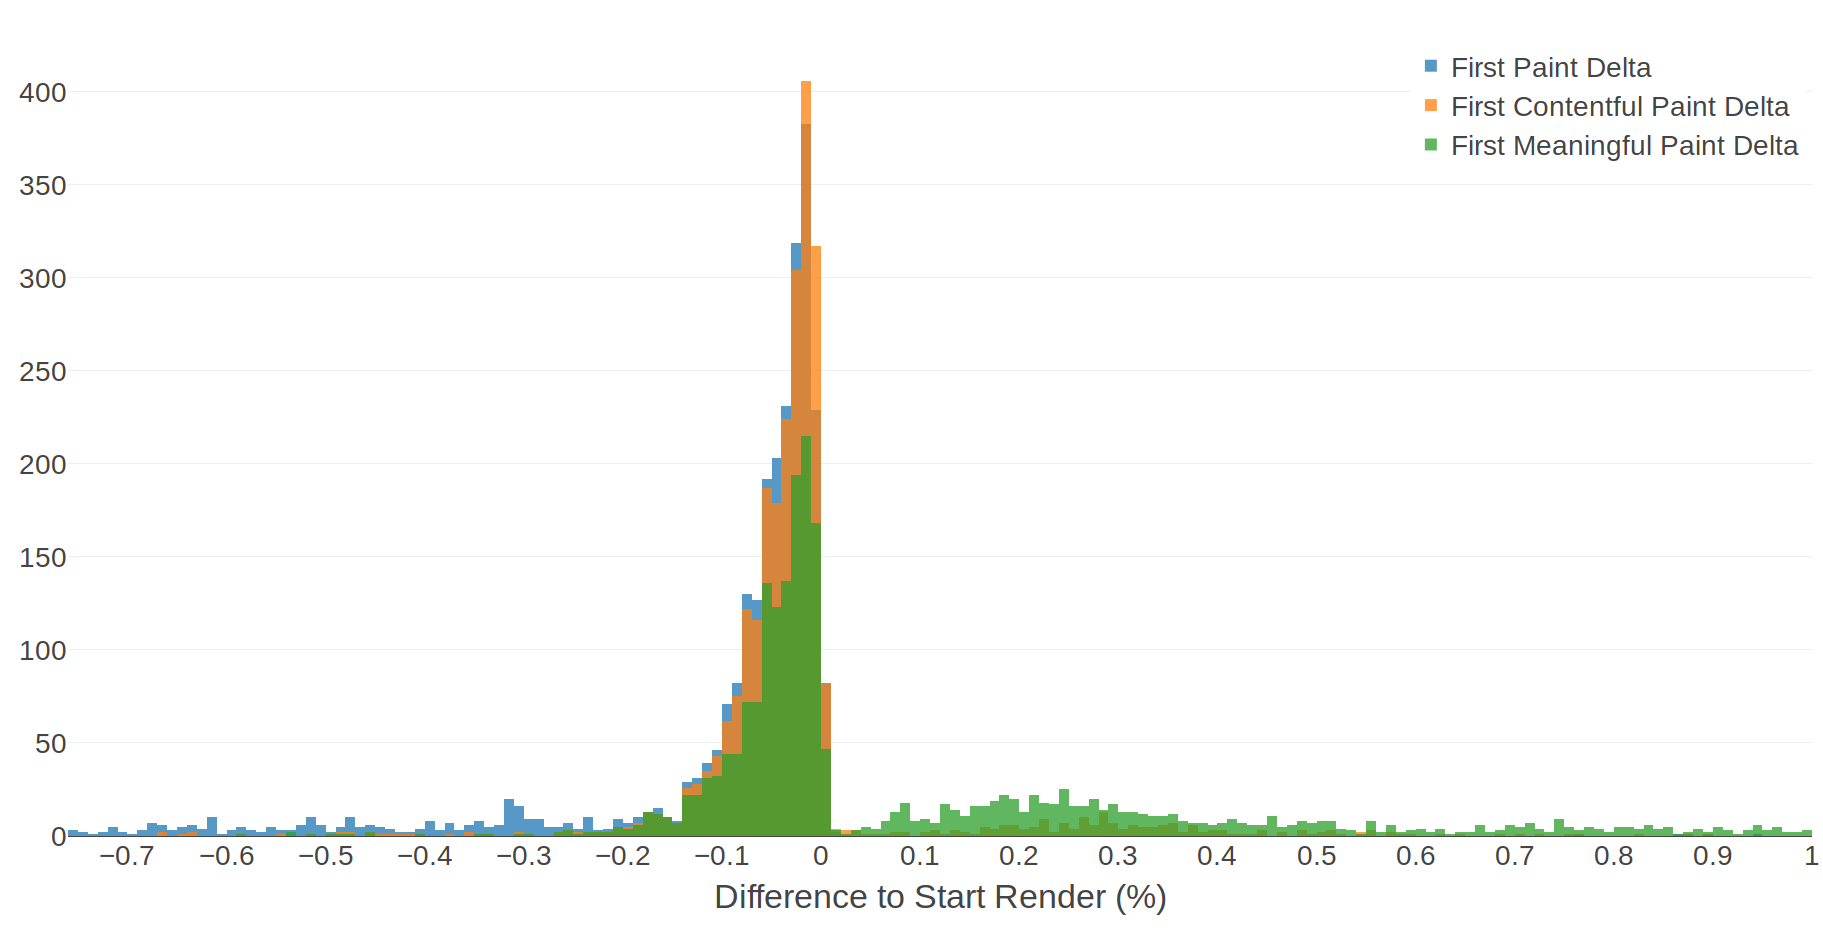
Somewhat surprisingly, FMP suffers from the same problem as the other two metrics in that it regularly occurs before Start Render. Thanks to its more advanced heuristics, FMP is much more likely to represent a point in time when there are actually pixels on the screen. There is one interesting human-readable conclusion that comes out of this data:
- 50% of FMP events occur before Start Render.
Key findings
There are a few key findings that stand out from this analysis:
- Paint timing metrics are too optimistic. In 85-95% of cases, they are recorded before any pixels are actually rendered to the screen.
- First Meaningful Paint, while being an improvement over the other metrics, still suffers from the "complex rendering pipeline" issue, and half of all FMP events occur before any pixels have actually been rendered to the screen.
- If you want a metric that truly represents what users are seeing on their screens, you are limited to synthetic testing tools like WebPageTest that capture a video of the screen as the page is being loaded. For real user monitoring (RUM), you are probably still better off using your own custom metrics to measure the most meaningful parts of your page load.
As a final disclaimer: it’s important to keep in mind that I analysed a small amount of data from a small sample of web pages. Modern web pages are extremely complex and very rarely do two pages render in the same way. You should always use data from your own web pages to decide which metrics best represent the experience of users of your pages.