Measuring the User Experience

SpeedCurve’s sweet spot is the intersection of design and performance - where the user experience lives. Other monitoring services focus on network behavior and the mechanics of the browser. Yet users rarely complain that “the DNS lookups are too slow” or “the load event fired late”. Instead, users get frustrated when they have to wait for the content they care about to appear on the screen.
The key to a good user experience is quickly delivering the critical content.
SpeedCurve helps you do this by focusing on metrics that reflect what the user actually experiences. For web pages, this comes down to when the content gets rendered. In last month’s redesign, we added a new rendering chart. Here’s an example of Smashing’s rendering chart:
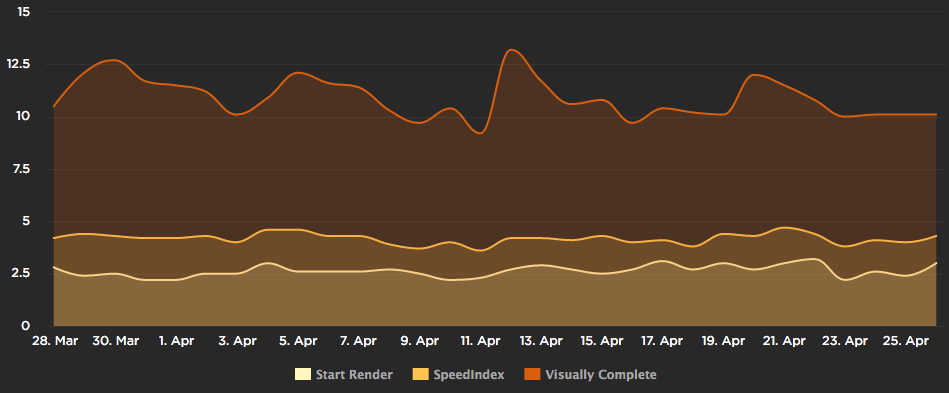
To emphasize the importance of rendering, we made this the first chart in the dashboard. The rendering chart includes metrics for Start Render, Speed Index, and Visually Complete. Start Render is the lower bound indicating render time for the first pixel. Visually complete bookends that with a metric for rendering the last pixel. Speed Index sits in-between showing the average render time across all pixels. (Many people were surprised to find out that Speed Index is “expressed in milliseconds”.)
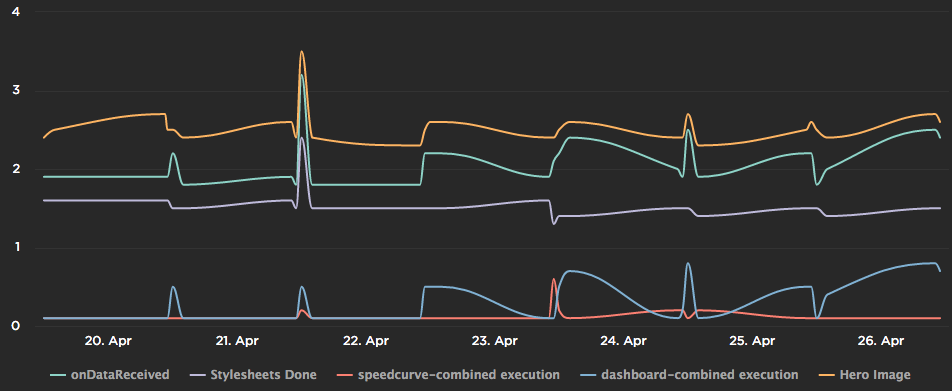
Rendering is important, but not all pixels have equal importance. Instead, most pages have critical design elements (e.g, the call-to-action or hero image). Knowing when this critical content is available is even more important than overall rendering metrics. Measuring critical content is done with Custom Metrics and the User Timing spec. We jazzed up the Custom Metrics chart as part of the recent redesign:
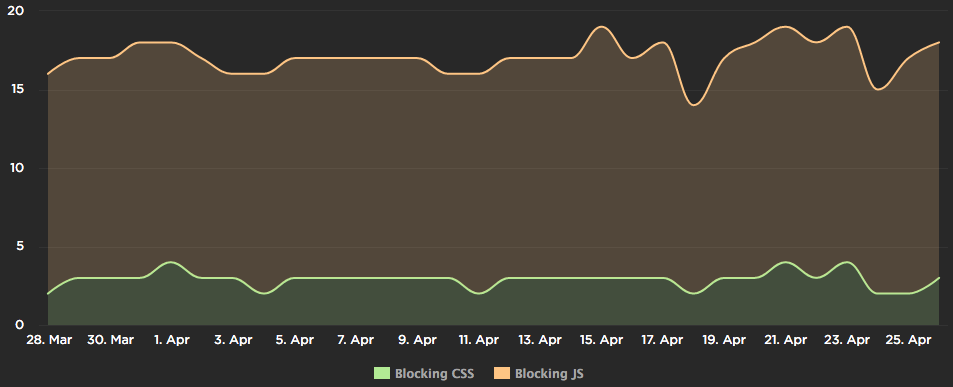
If rendering and critical content get slower, the first place to investigate is the number of critical blocking resources. Since it’s hard for developers to track changes in the number of blocking scripts and stylesheets across releases, we added that as a new metric in SpeedCurve. Here’s the chart of critical blocking resources for NY Times:
We’re excited to find such fertile ground for accelerating how our customers deliver their critical content to users. If you’d like to see these metrics for the user experience on your website, start a free trial today and give SpeedCurve a try.