New LUX metrics

Over the winter holiday we added a bunch of new metrics to LUX:
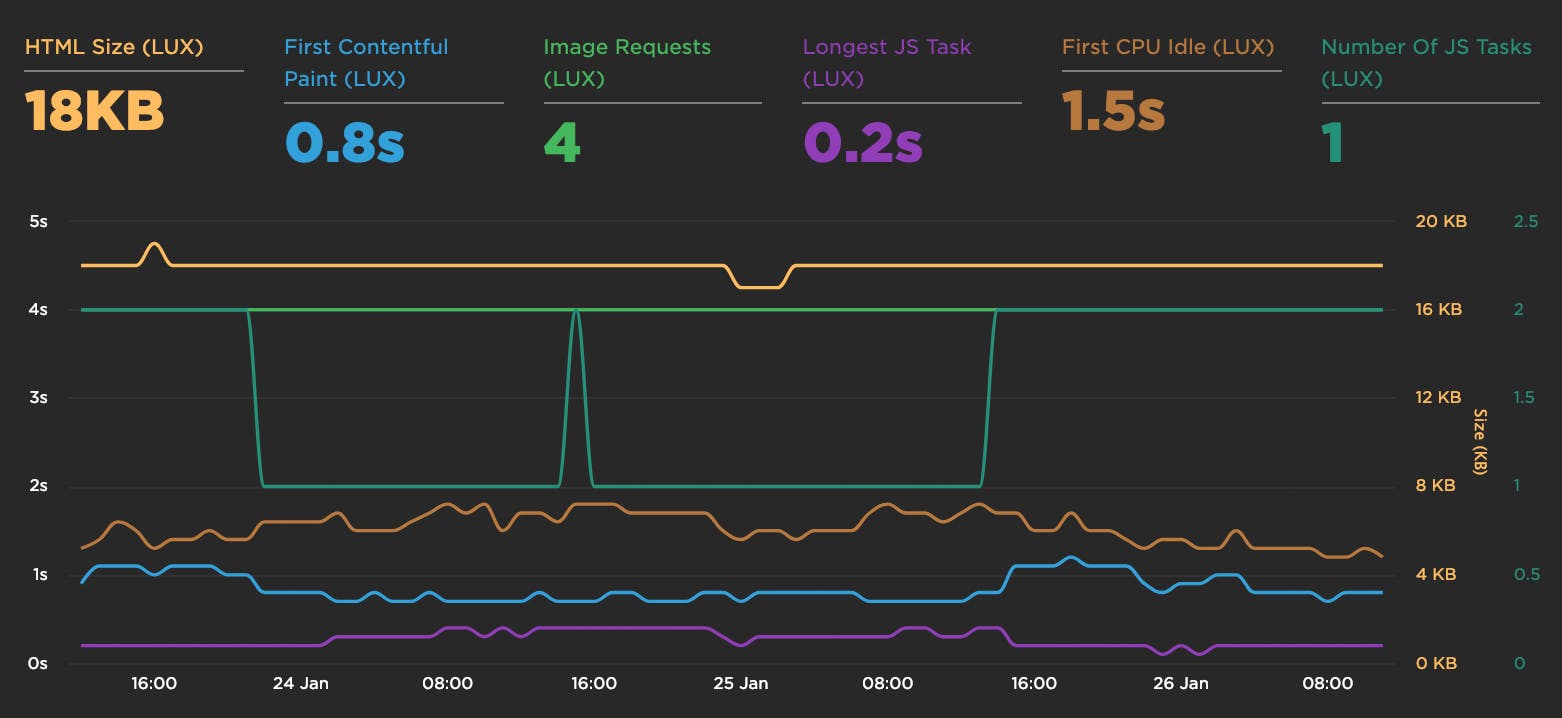
- First Contentful Paint
- First CPU Idle
- Longest Long Task
- Number of Long Tasks
- Connection type
- HTML transfer size
- Total # of image requests
We think it's important to focus on the user experience which translates into when content is rendered to the page. We added First Contentful Paint to provide more visibility into rendering. First Contentful Paint and Start Render (which was already available in LUX) are provided by browsers as part of the Paint Timing spec. It's the time at which users can start consuming page content. Specifically, it is "the time when the browser first rendered any text, image (including background images), non-white canvas or SVG." This can be found in the LUX Performance dashboard.
When it comes to creating a fast, joyous user experience, it's important to understand when the browser is blocked from rendering and accepting user input because the CPU is pegged. The Long Tasks API allows us to measure when JavaScript blocks the browser main thread for more than 50 milliseconds. In addition to viewing the total time of all Long Tasks, you can now see the longest Long Task and the median Long Task. You can see all these Long Task and CPU metrics in the LUX Performance dashboard.
The Chrome team aggregates the Long Task data into a metric called First CPU Idle. It's the first span of 5 seconds where the browser main thread is never blocked for more than 50ms after First Contentful Paint. When your site reaches First CPU Idle it's an indication that rendering isn't blocked and the user can interact without experiencing jank, so it's important to keep this metric as low as possible. You can also find this metric in the LUX Performance dashboard.
Segmenting real users by connection type lets you see what type of bandwidth your users have and how that correlates to performance. LUX gets this data from the Network Information API. LUX typically reports the effective connection type, which is calculated based on roundtrip network times and recently observed download times. A breakdown of your users based on connection type is available in the LUX Users dashboard, alongside existing regional, browser, and page breakdowns.
Finally, we had a customer request the transfer size of the main HTML document as a new metric, so we added that to the Favorites chart editor. We already reported the number of images above-the-fold, but added the total number of images. Viewing these metrics in the LUX Design dashboard allows you to see if lazy loading images below-the fold would help improve performance and reduce data costs.
If you're already a LUX customer, take a look at these new metrics. If you're not a LUX customer, signup now to start a free trial.