Performance improvement checklist for your whole site
One of the longest-standing items on my performance monitoring tool wishlist is an automatically-generated performance improvement checklist, with the improvements ordered by the impact that they will have on the website. In a previous life, I spent countless hours writing performance reports and conducting A/B performance tests to figure out which change would have the biggest impact on a website's performance.
So I'm understandably very excited that today we're announcing the new Improve dashboard – a prioritised performance improvement checklist that aggregates Lighthouse and Google PageSpeed results across all the URLs in your site to identify the most impactful performance changes you can make.

Why we created the Improve dashboard
Since we added the ability to view Lighthouse scores in your test results, we realised that there needs to be an easier way to view these scores as an aggregate across all of your tests. While you could already plot the average scores in your Favorites charts, there wasn't a way to aggregate the individual audits that make up these scores – until now.
The Improve dashboard combines the Lighthouse and PageSpeed audits for all of your latest test results, and shows you how each audit affects your different URLs.

How to use it
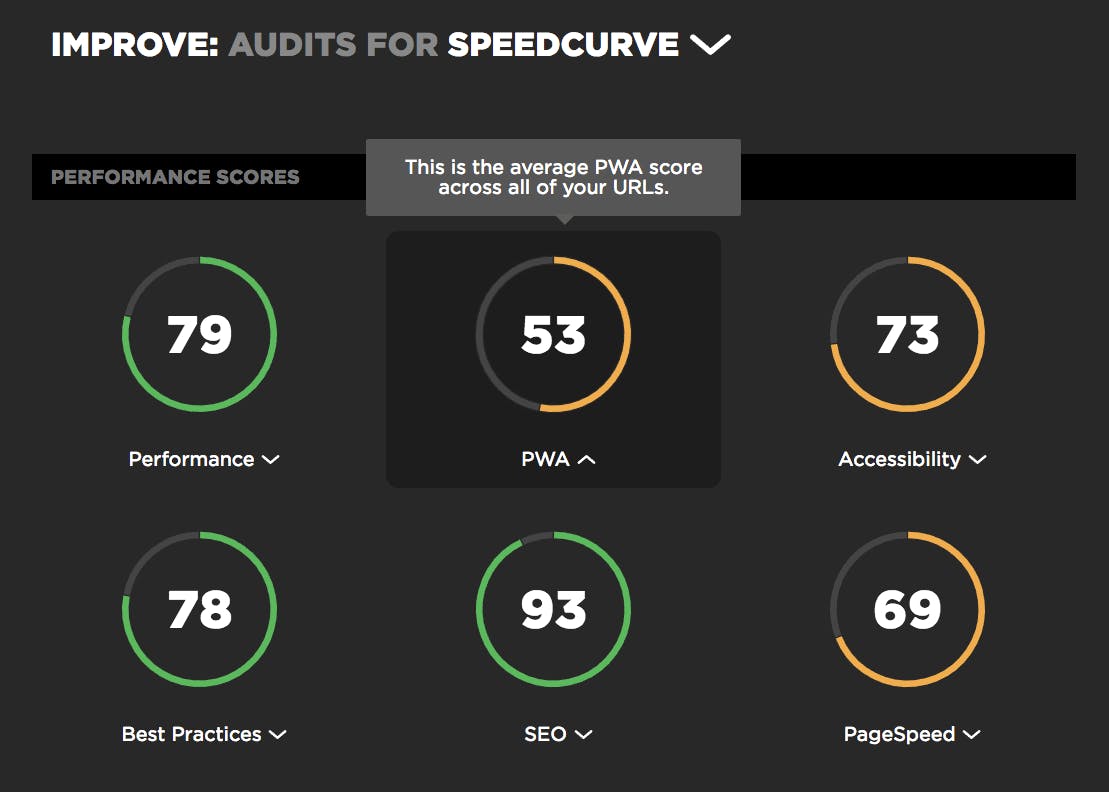
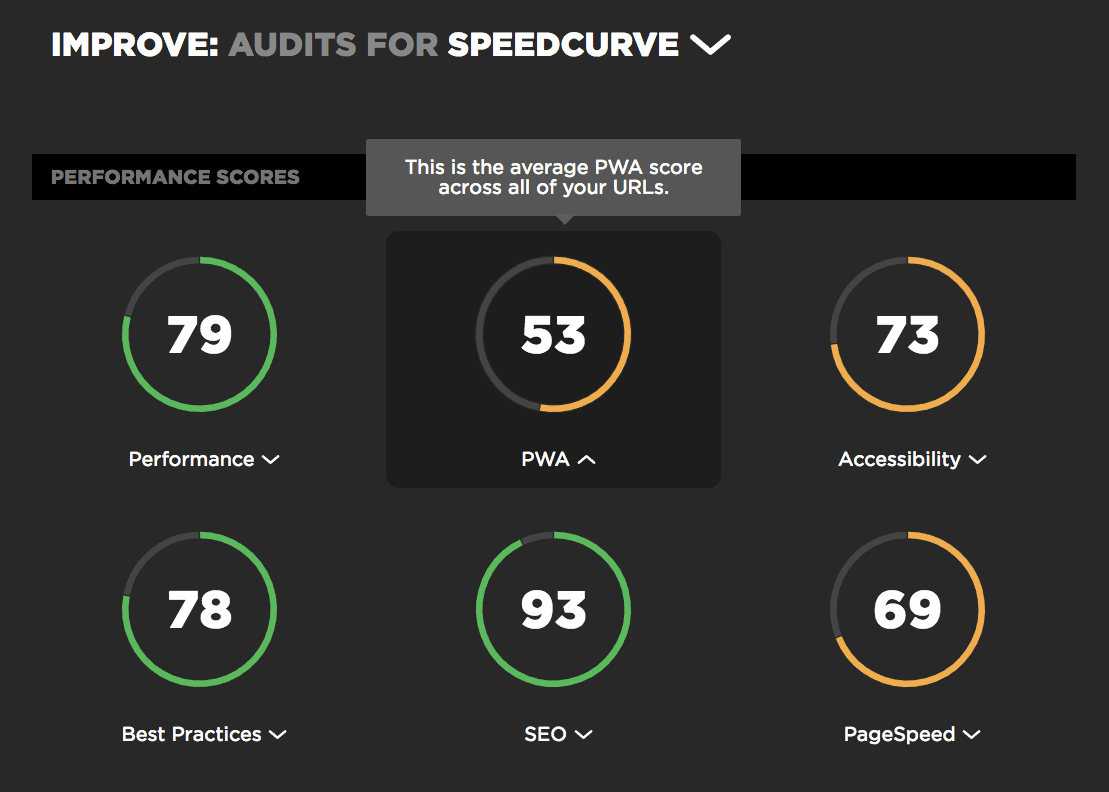
The Improve dashboard is available in the global left-hand navbar. The UI should look relatively familiar – it's the same UI that we use to display Lighthouse and PageSpeed scores on the test results page. Along the top you'll see the average scores across all of the URLs in your site.

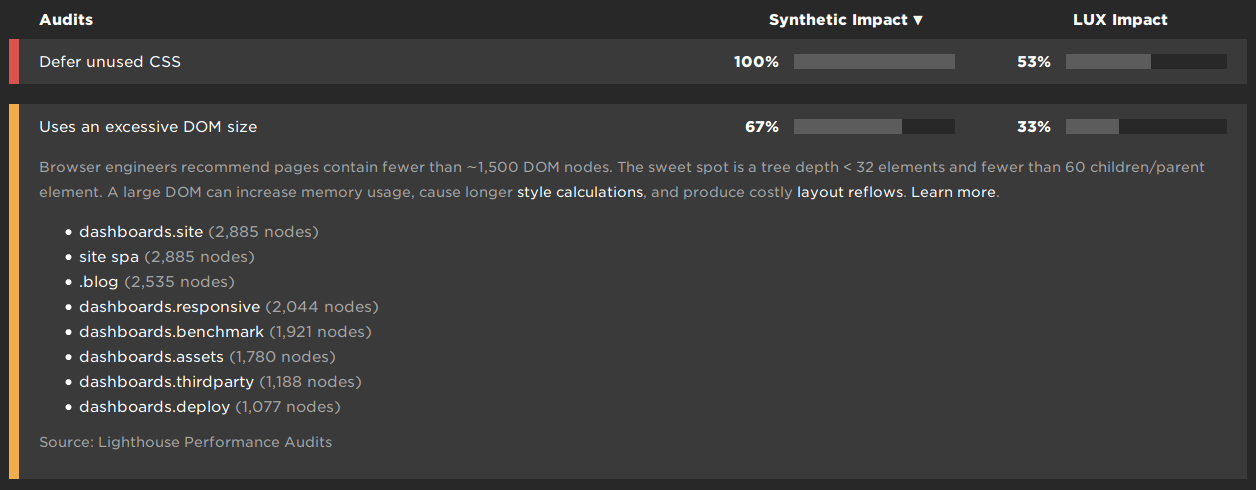
Below the score gauges, you'll see the individual audits for the selected score. To help you identify which audits are the most important, we give you a few ways to order them:
Order audits by their impact score
Audits can be ordered by their impact score, which is the average impact score across all of the URLs that are affected by the audit. This is the default audit order, because it helps you pick out which changes are deemed most important by Lighthouse or PageSpeed.
Order audits by how many URLs they affect
You can also order audits by their Synthetic Impact, which is calculated as the percentage of your SpeedCurve URLs that are affected by each audit. This enables you to quickly pick out the performance improvements that will affect the greatest number of your pages.
Order audits by RUM page views
LUX is SpeedCurve's Real User Monitoring (RUM) product. If you're a LUX customer, you can order audits by their LUX Impact. This is calculated as the percentage of your LUX page views that the audited URLs account for. We're especially excited about this feature, because it enables you to pick out the audits that have the biggest impact on your users in the real world.
Don't forget about performance budgets!
Now is a great time to remind you that you can also set performance budgets on your aggregate Lighthouse scores. This is an ideal way to keep track of your scores and be notified when one of your pages brings the average score for your entire site down.
If you want a hand with setting up some performance budgets, check out our support article.

Getting started
We're really looking forward to seeing how you use the Improve dashboard to drive your day-to-day performance work. If you're a SpeedCurve user, you can dive in and start using this dashboard straight away. If you're not already a SpeedCurve user, we'd love to have you give us a try for free!


