How to create a healthy, happy performance culture

One of the best parts of my job is getting to talk to so many people from so many different companies about web performance. Every company is different, and I learn a ton from talking to each one. But one question that almost every person asks me – regardless of what industry they're in or the size of their organization – is this:
How can I create a stronger culture of web performance at my company?
Creating a performance culture means creating a feedback loop in your company or team that looks like this:
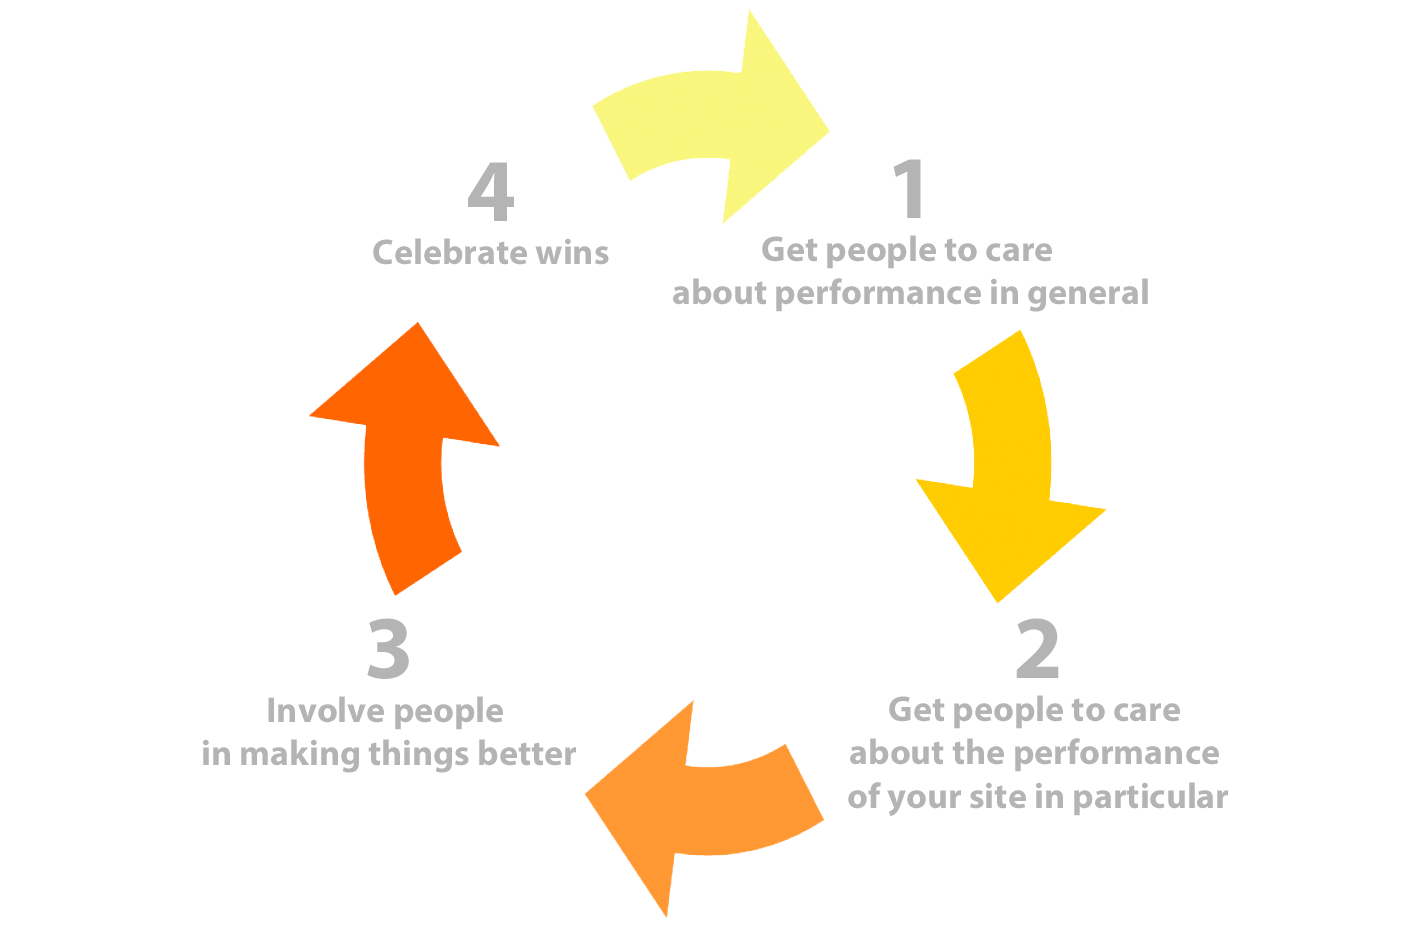
In other words: Get people to care, show them what they can do to help, and then give them positive reinforcement when you get results. It's basic human psychology, and it might seem obvious when you see it in a super-simple graphic. But it's surprisingly easy to miss these steps and instead skip ahead to the part where you invest in awesome performance tools, and then wonder why all your performance efforts feel like such a painful uphill slog.
In this post, I'm going to share some proven tips and best practices to help you create a healthy, happy, celebratory performance culture.
Side note: You'll notice that nowhere in that feedback loop does it say "Invest in whizbang performance tool [INSERT PRODUCT NAME HERE]." That's because these tips are about people, not tools. It goes without saying that you'll want to make sure you're using the right tools to monitor, measure, and optimize your site. But all the tools in the world won't make a difference if your people aren't invested in making a difference.
Identify what people care about
If you ask different people in your organization how much they care about performance today, you might just get a bunch of blank stares. But if you gave them a checklist and asked them to tick off any of the following boxes of things they care about, you'd probably get a more enthusiastic response:
- bounce rate
- cart size
- conversions
- revenue
- time on site
- page views
- search traffic
- user satisfaction
- user retention
Over the years, I've learned that performance can be mapped to all of these metrics – and almost any other business metric you can think of. To hook different people on performance, you need to understand which metric motivates them.
For example, an executive might want to know the impact of performance improvements and slowdowns on conversions and overall revenue, while folks in your marketing team might focus on the impact of performance on everything from SEO to user engagement.
Once you know what people care about, connect the dots for them. Case studies are an awesome way to do this, which is why I've been helping curate WPOstats, a vendor-neutral directory of performance case studies. For example, if someone on your executive team cares about conversions and revenue, you can direct them to a set of studies that focus on the impact of performance on revenue and conversion rate. People on your marketing team probably care about traffic and engagement. And so on.
Case studies are a great way to convert performance skeptics. They're also a great way to get people fired up about making your site faster. When you learn, say, that Staples reduced its median load time by 1 second and saw a 10% increase in conversion rate, that's pretty compelling.
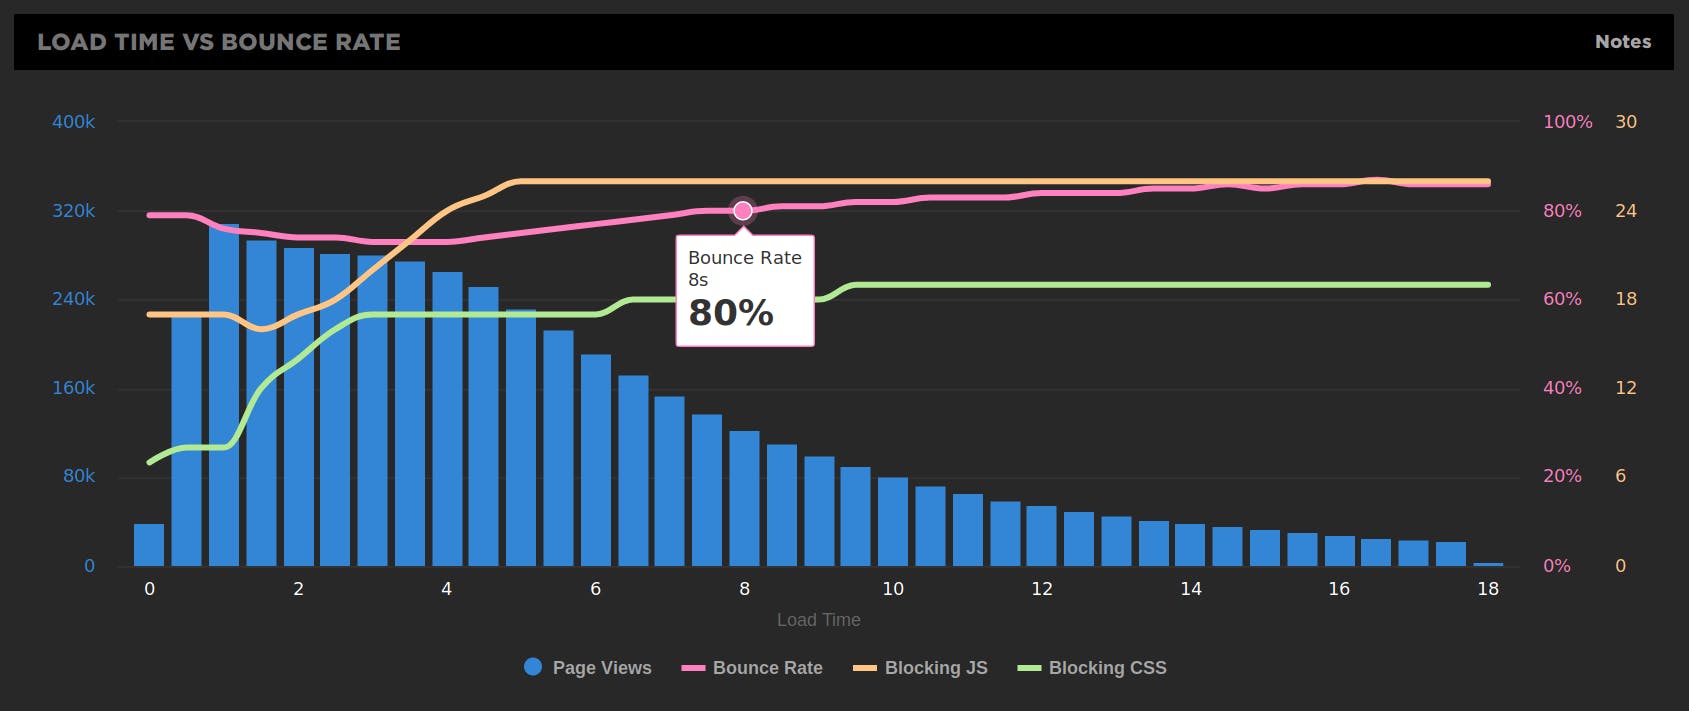
Case studies from other companies are compelling, but using your own data is even more compelling. If you're a SpeedCurve RUM user, the user engagement charts that are at the top of your Performance dashboard are an easy way to illustrate the correlation between performance and bounce rate using your own data. (One thing we've found is that almost everyone can relate to bounce rate as a meaningful metric.)
Fire up people's competitive spirit
One of the fastest routes to getting people to care about performance is to show them how slow their site is compared to their competitors. One of the great things about synthetic monitoring is that you can test any page on the web, not just your own. This lets you do great things like generate side-by-side filmstrips – and even better: videos – of your site alongside your competitors' sites (or any other aspirational sites).
Because SpeedCurve synthetic monitoring is built on top of WebPageTest, you can take advantage of WPT's filmstrip and video capabilities. Here's how to set up ongoing competitive benchmarking and generate comparison videos .
Make things visible (but not overwhelming)
If you want to see non-technical stakeholders' eyes glaze over, show them an endless series of dashboards and charts. Less is more should be your mantra. In the same way that you need to understand what motivates different people in your organization, you also need to tailor your reporting. You can start by creating separate dashboards for different stakeholders. Each dashboard should contain only the graphs that are relevant to that stakeholder group. For some people, your performance report might be just a single graph or a very simple dashboard that shows them the data points they care about. (It stands to reason that you should always be ready to go deeper upon request.)
One excellent practice that's used effectively by companies like Lonely Planet and Ticketmaster is to have monitors mounted in open areas of their offices, displaying key performance stats and comparison videos. Lara Hogan (previously director of engineering at Etsy) wrote a great blog post demonstrating how Etsy took advantage of the power of showing versus telling.
Collaborate on performance budgets
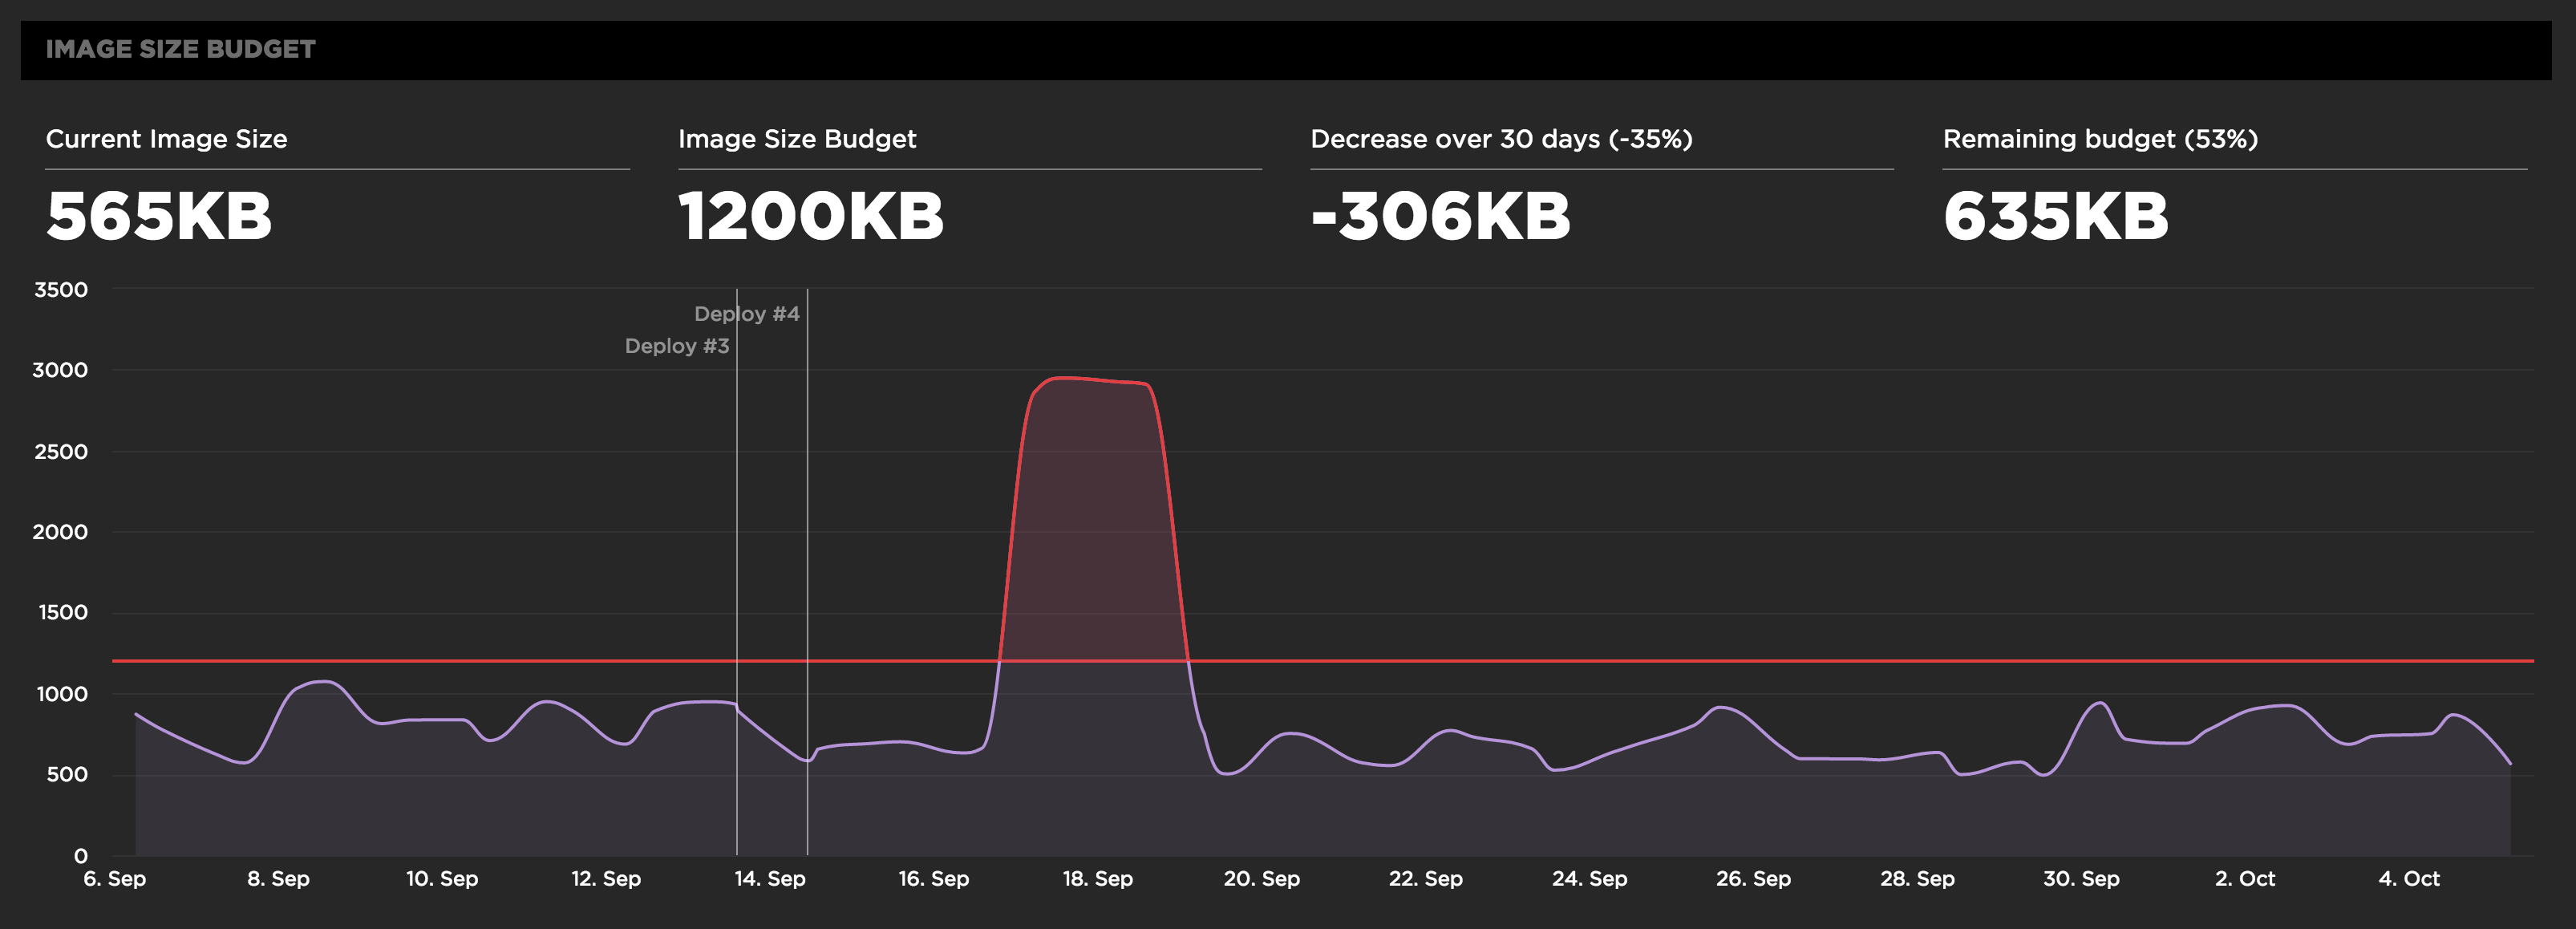
Performance budgets are an important tool for ensuring your site is delivering a great user experience. The practice of using budgets to track performance took off with this post by Tim Kadlec. The idea is to identify your performance goals, then track the metrics that help you achieve your goals. Setting performance budgets lets you focus on the metrics you care about most, create goals, set budgets based on those goals, and get alerts when your numbers go out of bounds.
As mentioned near the top of this post, there's no one-size-fits-all unicorn metric that will get everyone in your company excited about performance. This means there's no one-size-fits-all metric you should focus on for your performance budgets. Instead, your performance budgets can run a gamut that includes:
- Someone in ops needs to know Time to First Byte so that they can investigate back-end issues.
- One of your developers might care about start render or Speed Index, because they want to get a sense of how well the page is built – for instance, are there any blocking scripts or stylesheets.
- Someone in your marketing team wants to know how quickly the page delivers the most important content from a user's perspective, so they might want to track the rendering of hero images.
To make people accountable, give them ownership over their own performance budgets and make sure they receive alerts when their budgets are exceeded.
Super important: No sandbagging allowed. You wouldn't say you're going on a diet, then give yourself a limit of 3000 calories a day. In the same way, you want to keep your budgets realistic without making them overly forgiving. The point of a performance budget is to blend the aspirational with the achievable.
Case study: Here's how Zillow creates and enforces performance budgets
Score some easy wins
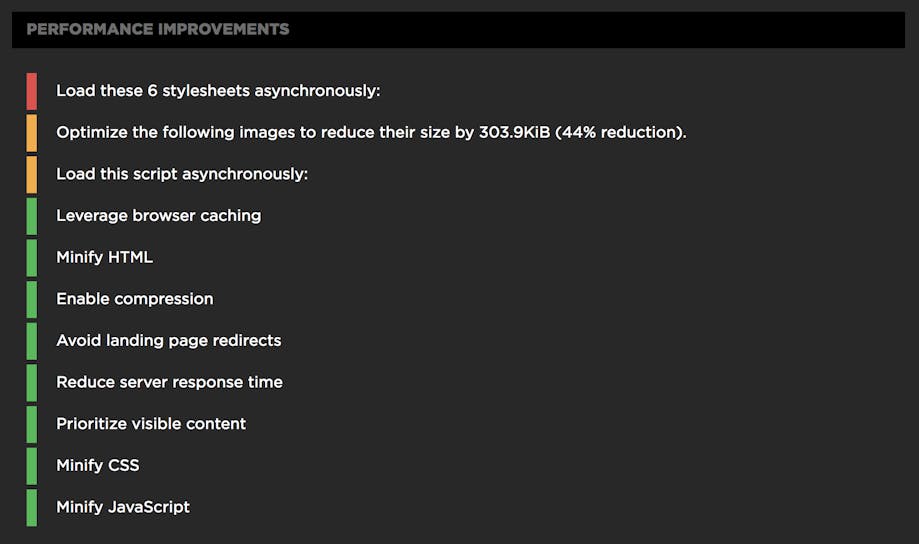
If you're new to performance – or if you're tackling a site that's new to you – there's a good chance there's some low-hanging fruit you can optimize. The first places to look are images and blocking stylesheets and scripts (especially third parties).
For example, the team at Fanatics.com did a one-month performance sprint where the most impactful changes they made were simple image optimizations: they improved image quality and compression, and they fixed an image sprite that was blocking pages from rendering. As a result, they saw a 2-second improvement in median load times and almost doubled their mobile conversions – a really big deal, since more than half their revenue comes from mobile. This relatively easy win was a fantastic way to get performance buy-in throughout their company.
With synthetic monitoring, you can drill down to find the most critical defects that are hurting specific pages. Pair that with real user monitoring, which lets you map performance to biz metrics like conversions.
Celebrate!
We live in a culture that doesn't celebrate success as much as it should. (Disclosure: I'm totally guilty of this.) So consider this a reminder: Every time you move the needle on performance – and that moves the needle on user engagement or revenue or whatever your company cares about – shout it from the rooftop. Or if that's not allowed at your office, email is fine, too.
Here at SpeedCurve, we have a #ring_the_bell Slack channel where we share wins and milestones, both big and small. And in the spirit of Lara Hogan's donut manifesto, we send each other fun gift baskets to celebrate victories.
Share what you've learned
Shouting from the rooftops (and eating donuts) is a great start. Next, share what you did and what you learned from it. This can be in the form of company- or department-wide emails, posts on your in-house dev blog, and internal meetups. I know some performance teams that do regular monthly technical meetups, and once or twice a year they do a company-wide event where they share all their greatest webperf stats and victories.
Cultivating a healthy in-house performance culture also means embracing the fact that you're a member of a culture that's much bigger than your company. There are so many ways to get involved and to learn from other webperf enthusiasts:
- Share your case studies and successes (if your company allows it) on a public-facing tech blog. Good examples: Etsy's Code as Craft, and the Financial Times' Engine Room.
- Follow the #webperf hashtag on Twitter.
- Participate in one of the many Web Performance Meetups around the world.
- Attend performance-oriented conferences like #PerfMatters, DeltaV, and O'Reilly Fluent.
Additional resources
- Cars.com explains how they use SpeedCurve to create a performance culture.
- This RWD podcast episode is with a couple of members of Vox Media's performance team. Among other things, they do a great job of talking about perf culture.
- Lara Hogan has written an excellent book called Designing for Performance, and she's kindly made the text available online. The entire book is great, and chapter 8 is dedicated to performance culture.