Find and fix what matters most
Being able to monitor and measure the performance of your pages is crucial. You know that already. You also know that the next step is to quickly find out what’s hurting your pages so you can stop the pain.
You want to know:
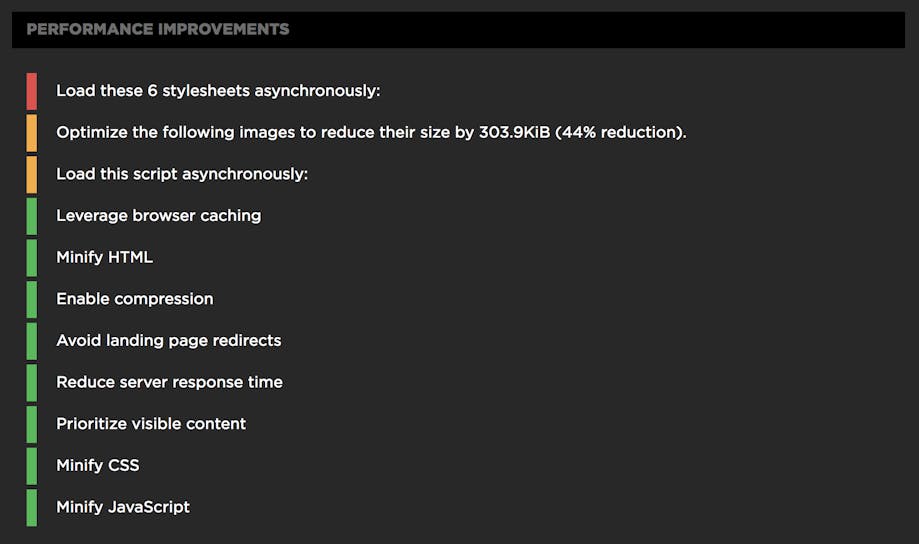
- Which performance rules is my page breaking?
- How do I prioritize my optimization efforts?
- How can I communicate this quickly and clearly to my team?
We’re super excited to announce that you can now use SpeedCurve to answer these questions.

Inspired by the great work done by Google’s PageSpeed Insights team, we developed our own curated list of performance rules. We took the rules that are most relevant to developers in the real world, then augmented them with data that’s unique to SpeedCurve – such as critical blocking JavaScript and CSS. And we packaged it with an intuitive UI that makes it easier for you to share your test results with your team, as well as other non-technical teams throughout your organization.
Get started
To get to your page-level diagnostics, go to your test timeline and open up any test results page. Scroll down, and voila. At a glance, you can see our curated list of performance rules, stacked and color-coded in their order of importance for this particular page. (We define “importance” as “the total amount of positive impact that optimizing for this rule would have on performance”.)

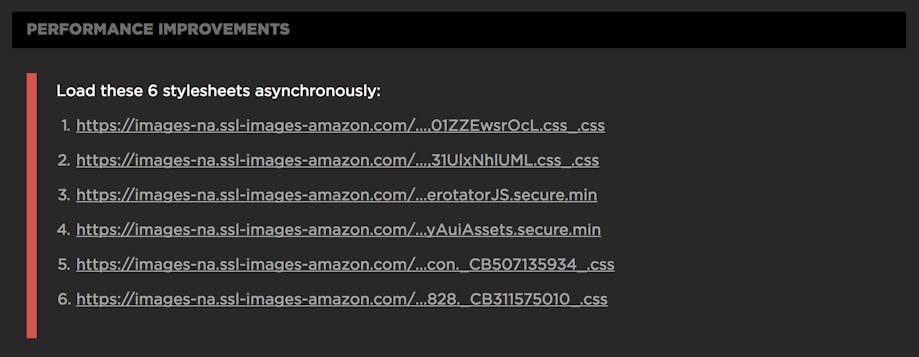
You can then expand any of these rules and see a list of specific assets that are causing trouble – again, listed in order of importance.
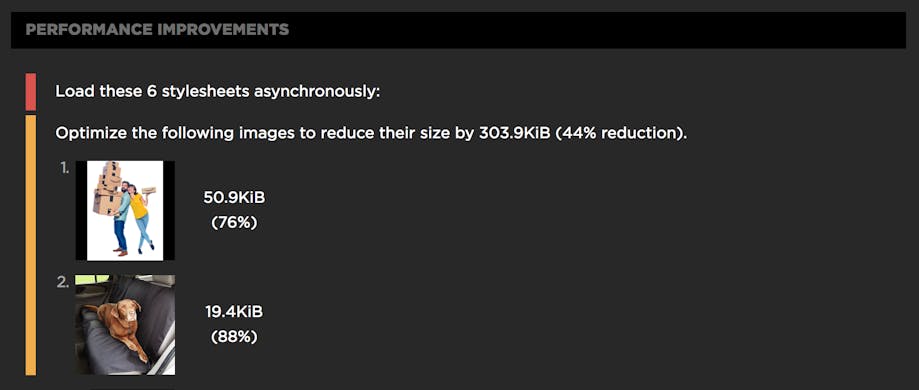
And here’s a feature I really love: When you look at your list of images that need optimization, you actually see thumbnails of each one, as well as a calculation of how much further each image can be optimized. This is a fantastic, fast, effective way to communicate to other teams in your organization, such as marketing and sales.

At SpeedCurve, we know you don’t have infinite amounts of developer hours to optimize your pages. We want to help you focus on what matters. This new feature is just the beginning.


