Introducing a new resource for the performance community: Page Speed Benchmarks!
Here are some common questions I’m asked when I talk with people about performance:
- Which metrics should I care about?
- What types of devices and connections should I test on?
- Which third parties should I be most concerned about?
- How fast should I be?
- What are some good sites I can use for benchmarking?
Today, I’m very excited to announce the release of a new project that helps answer those questions – and more!
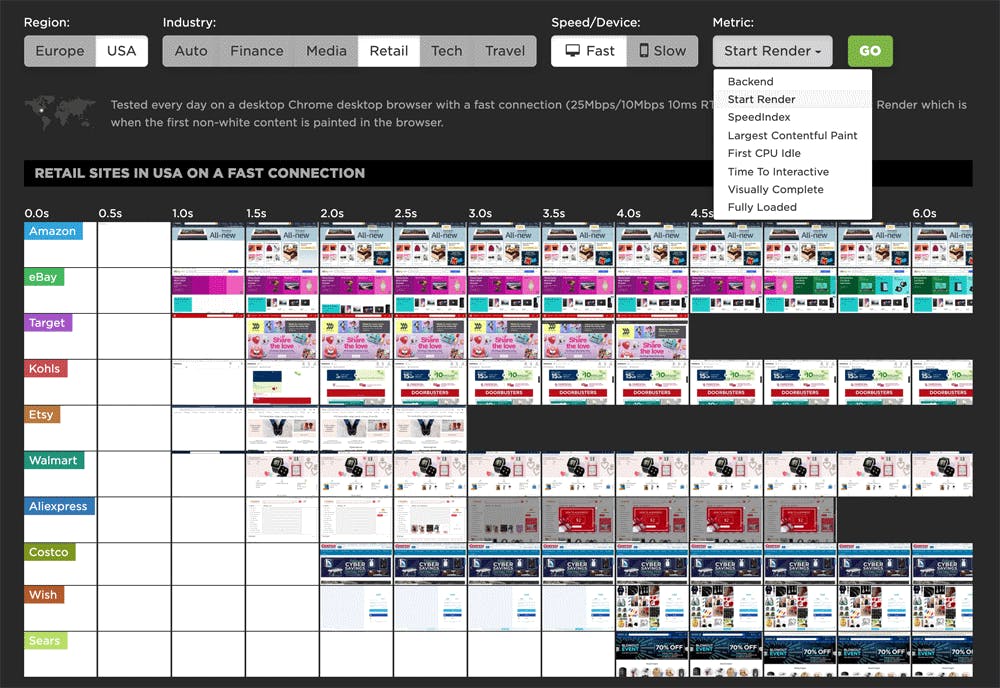
Page Speed Benchmarks is an interactive dashboard that lets you explore and compare web performance data for leading websites across several industries – from retail to media.
With Page Speed Benchmarks, you can do things like:
- See what the different metrics actually mean in terms of user-perceived performance
- Compare how the same page renders on fast vs slow devices and connections
- Understand what makes fast sites fast (and slow sites slow)
- Get insights into how third parties can perform on different sites
- Identify sites you can use for your own competitive benchmarking
If you already like tools like the HTTP Archive, I think you'll love how you can use Page Speed Benchmarks to complement the insights you're already getting. Keep reading to find out how we set up these benchmarks, and how you can mine our test data – even if you're not a SpeedCurve user – for your own performance research.
Load scripts async
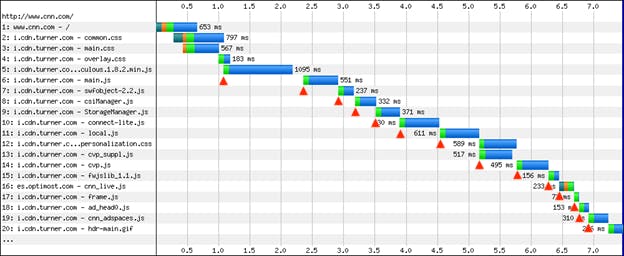
This blog post has a simple conclusion: Load script asynchronously! Simple, and yet the reality is that most scripts are still loaded synchronously. Understanding the importance of loading scripts asynchronously might help increase adoption of this critical performance improvement, so we're going to walk through the evolution of async script loading starting way back in 2007. Here's what loading 14 scripts looked like in Internet Explorer 7:

JavaScript growth and third parties
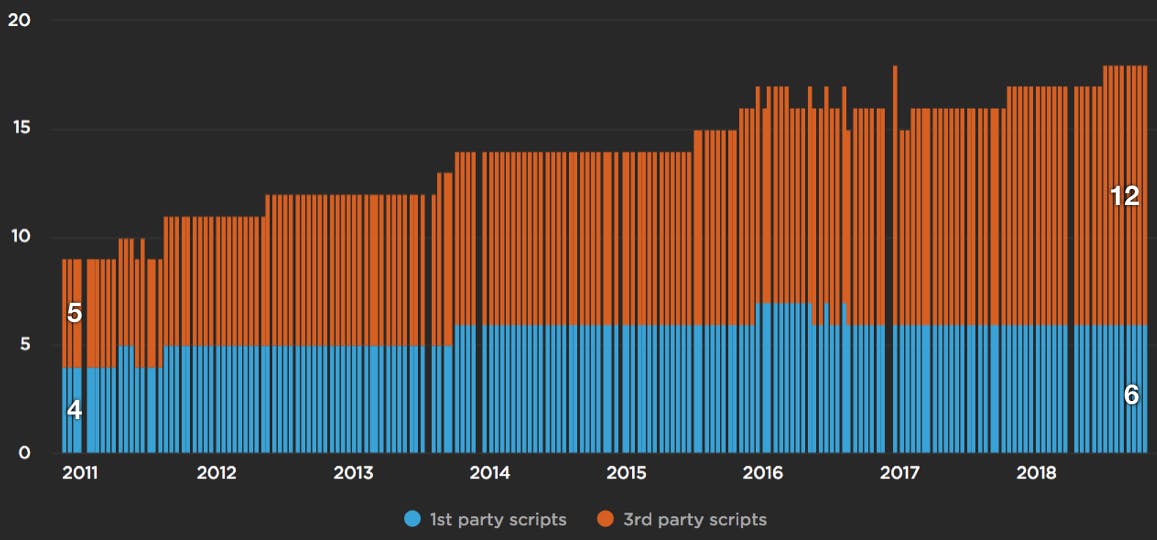
JavaScript is the main cause for making websites slow. Ten years ago it was network bottlenecks, but the growth of JavaScript has outpaced network and CPU improvements on today's devices. In the chart below, based on an analysis from the HTTP Archive, we see the number of requests has increased for both first and third party JavaScript since 2011.

Metrics from 1M sites
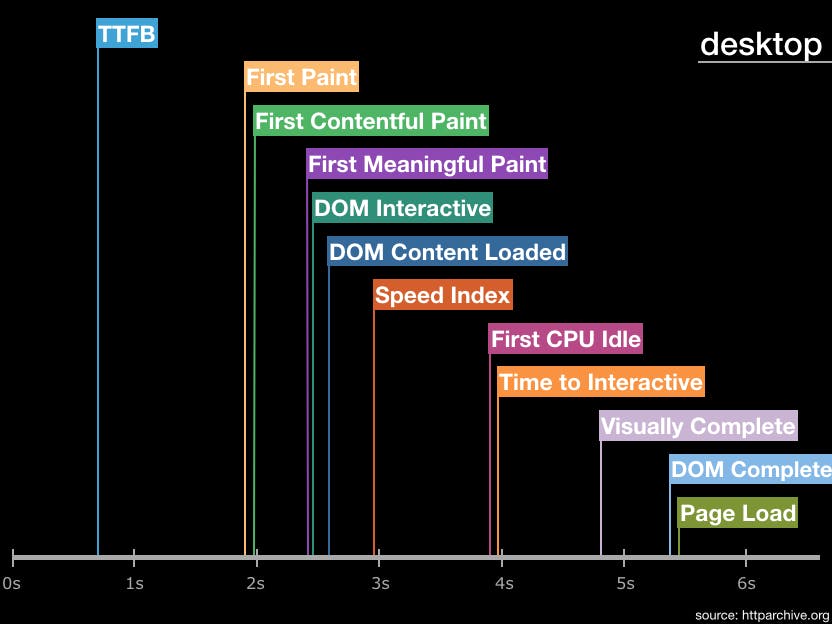
The number of performance metrics is large and increases every year. It's important to understand what the different metrics represent and pick metrics that are important for your site. Our Evaluating rendering metrics post was a popular (and fun) way to compare and choose rendering metrics. Recently I created this timeline of performance metric medians from the HTTP Archive for the world's top ~1.3 million sites:


