Web Performance for Product Managers
I love conversations about performance, and I'm fortunate enough to have them a lot. The audience varies. A lot of the time it’s a front-end developer or head of engineering, but more and more I’m finding myself in great conversations with product leaders. As great as these discussions can be, I often walk away feeling like there was a better way to streamline the conversation while still conveying my passion for bringing fellow PMs into the world of webperf. I hope this post can serve that purpose and cover a few of the fundamental areas of web performance that I’ve found to be most useful while honing the craft of product management.
So, whether you are a PM or not, if you're new to performance I've put together a few concepts and guidelines you can refer to in order to ramp up quickly. This post covers:
- What makes a page slow?
- How is performance measured?
- What do the different metrics mean?
- Understanding percentiles and how to use them
- How to communicate performance to different stakeholders
Let's get started...
What makes a page slow?
Short answer: Lotsa stuff. Here are some of the bigger contributors you should know about, but be aware of others as performance is a multi-headed beast.
Requests
Your page is made up of a lot of individual assets. Images, fonts, JavaScript, CSS, tracking pixels... these all play their part in delivering a rich experience. But collectively, these can add up to a "death by a thousand cuts" scenario.
Steve's golden rule remains true today: 80-90% of rendering time is spend in the front end, and the majority of that is requests sent across the wire. If you want to optimize your site, start by making as few requests as possible.
Code
There are a ton of best practices for front-end developers to follow. This is typically the work you'd throw into an optimization sprint (or twenty). Recommendations can come out of audits from consultants or from automated tools like Lighthouse (or SpeedCurve, of course). I like to use PageSpeed Insights when checking out a URL for a customer to get some high-level suggestions. We include Lighthouse scores and audits in our product for a good starting point.
Problem areas may include (but certainly aren't limited to):
- JavaScript,
- improving the 'critical path' or render blocking, and
- using directives to preload assets or load scripts asynchronously.
While the focus in most cases tends to be directed toward front-end developers, it's important to remember the back-end as well if you see higher than normal start render times or increases in more basic metrics like time to first byte.
Images
Image optimization continues to be one of the areas where huge performance gains can be made, often with little effort. Image compression has continued to evolve. New formats have been introduced that provide a rich feature set while minimizing bandwidth. In some cases these formats are specific to the browser, which can add some complexity to your workflow.
Regardless of whether or not you have the opportunity to make an impact in this area, understanding your image pipeline – whether it's in house or managed as a service – is a plus. This is especially true of sites that maintain a large product catalog or include a fair amount of user-generated content.
It's also important to note that, while not all performance gains will show up in your metrics, users with poor bandwidth or restrictive data plans will thank you. Consider setting your performance budgets related to images on size and number of requests as opposed to duration.
Networks
Yeah. The internet. It's consistently inconsistent. How things get from point A to point B still amazes me when you think about the complexity involved in sending bits over the wire.
For your purposes, you might be interested in how your technology partners (which you pay good money for) impact your performance. Content Delivery Networks (CDN) like Akamai, Fastly, Cloudflare, Cloudfront can sometimes have a big impact on performance. This traditionally manifests more in back-end time, but can have a huge impact on front-end as well when you factor in asset delivery (images, static content) as well as some advanced optimizations available at the edge. These platforms also give you the power to make things worse, not better, if you aren't careful.
Third parties
[Long audible moan] We love to hate them. However, we also love to use them. Everywhere.
Third parties, for our purposes, focus on contributors outside of your domain that enrich your content or deliver a service. The frustration with third parties is that they are often perceived to be outside of your control. Yes, it's true that when they impact your performance, there is little you can do to make them faster, short of removing the tag or throwing the kill switch.
That withstanding, you are a product manager. You are a master of influencing that which is outside the scope of your control. You can hold them accountable and maintain a strategy for keeping them in line. For example:
- Work with your vendor manager if you have one, or directly with the stakeholders responsible, to set and enforce performance budgets on your third parties. Maybe you create a tag budget that you can enforce with the responsible party. Maybe the budget relates to size.
- If your marketing department needs to add a new pixel, force one out in its place.
- Audit your third parties and prune out any ghost scripts.
- Before allowing a new third party, implement a vetting process to make sure it passes some basic guidelines around performance. My favorite tool for this is 3rdParty.io, contributed by Nic Jansma.
Whatever the cause for performance issues may be, it's important to maintain a team approach when tackling the issue. Rarely is it one person's fault that performance is where it is. It's also rare that a single person or group has ownership of that area and the ability to fix it independently of others. Performance is a team sport.
How is web performance measured?
There are two primary methods, both of which center around measuring how the browser responds when a user visits your site.
Synthetic monitoring
As in, not real. Synthetic monitoring is essentially a bot that does what you tell it to do ("go visit my home page from X location on X browser") and actively collects performance data.
Synthetic is great and has a ton of useful things to offer, as we can get an immense amount of detail around what happened when that action was performed. This includes:
- waterfall charts with details about every request,
- filmstrips and videos that help you visualize the rendering experience, and
- a reasonably consistent baseline when looking at the makeup of your application.
Synthetic is great for trending over time, especially when looking at the number and size of requests (images, JavaScript, CSS), which collectively have a big impact on speed.
But for all the goodness of synthetic monitoring, it's missing a critical component: end users.
Real user monitoring (RUM)
You guessed it: measuring real users. Think of RUM as performance-based analytics measured from the end user's actual browser.
As a great product manager, you’re already focused on building your product outside in. You talk to a gazillion customers, get their feedback, and turn that into requirements for your next product. This gives you the power of empathy that can be shared far and wide across your organization when building an exciting roadmap and creating the vision for your product or product line.
This is why you need RUM. Real users. Real experiences. RUM is the basis for understanding web performance and it's become the go-to source of truth when communicating performance to your stakeholders. How can you effectively include performance as a requirement without it? Hard sell here. I know. However, in this day and age, not bringing RUM data into the equation is performance malpractice.
What do the different metrics mean?
Whether you use synthetic or RUM, each tool captures dozens and dozens of performance metrics. Understanding which performance metrics you should care about has been a perilous journey over the years. The pendulum has swung from 'measure all the things' to 'here is my unicorn metric'. Today we're somewhere in between. The frustrating answer to the question "Which metric(s) should I care about?" remains the same:
"It depends."
Don’t get bogged down in the details. There's a plethora of metrics and you don’t need to understand all of them. For most of you, especially if you are just getting started with performance, focus on the metrics most closely tied to your user's experience. Here is a great guide from Tammy that tackles this head on.
In recent months, my conversations with PMs have been heavily centered around Core Web Vitals. If you are in this camp and getting pressure around improving SEO or responding to inbound questions regarding numbers seen in Google Console, you'll want to familiarize yourself with these metrics. Fortunately, there is a lot of good material for you to review on this topic. Start with these resources:
- Tracking Core Web Vitals
- Understanding Cumulative Layout Shift
- First Input Delay, How vital is it?
- Everything we know about Core Web Vitals by Simon Hearne
How to use percentiles
Now that you understand the different metrics, it's important to know how to apply percentiles to each one so that you can understand how different cohorts of real users are experiencing your site.
This is a histogram:
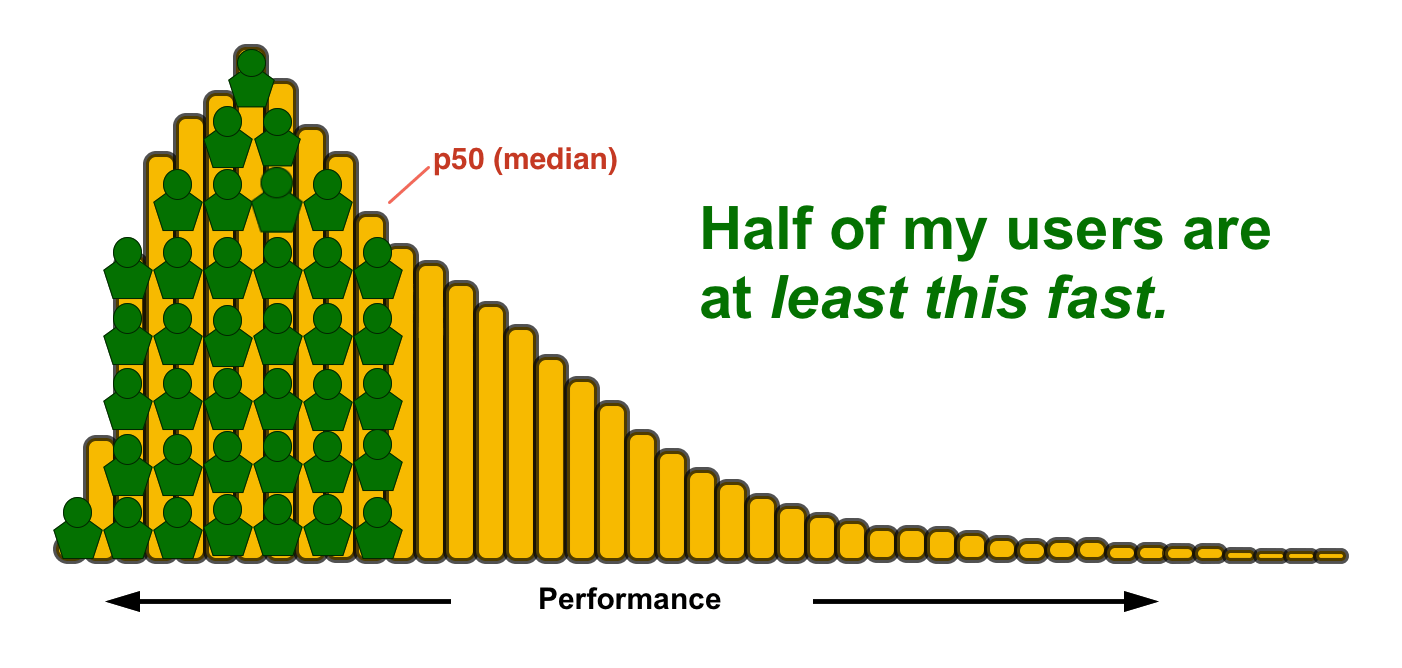
A histogram represents the distribution of your users who had a range of experiences when visiting your site. Remember that.
Performance is a distribution, not a single number. It's not measured once. A histogram represents a continuum of experiences, which allows you to think of the shape of performance and how you want to influence it. Faster shifts left, slower shifts right.
I still need to communicate a number. What do I do?
No worries, you'll still need to talk in numbers. Percentiles represent segments of your population from 0-100. You don’t need to be a statistician to do this. Just think in terms like this:
50th percentile (median): I find using the 50th percentile, aka the median, easier to understand and communicate. You can even refer to it as an average if you want.
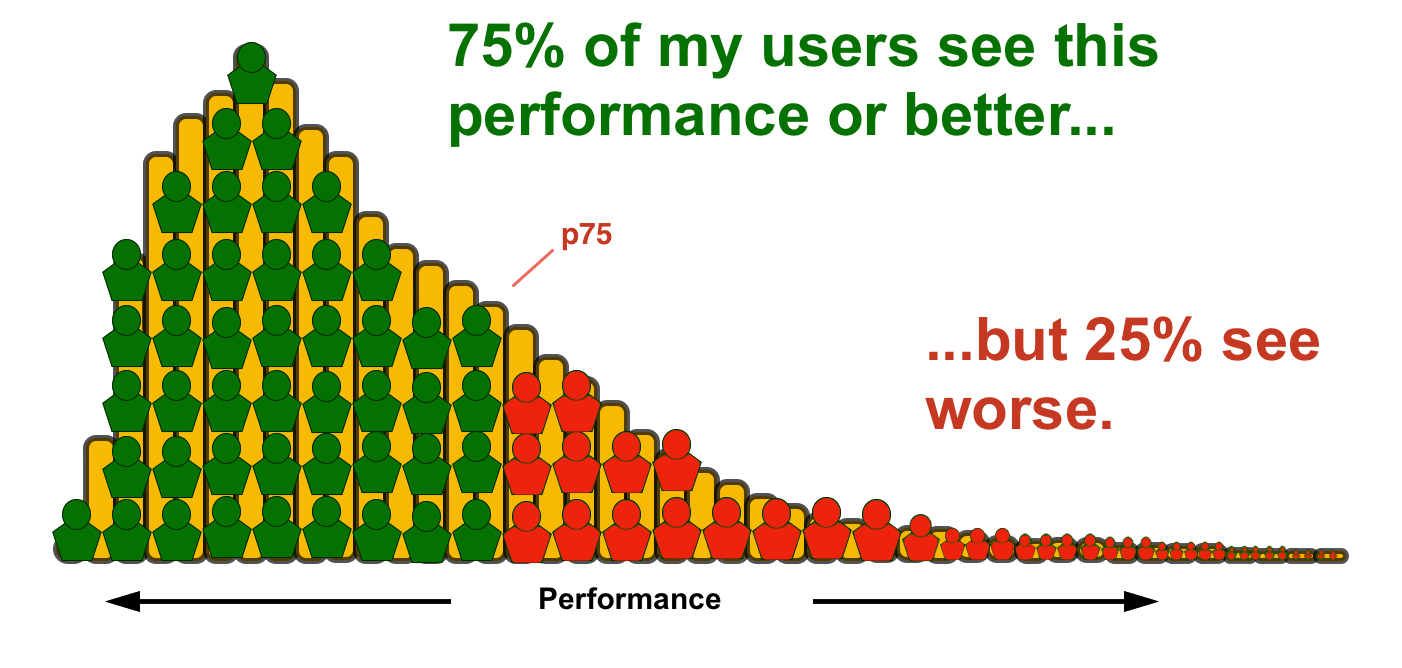
 75th percentile: For some popular metrics, such as Core Web Vitals, the 75th percentile is being used for reporting.
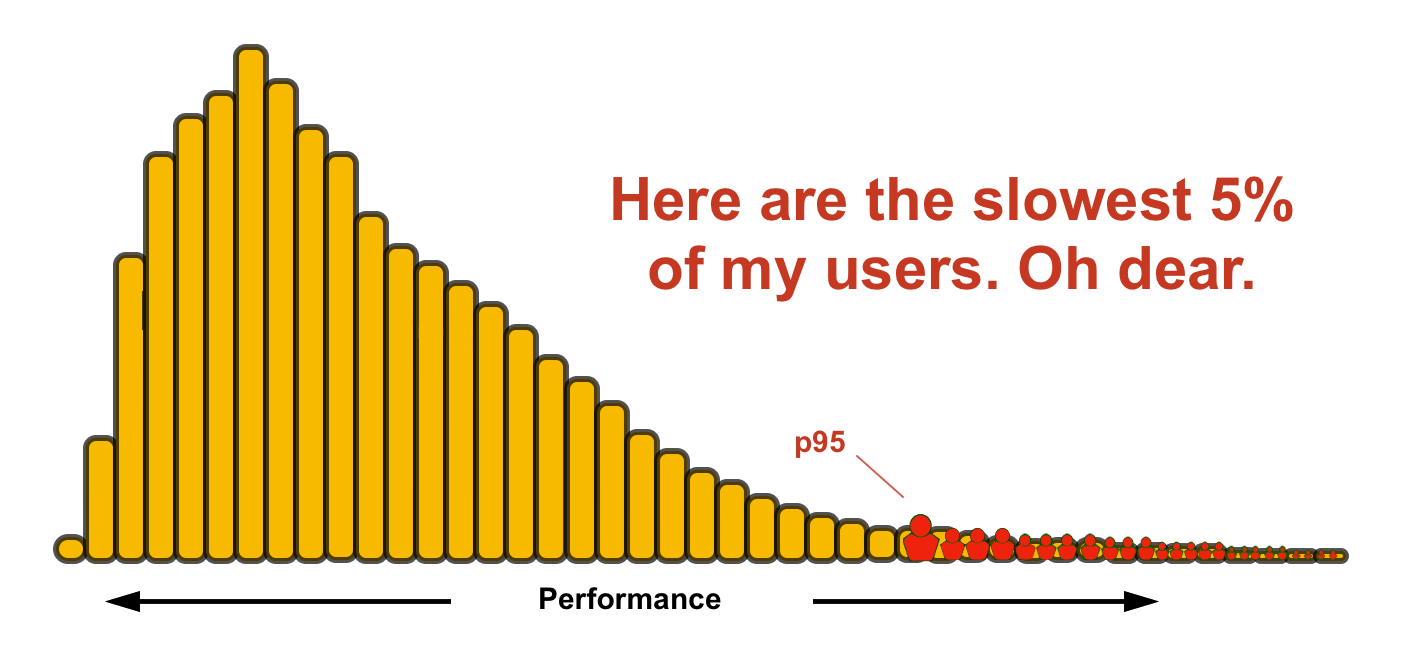
 95th percentile: If your site is already pretty fast for most users, you can focus on making it fast for your longtail. Five percent of your users may not sound like much, but if you site gets 10M visitors a month, that means 500,000 of those people are having a really poor experience.
There isn’t a wrong answer when it comes to which percentile to focus on, as each has merit, unless you are using an arithmetic mean (AKA traditional average) to describe your population. That doesn't work so well for this type of distribution.
How should I communicate all of this?
I continue to find this to be one of the biggest challenges product managers face when it comes to performance. We've been working on this challenge for years and still haven't nailed it. Here are some thoughts on communication that you may want to keep in mind.
Know your audience
This isn't a new concept. You wear many hats and speak many languages when it comes to working cross-functionally. Think about that before you rolling out new terminology, concepts, or going into the weeds with your CEO.
Keep it simple
Don't over-communicate or confuse folks. If you are centered on a few performance KPIs for your reporting, great. If you manage to get aligned around that unicorn metric, fantastic. Just don't dress it up too much. Leave out terms like percentile and avoid presenting two sets of numbers. This is often a mistake I see PMs making when trying to communicate their RUM metric as well as their synthetic metric. Just don't do it. Again, use RUM whenever humanly possible. You can use synthetic to highlight areas such as page weight or element count or to illustrate the number of third parties on your site. This is where synthetic compliments your RUM data very nicely.
Paint a picture of performance
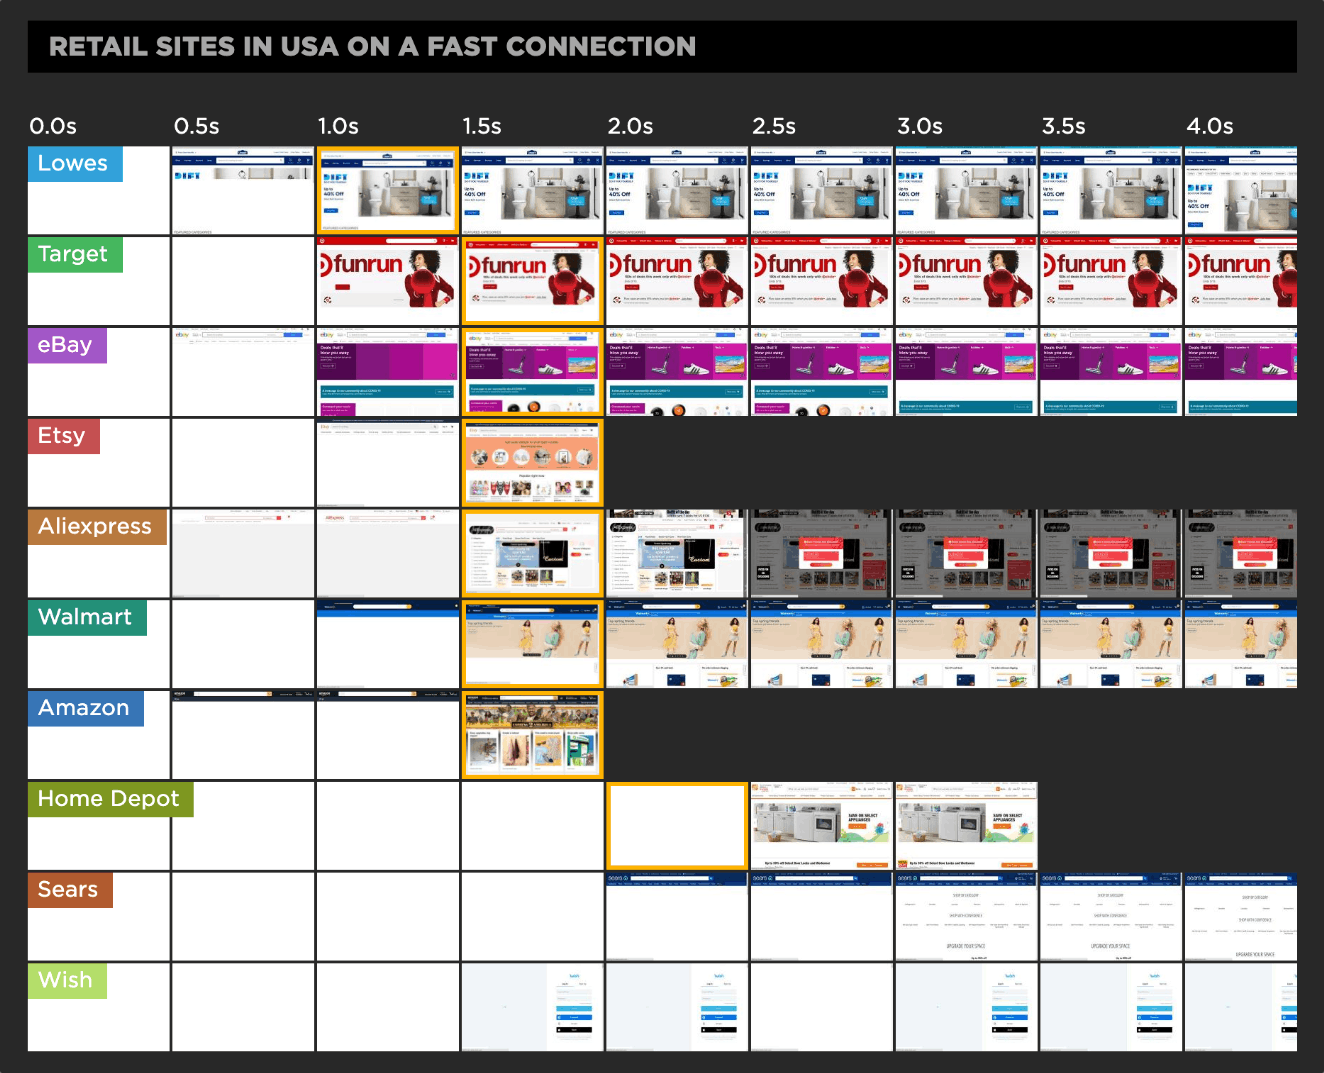
This is where synthetic monitoring tools steal the show. Using filmstrips or videos to illustrate a point goes a really long way when speaking to stakeholders that are out of the loop on performance. There is nothing better than showing a before-and-after video when promoting the great work of your team.
Benchmark yourself
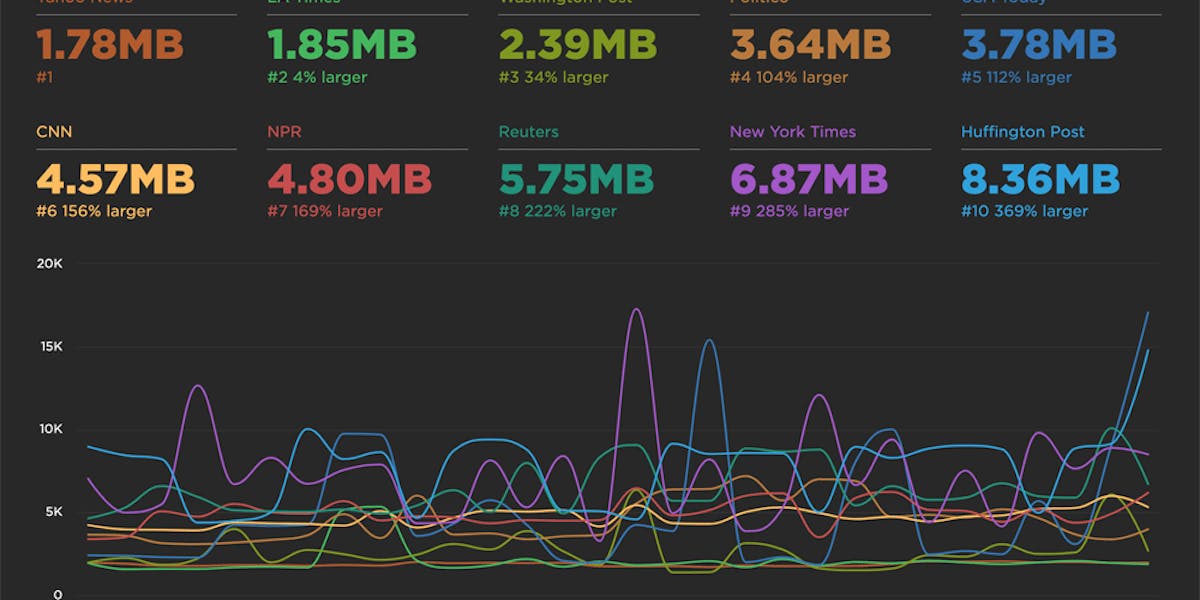
Another great tool to have in your bag is benchmarking. Teams love to win and hate to lose. Using benchmarking as a way to compare yourselves to your competition is extremely effective. This is especially true when it comes to managing Core Web Vitals. If half of your competitors have a faster LCP time than you, what impact will that have on your search results?
As hard as it may be, avoid shaming. Whether you or your competition are at the bottom, that can change at anytime. Use benchmarking to make yourself better or to understand and learn from others. Check out our Industry Page Speed Benchmarks for an idea of how you can use benchmarking part of your toolkit.
Summary
These are the fundamentals, and I hope you've found the time reading them to be well-spent. Like any topic you get exposed to as a product manager, you can always go deeper.
Still have questions or thoughts? I'm sure others would love to hear them as well, so feel free to comment below.


