Getting started with web performance? Here's what you need to focus on.

A while back, our friends at Shopify published this great case study, showing how they optimized one of their newer themes from the ground up – and how they worked to keep it fast. Inspired by that post, I wanted to dig a bit deeper into a few of the best practices they mentioned, which fall loosely into these three buckets:
- Analyze your pages – understand the critical rendering path and page composition.
- Create performance budgets and fight regression.
- Build a performance culture that embraces collaboration between design and dev.
Keep reading to learn how you can apply these best practices to your own site and give your pages a speed boost.
What's hurting the user experience?
When we think about things that can hurt the user experience, it's important to know that issues fall into two camps:
- Blocking resources – Resources like CSS, JS (including third parties), custom fonts, etc., which can block the critical rendering path.
- Non-blocking resources – Resources that are so numerous or so poorly optimized that they hamper the CPU and cause jankiness and a poor user experience.
Blocking resources, as their name suggests, block the critical rendering path. The critical rendering path is the set of steps browsers must take to convert HTML, CSS and JavaScript into living, breathing websites. To optimize for performance, you need to understand what happens in the steps between receiving the HTML, CSS, and JavaScript bytes and the processing that's required to turn them into rendered pixels.
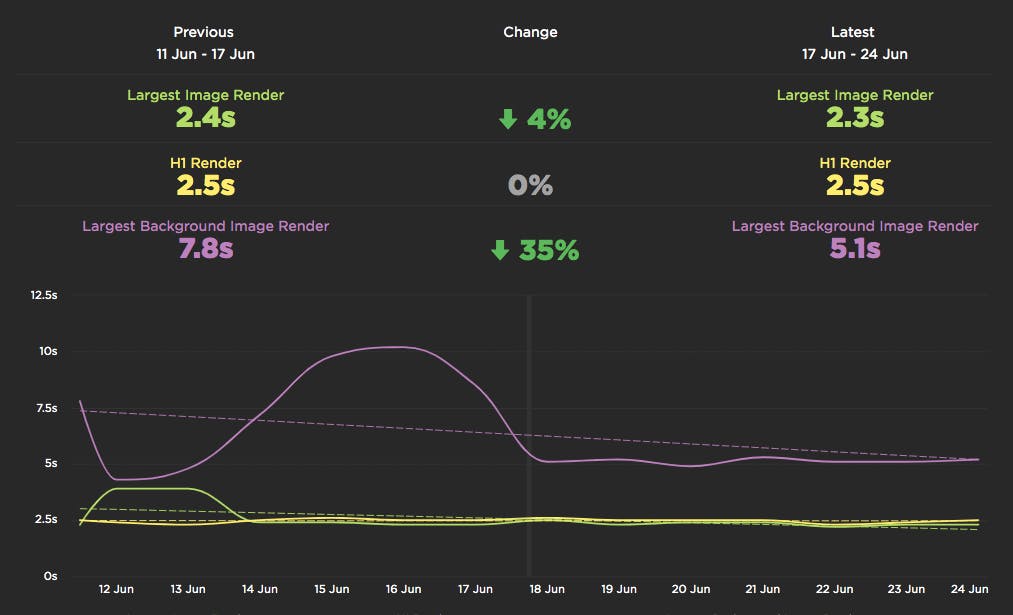
It's not enough to focus on when the page first starts displaying pixels – you need to make sure you're showing content your users care about. That's why it's a good idea to not just focus on metrics like Start Render – you should also investigate Hero Rendering metrics, which track when the most meaningful content on your pages (e.g., hero images, headlines) renders.
It's also not enough to focus on blocking resources. It's possible for pages to contain zero blocking resources and still have less-than-optimal performance because of how your JavaScript is rendered. That's why it's so important to understand CPU usage on your pages – because JavaScript consumes more CPU than all other browser activities combined. While JS blocks the CPU, the browser can't respond to user input. This creates what’s commonly called “jank” – that annoying feeling of jittery, unstable page rendering.
To help focus attention on CPU usage, we’ve been evangelizing a couple of new performance metrics:
- First CPU Idle measures when the page is no longer janky. Specifically, it's the first span of 5 seconds where the browser main thread is never blocked for more than 50ms after First Contentful Paint. A value of 2-4 seconds is typical.
- Total Long Task CPU Time is the sum of all long tasks that occur in the page. A "long task" is a browser event that blocks the main thread for more than 50ms.
If you still need to be convinced, this correlation chart shows a distinct correlation between increased CPU Time and higher bounce rates:
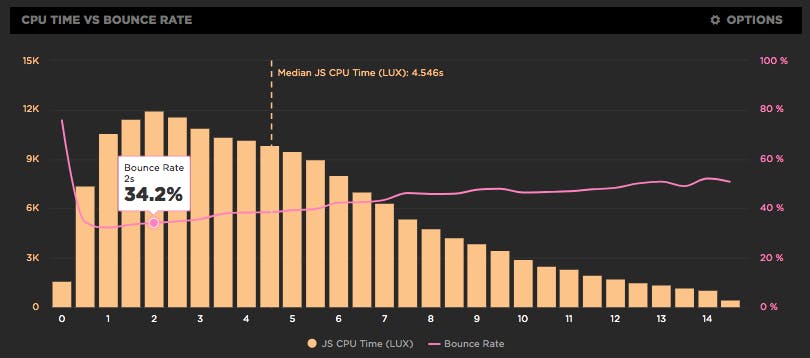
(If you're a SpeedCurve LUX user, this chart is at the top of your JavaScript dashboard. If you're not a LUX user, here's how you can try it for free.)
After you understand First CPU Idle and CPU Time, there are a couple more metrics that will help you understand the relationship between the rendering path and how people interact with your pages:
- First Interaction Time is the first time a user interacts with a page – by either scrolling, clicking, or using the keyboard. (At SpeedCurve we call these metrics "IX Time" and they're available on your LUX Performance dashboard.) First Interaction Time can vary widely depending on the type of site and page. For example, a search results page might have a low First Interaction Time because users scroll and click quickly. A media site, on the other hand, might have a higher First Interaction Time because users start reading content before they interact with the page.
- First Input Delay measures the gap between when a user interacts (e.g., clicks or scrolls) with the page and when the browser acts on that input. A good target for FID is 10ms, though it's common to see results as high as 25ms is common. (FID is also available on your LUX Performance dashboard.)
A few things to keep in mind when you're looking at all these metrics in relation to one another:
- Know how many blocking resources are on your pages. Wherever possible, load them asynchronously or even defer them.
- Observe how often First Interaction Time is after First CPU Idle.
- Understand the amount of CPU time that's consumed by Long Tasks.
- Monitor your longest Long Tasks.
- Track First Input Delay relative to interaction and rendering times.
Read more: Measuring Jank and UX
Understand page bloat
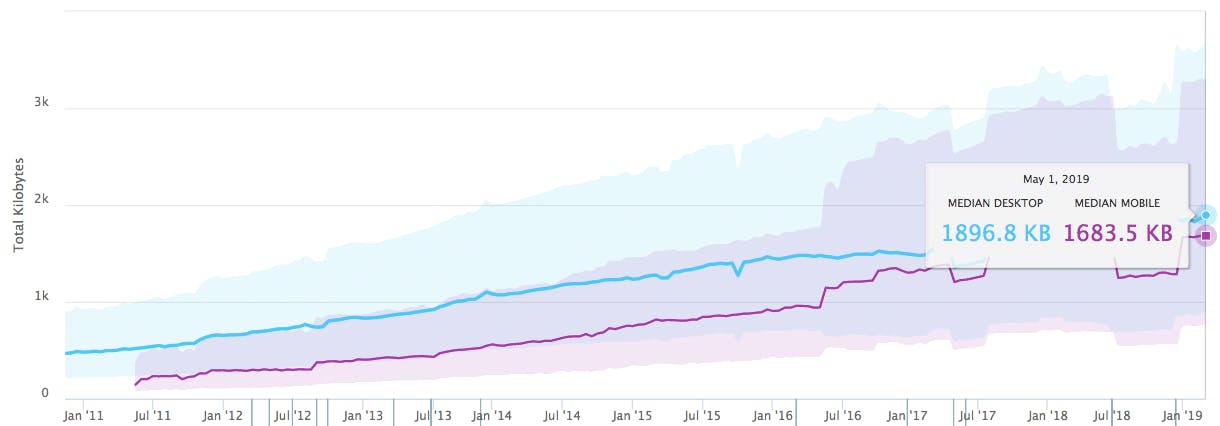
According to HTTP Archive data for the top million websites, the median page served to desktop is close to 1900 KB. The median page served to mobile isn’t much smaller, at close to 1700 KB. It’s important to remember that these numbers are medians. I routinely see pages that are between 5 and 10 MB in size. Images account for roughly half the size. JavaScript, fonts, and video carry the bulk of the rest of the weight.
It's important to note that you can have large, robust pages that still feel fast. Take Amazon, for example. It's widely considered to be a performance leader, yet it has relatively heavy pages. (I'm defining "heavy" as 3MB or more.)
But you should still keep an eye on page and resource sizes for a couple of reasons:
- Consider the cost and performance impact of serving bloated pages to mobile users who are dealing with bandwidth constraints or data limits.
- Sudden increases in page size can also be an indicator that you’ve got rogue unoptimized images (or other assets) that could be wreaking havoc on user experience. For example, I see this particularly with hero images on campaign landing pages, which are sometimes built and released quickly without proper due diligence paid to ensuring they’re performant.
Create performance budgets
Performance budgets are a vital tool in your web performance toolbox. They take the hassle out of monitoring your page performance by notifying you whenever your metrics cross a certain threshold.
If you've been following along so far, you may already be guessing that it's a good idea to consider creating performance budgets for the CPU- and size-related metrics we've covered. You should also consider creating performance budgets for:
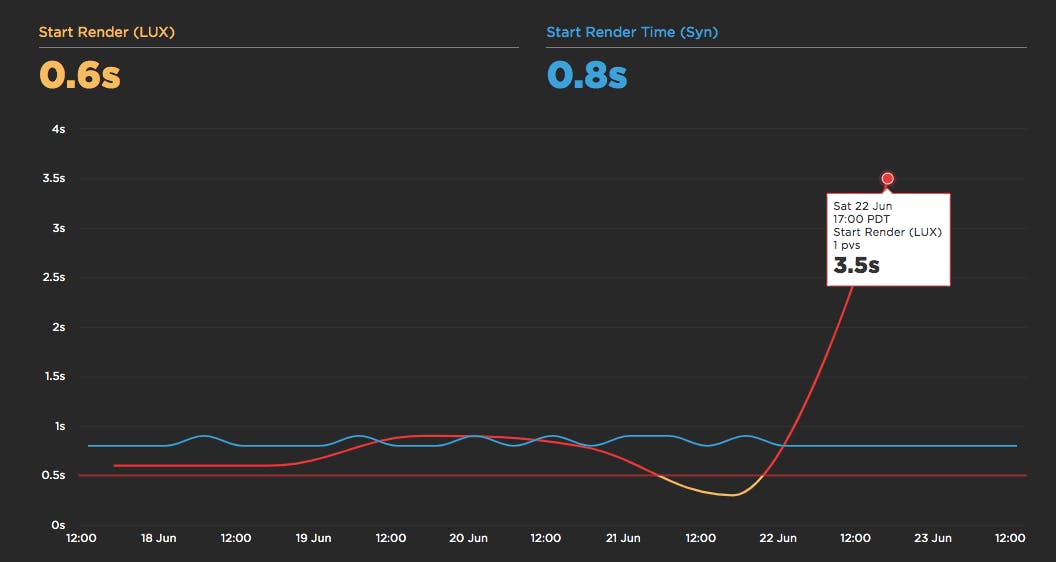
- Start render (synthetic and RUM): 2 seconds recommended
- Speed Index (synthetic only): 4 seconds recommended
- Last Painted Hero (synthetic): 5 seconds recommended
IMPORTANT: These defaults are intended to be a jumping-off point for your own analysis. You may find that some of these metrics and numbers are relevant for your site, while others may be less relevant. If you're tracking custom metrics, you probably want to create performance budgets for them.
Since Google research suggests that you should aim to be at least 20% faster than your fastest competitor, it might also be a good idea to monitor your competitors' sites so you can create budgets that will help you stay faster than the competition.
To motivate you, here are some real-world performance budget wins:
- Casper used perf budgets to track the performance impact of self-hosting a third-party script.
- Zillow set budgets for their quantity (e.g. image size) and milestone timing metrics in mobile search.
Read: How to create performance budgets and set alerts
Fight performance regression
Ask anyone who’s been in the performance space for a while, and they’ll tell you that making your pages faster isn’t the hardest part – it’s keeping your pages fast. Over time, so many insidious factors can cause pages to slow down:
- New features
- More third-party scripts
- Changes to your code base
- Team changes
- Your company de-prioritizes performance
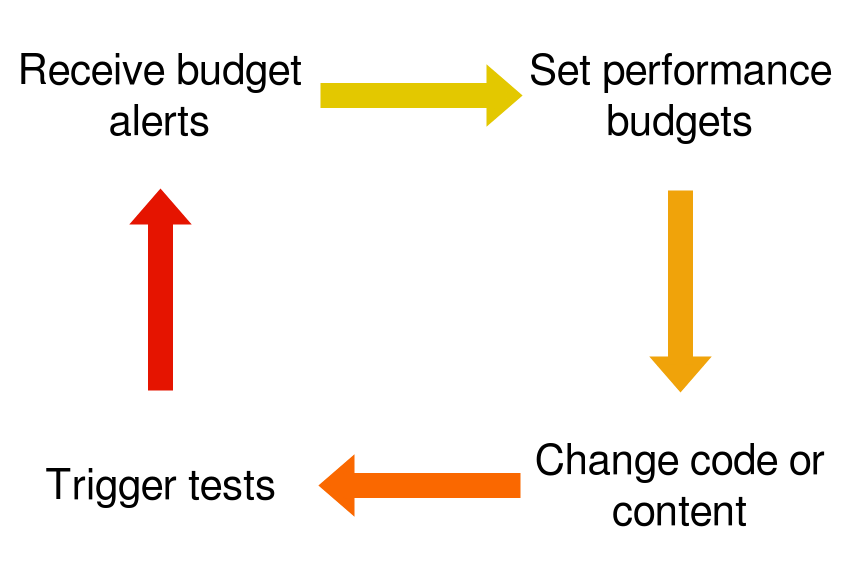
One of the most effective ways to fight performance regression is to integrate performance testing into your continuous delivery process. This is a natural extension of using performance budgets in an ongoing, meaningful way. In an ideal setup, the build is blocked until performance testing is complete, and it can potentially fail if the performance budgets for any tests are violated. In other words, performance regressions are caught before they make it to production. Treating performance as a first-class acceptance criteria creates a complete feedback loop for teams to manage the performance of their work.
Read: Performance testing in CI: Let's break the build!
Build a culture of web performance throughout your company
Shopify emphasizes that collaboration between designers and developers was a critical part of the success of their project:
“Collaborate with other disciplines, and contribute to levelling up their work by considering performance.”
At SpeedCurve, we talk a lot about “performance culture” and what that looks like. In simple terms, creating a strong performance culture means creating a feedback loop in your company or team that gets people to care, shows them what they can do to help, and then gives them positive reinforcement when you get results. It's surprisingly easy to skip these steps and then wonder why all your performance efforts feel like such a painful uphill slog – and why regression is inevitable.
Some performance culture best practices include:
- Identify people’s goals and the performance metrics that correlate to those goals.
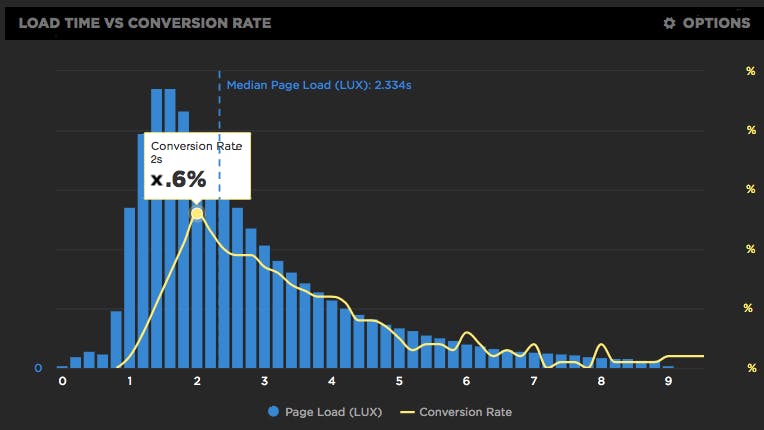
- Connect the dots. For example, correlation charts, like the one below, show people the relationship between performance metrics and conversion rate.
- Benchmark your site against your competitors.
- Collaborate on performance budgets. I can’t emphasize this enough: performance budgets shouldn’t be a top-down process.
- Score some quick, inspiring wins by fixing the low-hanging fruit. The first places to look are images and blocking stylesheets and scripts (especially third parties).
- Share and celebrate. This can be in the form of company- or department-wide emails, posts on your in-house dev blog, and internal meetups.
Read: Performance culture tips and best practices
You can't fix what you don't measure
The first step is to understand how your pages perform and identify roadblocks. If you're already a SpeedCurve user, you can start trying out these tips right away. If you're not a SpeedCurve user, give us a try for free!