NEW: Exploring RUM sessions

If you want to understand how people actually experience your site, you need to monitor real users. The data we get from real user monitoring (RUM) is extremely useful when trying to get a grasp on performance. Not only does it serve as the source of truth for your most important budgets and KPIs, it help us understand that performance is a broad distribution that encompasses many different cohorts of users.
While real user monitoring gives us the opportunity for unparalleled insight into user experience, the biggest challenge with RUM data is that there's so much of it. Navigating through all this data has typically been done by peeling back one layer of information at a time, and it often proves difficult to identify the root cause when we see a change:
"What happened here?"
"Did the last release cause a drop in performance?"
"How can I drill down from here to see what's going on?"
"Is the issue confined to a specific region? Browser? Page?"
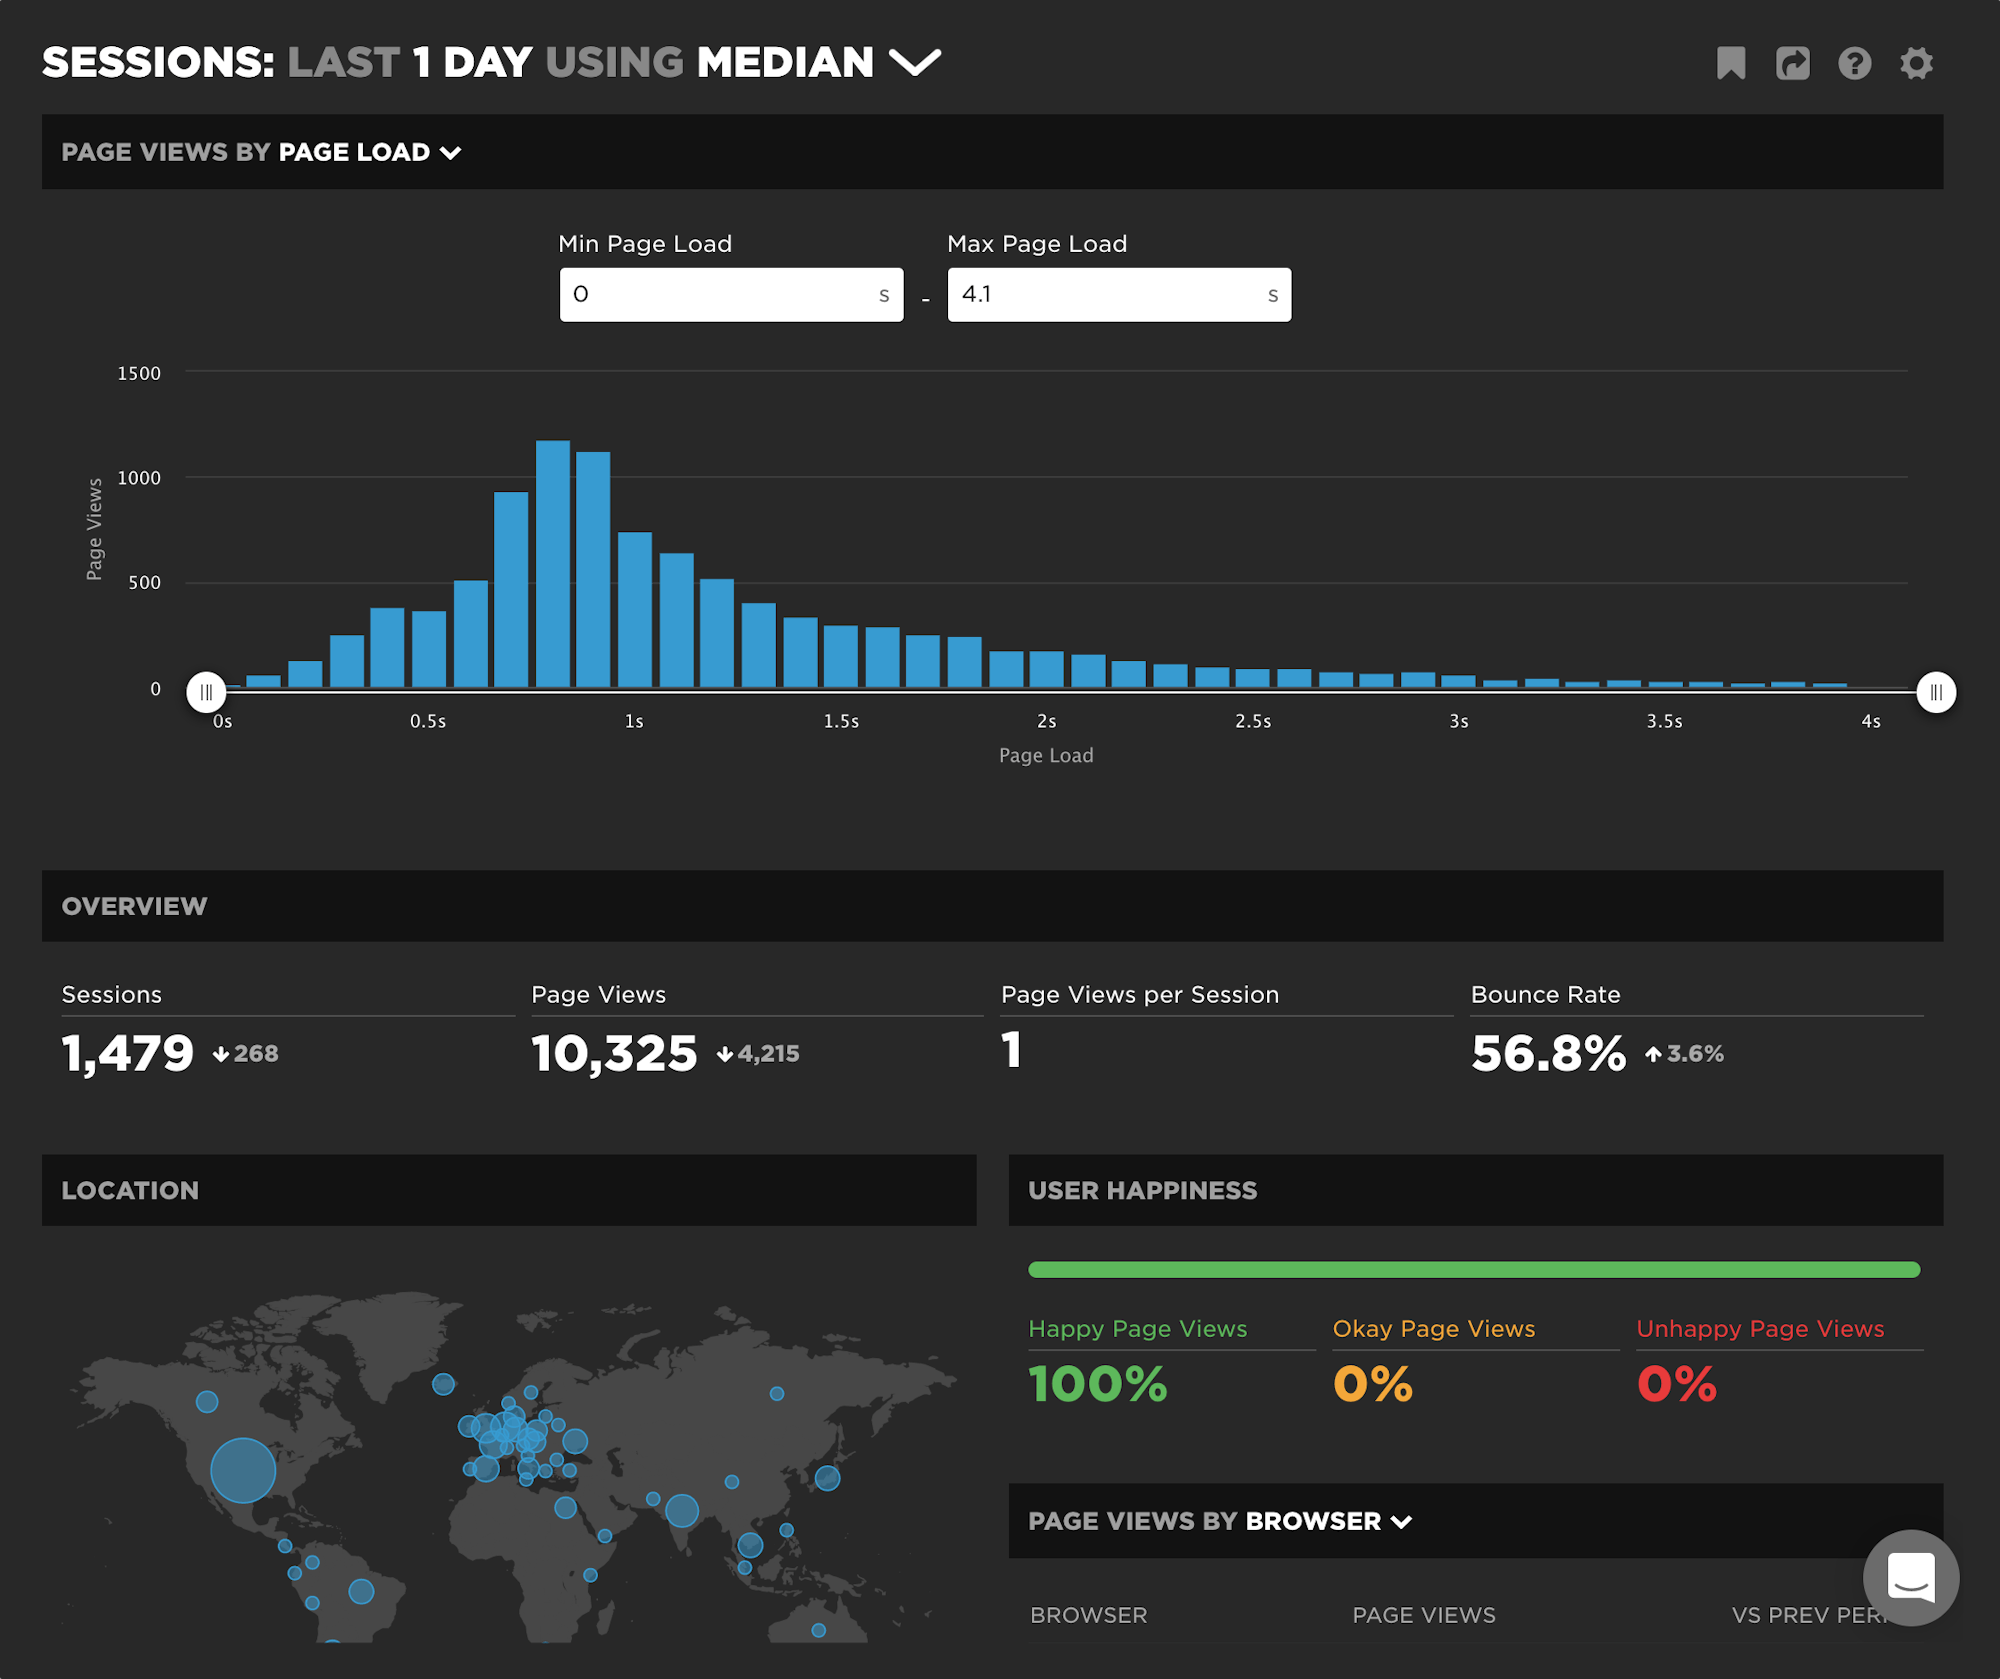
Today we're excited to release a new capability – your RUM Sessions dashboard – which allows you to drill into a dataset and explore those sessions that occurred within a given span of time.
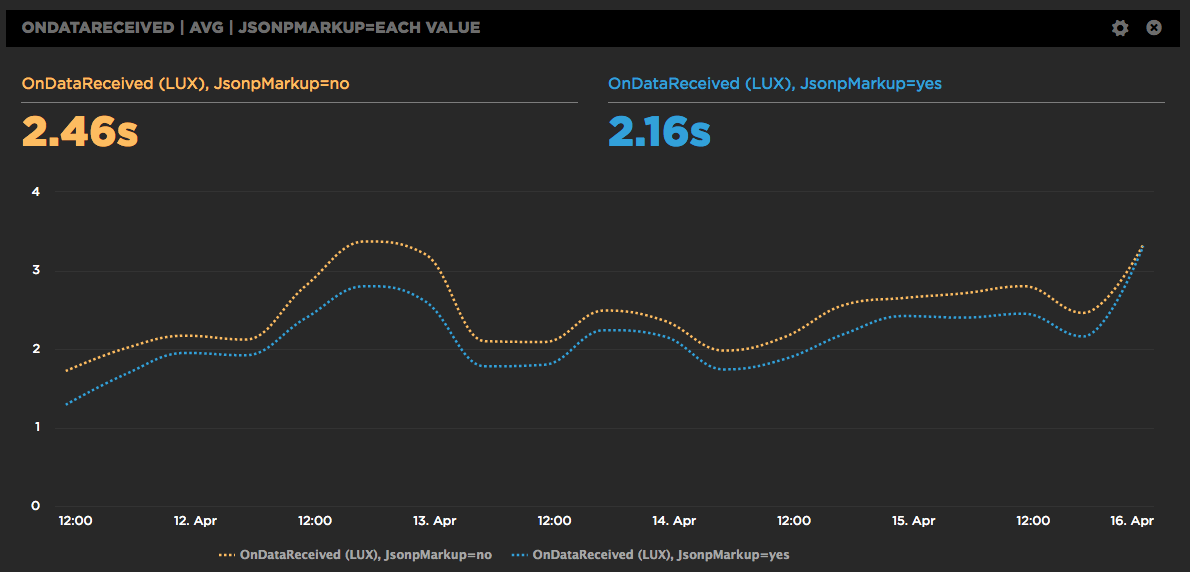
A/B Testing JSONP and the Preloader with RUM

SpeedCurve is a SPA (Single Page App) so we construct the charts dynamically using JSONP. It works great, but we're always looking for ways to make the dashboards faster. One downside to making requests dynamically is that the browser preloader isn't used. This isn't a factor for later SPA requests, but on the first page view the preloader might still bring some benefits. Or maybe not. We weren't sure, so we ran an A/B test. Long story short, doing the first JSONP request via markup caused charts to render 300 milliseconds faster.