First Input Delay: How vital is it?
We’ve been pretty vocal about Core Web Vitals since Google announced this initiative last spring. We love the idea of having a lean, shared set of metrics that we can all rally around – not to mention having a broader conversation about web performance that includes teams throughout an organization.
For many site owners, the increased focus on Core Web Vitals is driven by the fact that Google will be including them as a factor in search ranking in May 2021. Other folks are more interested in distilling the extremely large barrel of performance metrics into an easily digested trinity of guidelines to follow in order to provide a delightful user experience.
We’ve had some time to evaluate and explore these metrics, and we're committed to transparently discussing their pros and cons.
The purpose of this post is to explore First Input Delay (FID). This metric is unique among the three Web Vitals in that it is can only be measured using real user monitoring (RUM), while the other two (Largest Contentful Paint and Cumulative Layout Shift) can be measured using both RUM and synthetic monitoring.
In this post we'll cover:
- What is FID?
- What does FID look like across the web?
- The importance of measuring user interactions
- How JavaScript affects user behavior
- Suggestions for how you can look at FID in relation to your other key metrics
Let's dig in!
What is FID, and what is it intended to measure?
Responsive applications are great. Slow, sluggish, or janky applications are not. They frustrate the user and ultimately affect a site's brand – and, in some cases, their bottom line.
First Input Delay (FID) is intended to shine a spotlight on how quickly your application responds to user input. The time between a user’s first interaction and the browser’s ability to respond can be delayed when the browser’s main thread is busy. A typical – and increasingly important – cause of main thread activity is the execution of JavaScript. We’ve discussed the impact that Long Tasks (tasks attributed to JavaScript that take more than 50ms) can have and how best to measure them in previous posts here and here.
The expectation we've had in naming FID as a Core Web Vital is that there would be a strong correlation between long tasks and FID. In fact, it's even recommended you look at Total Blocking Time as a proxy for FID when looking at synthetic data. It's safe to say that the intent of FID is to understand the impact that JavaScript has on the page experience.
A few technicalities about FID that you may care about:
- The user input required for FID is defined as a click/tap or key press (doesn't include scroll or zoom).
- FID is only measurable with real user monitoring (field data).
- In the case of SpeedCurve RUM, we are measuring FID for traditional applications as well as SPAs.
- While there is now support for a native first-input performance entry type in Chrome, FID can still be measured across all modern browsers.
How does FID look across the web?
We took a broad look at the web with RUM data to get a sense of how FID looks in the field. Google’s recommendation is to keep FID under 100ms at the 75th percentile to maintain a ‘good’ rating. On the surface, FID scores look very promising across the board at 33ms. Even the long tail of FID seems pretty reasonable considering that 95% of the population stays out of the red, or 'poor', range.
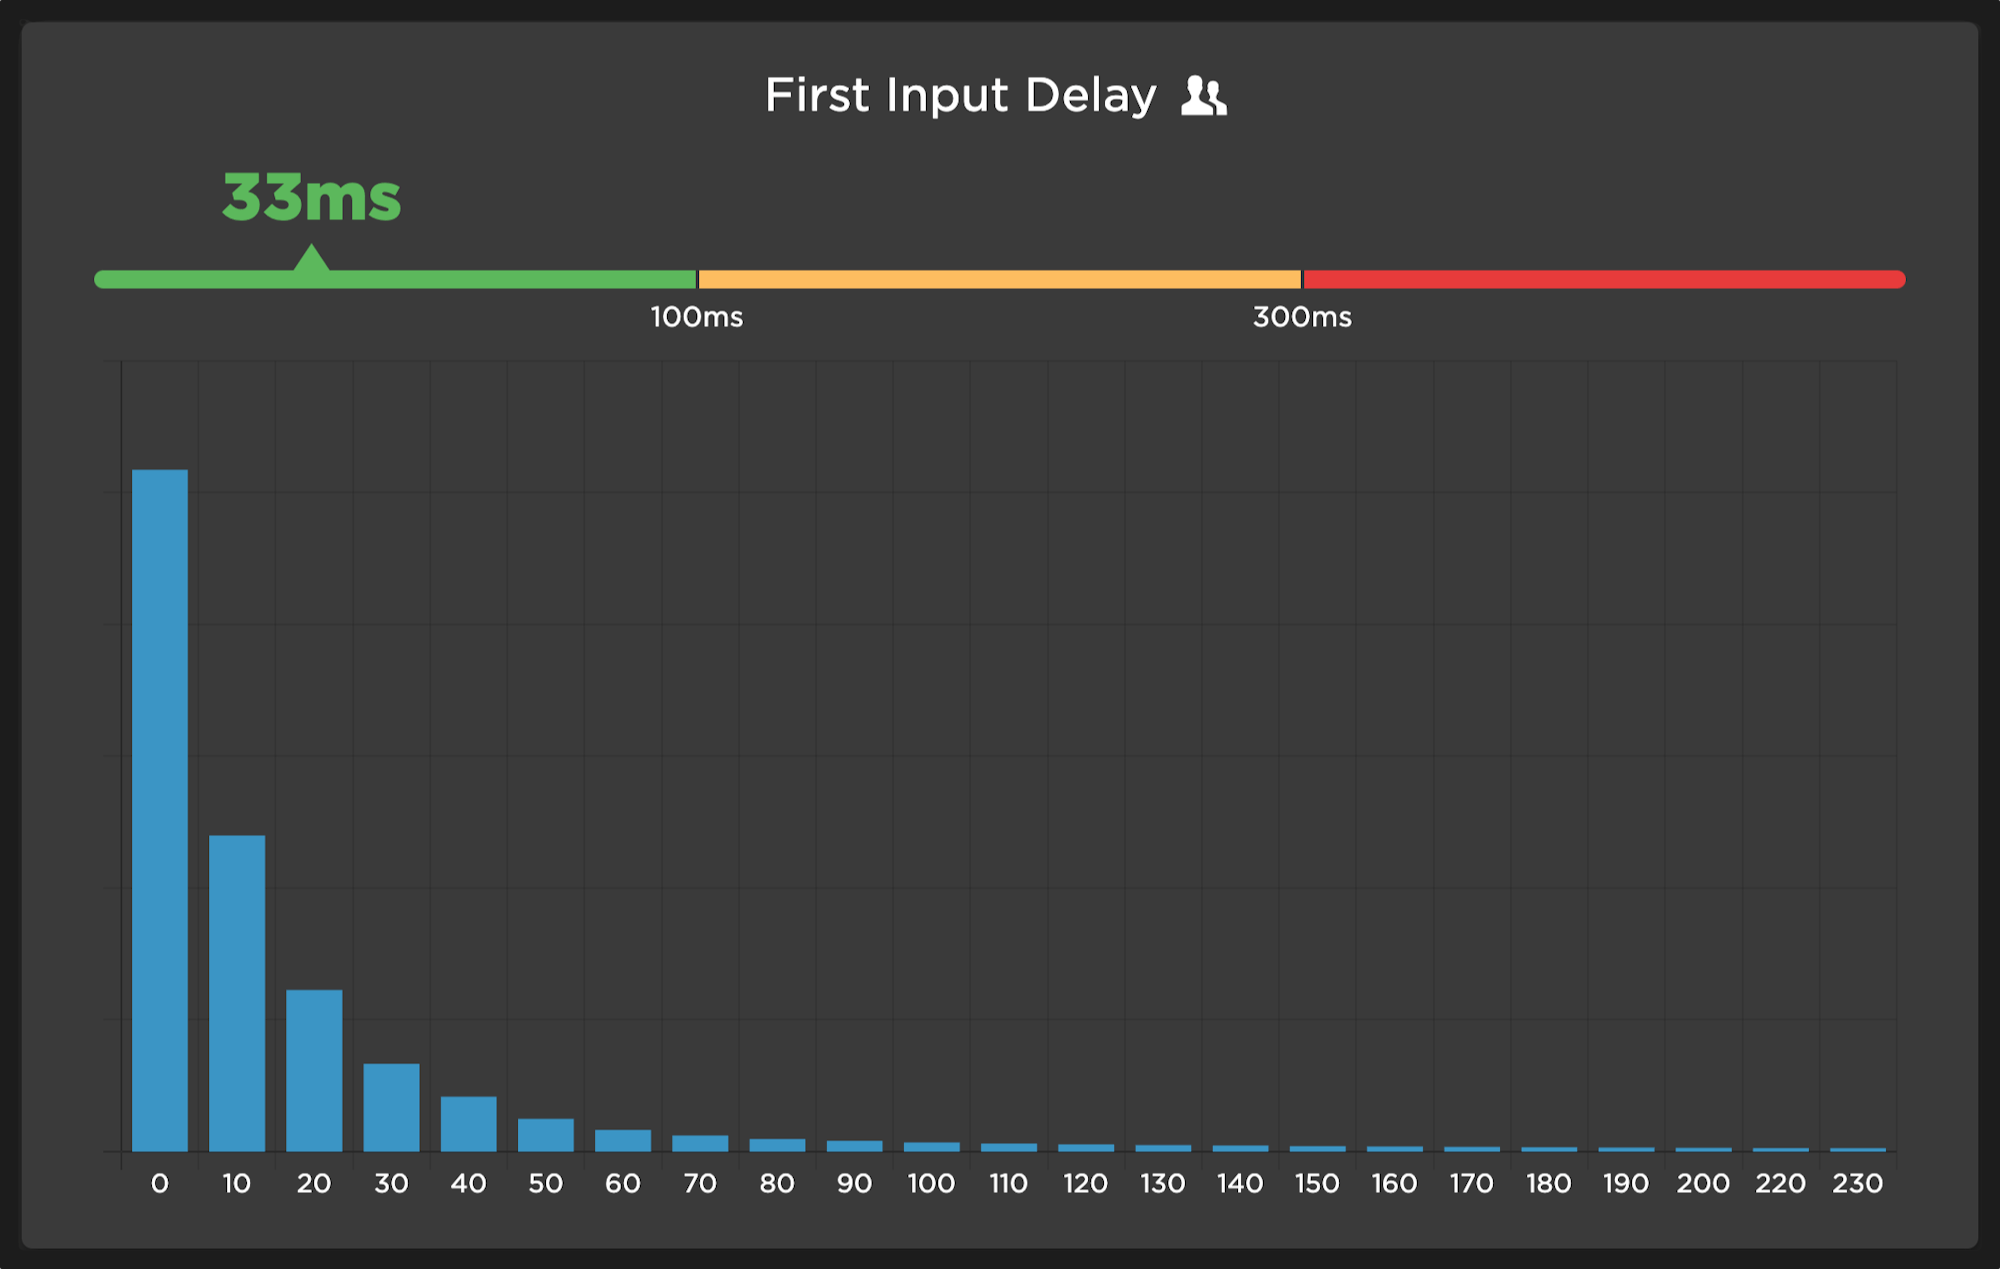
Distribution of FID across the web (Source: SpeedCurve RUM)
Green is good, right? So far it appears site owners are doing a stellar job of managing long tasks to ensure they aren't having a negative impact on user interaction with the page.
Maybe there really isn't much work to do here to keep your users happy? Not so fast!
While FID appears to be pretty low for most, long tasks are a big problem across the web. At the 75th percentile, the Long Tasks (sum of long tasks on a page) come in much higher at 2,286ms. Whoa.
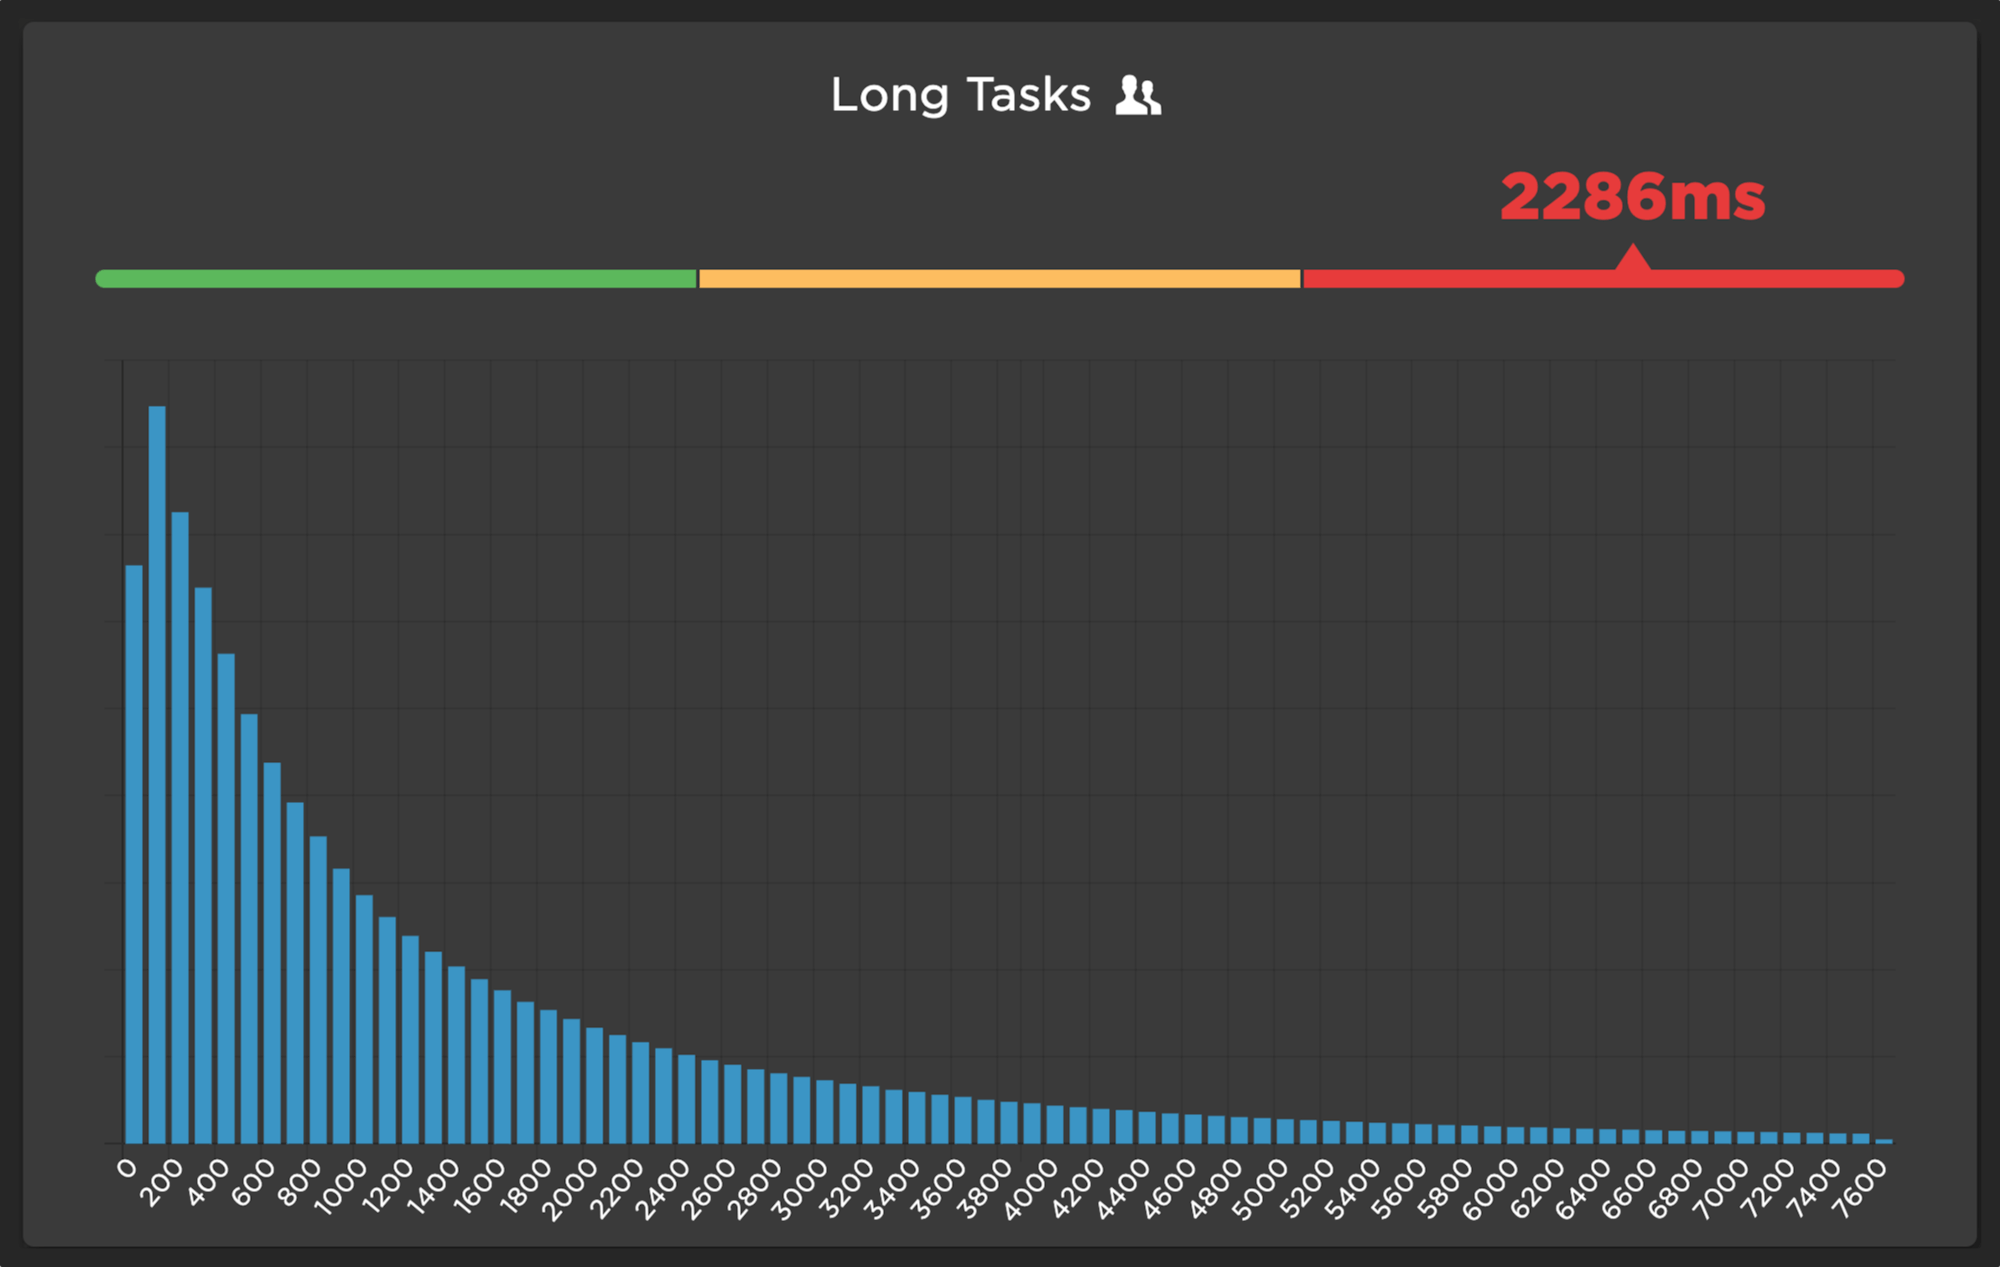
Distribution of Long Tasks across the web (Source: SpeedCurve RUM)
While there is some solace taken by the fact FID is so low across the board, the impact that long tasks are having on user experience might be masked if you're not careful. How, you ask? Keep reading...
Measuring interaction
At SpeedCurve, we measure input delay, but we also feel it's important to measure when the user interacts with the application. We call these "interaction (IX) metrics". We measure the first interaction of a user and break that down by the type of interaction (key press, click/tap, and scroll). For the purpose of this research, we will exclude scroll interactions in order to align with FID.
Steve wrote a great post mentioning the fact that the majority of user interactions happen later in the page life cycle. Today, when looking at first input times we continue to see them happening a good while after the more "common" event timings we are familiar with. When looking at the load event for comparison, we can see that the first input occurs very late. In fact, when we exclude scrolling, ~80% of pages have a first interaction after the load event.

Page experience timeline illustrating typical sequence of metrics. Values represent the 75th percentile for each metric.
This is arguably why FID times seem relatively small and quite optimistic when looking at the impact on Web Vitals. The majority of those pesky, CPU eating long tasks have completed already!
While we are certain that long tasks have an impact on the page experience, on the surface it doesn’t look like there is an inherent relationship between long task time and FID. What we can tell you, not surprisingly, is that long tasks have a strong correlation with interaction times, as shown here.
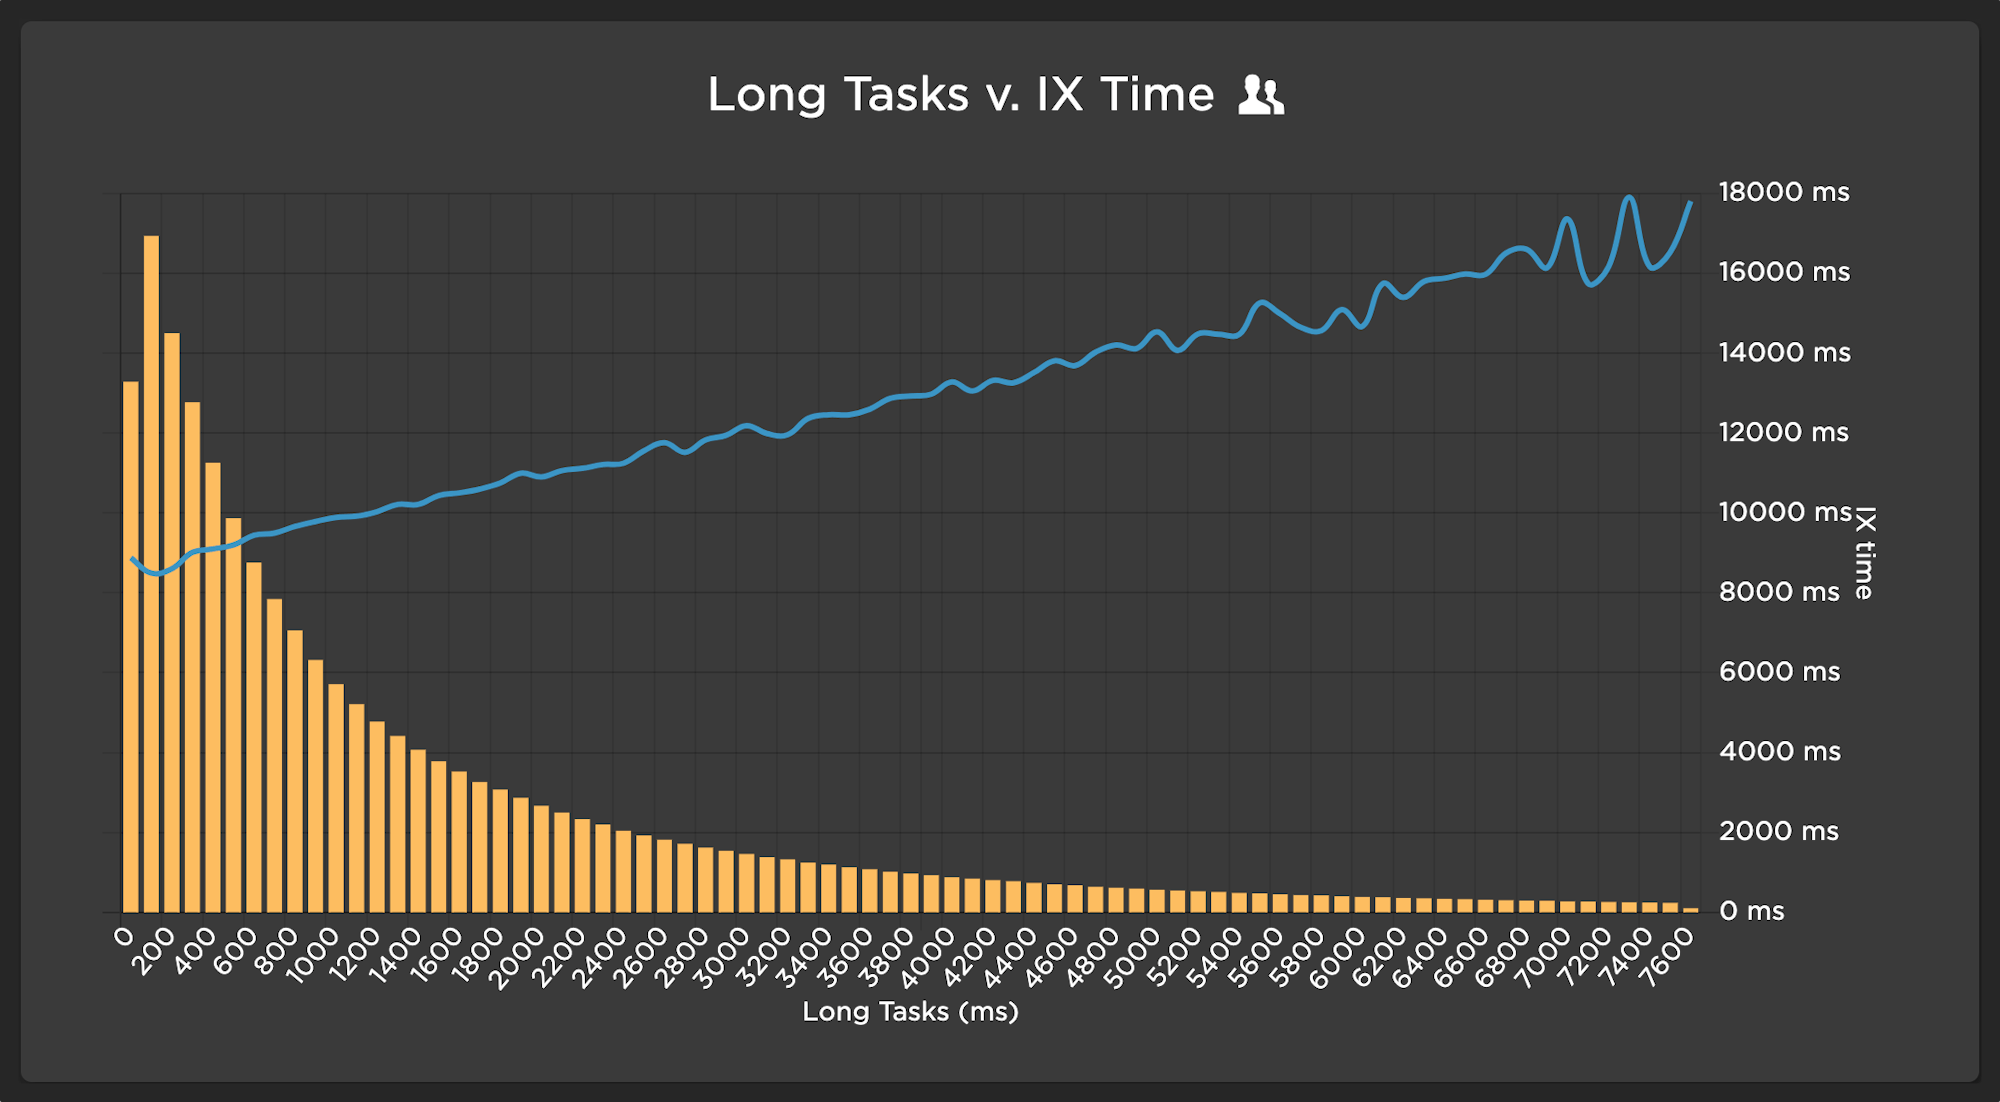
Distribution of Long Tasks correlated with IX times at the 75th percentile (Source: SpeedCurve RUM)
Okay, so more long task time means higher IX time – got it. But does that really matter? Do increased IX times have an impact on anything else? What about our friend FID?
How does all this correlate with user behavior?
Looking at the impact of a metric on user behavior is something we prioritize at SpeedCurve. There are a quite a few behavioral outcomes you can look at to determine correlation or impact of a given performance metric. Bounce rate is a good universal metric to look at across a large population of sites.
For FID, a bounce may not be the best indicator because, presumably, bounced sessions wouldn't have much (if any) interaction. So instead, we took a look at how these metrics related to user behavior for a number of randomly chosen commerce sites. Traffic for these sites has been extremely high, given increased online activity due to COVID, not to mention the huge volume of cyber shopping happening as we speak. We explored how these two metrics (FID and JS Long tasks) correlate with $$$ conversions $$$.
Findings
FID doesn't seem to have any meaningful correlation with conversion. That is, unless it's bad.
Most sites showed this same, inconclusive pattern – mostly due to the fact that, as we've already seen, FID is just not all that high for the majority of sites.
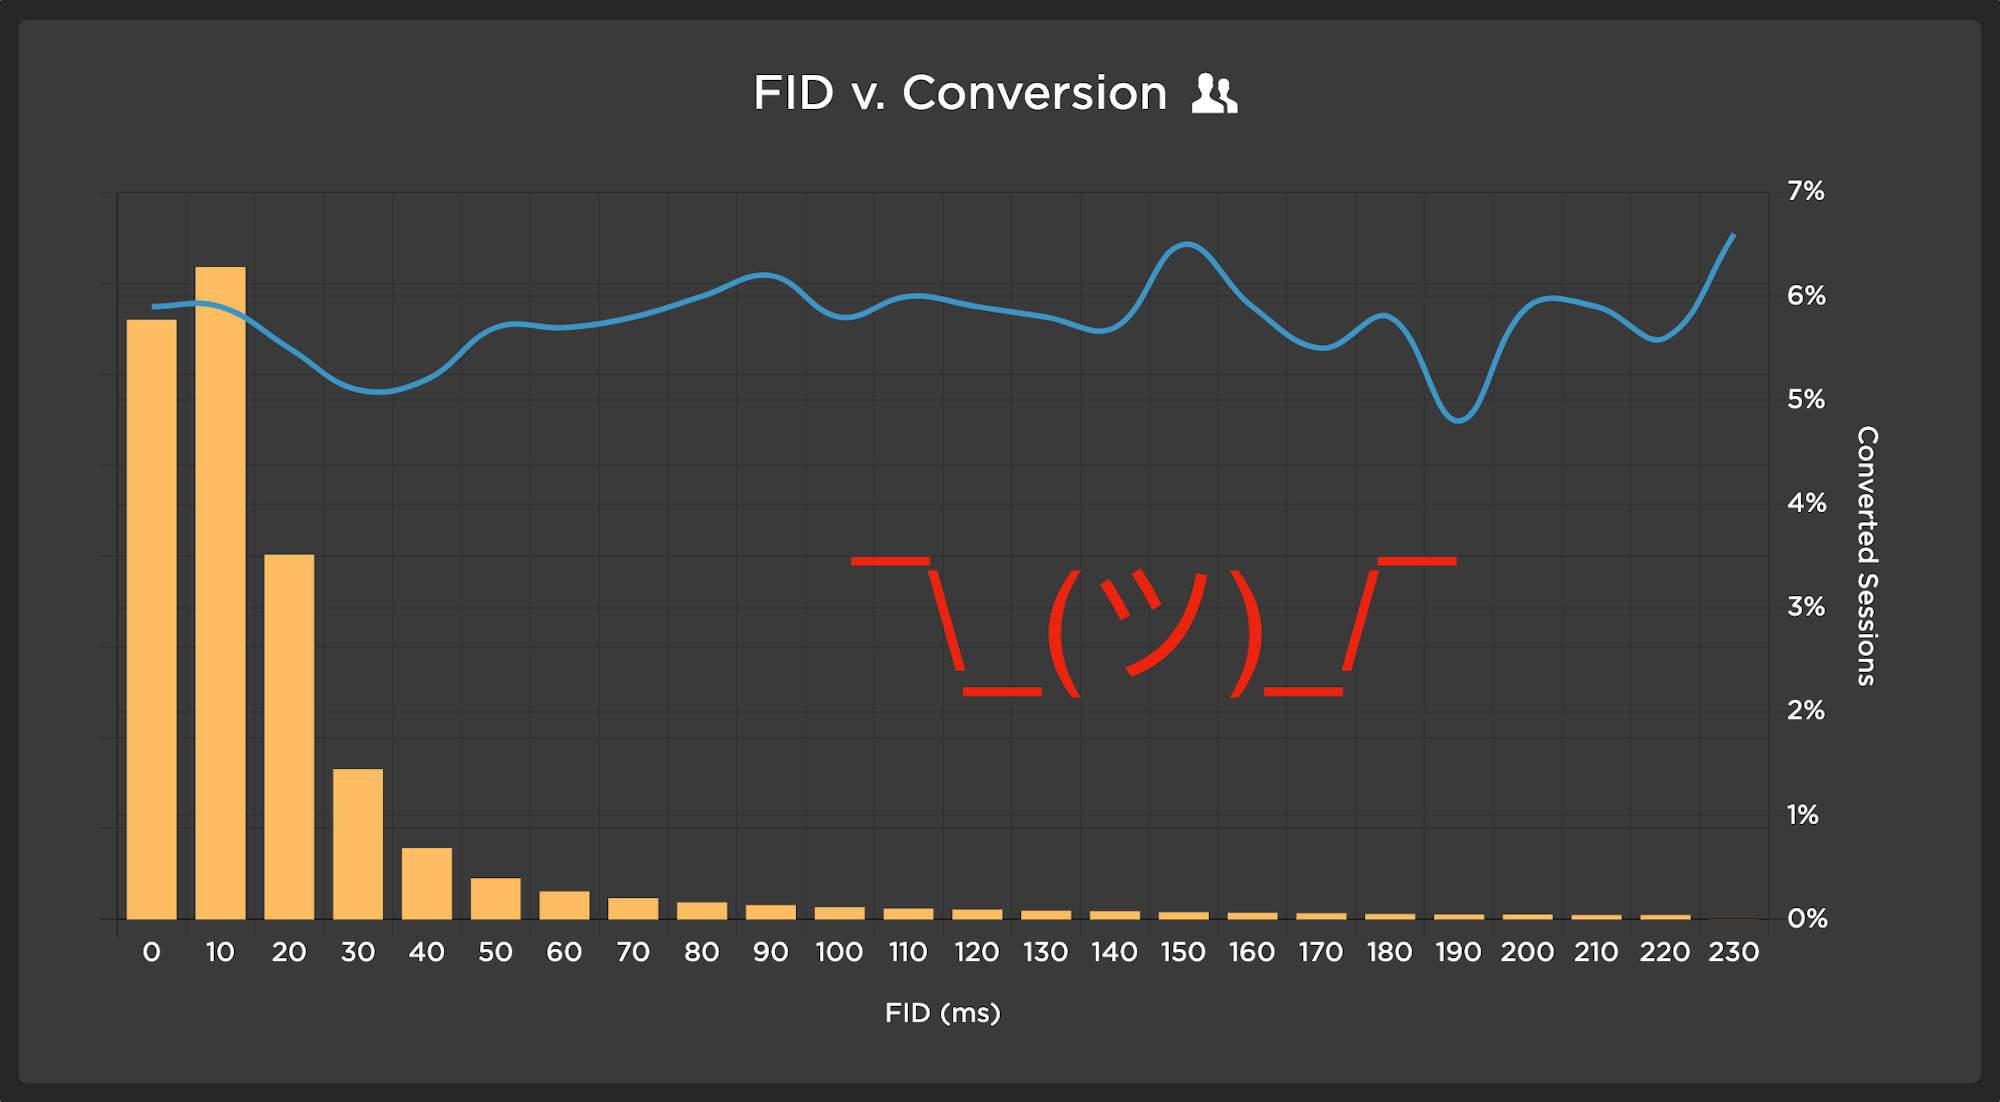
Distribution of FID vs. Converted Sessions shows no correlation (Source: SpeedCurve RUM)
In the sites investigated, there was one exception that serves as an indicator for sites where FID creeps toward the slower end of the spectrum. The 75th percentile for this site is ~60ms, which remains in the 'good' range (under 100ms). The impact on conversion rates tells a different story. For sessions that had a FID over 20ms, there was a notable decline in conversion rates, bottoming out around the 60ms range.
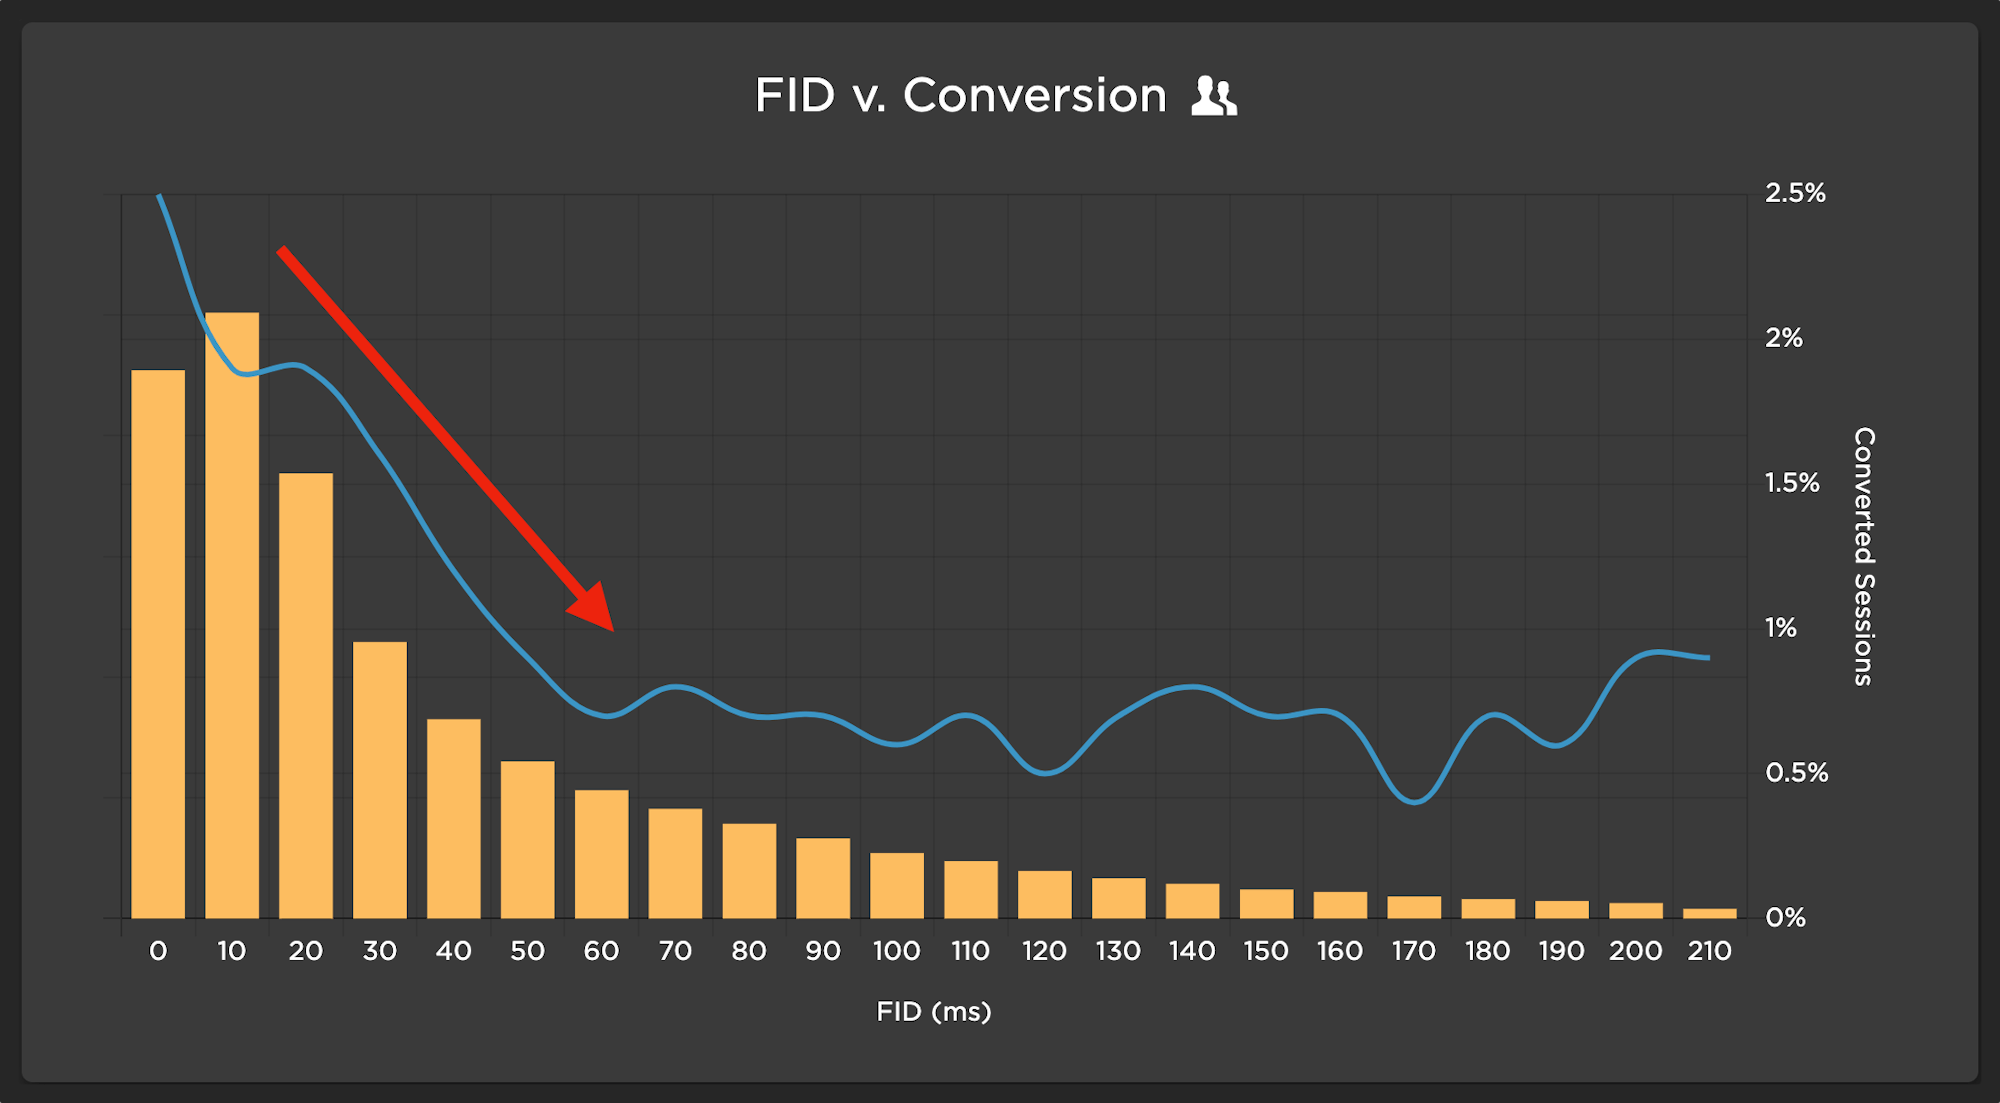
Distribution of FID vs. Converted Sessions correlating with slower FID (Source: SpeedCurve RUM)
In a stark comparison, long tasks appear to have a high correlation across the board. There really isn't much room for patience when long tasks approach a full second or more. While the chart below shows a correlation with full session data, the same pattern was seen at the page level for various page types, including home/landing pages, product/browse pages, and pages in the checkout flow.
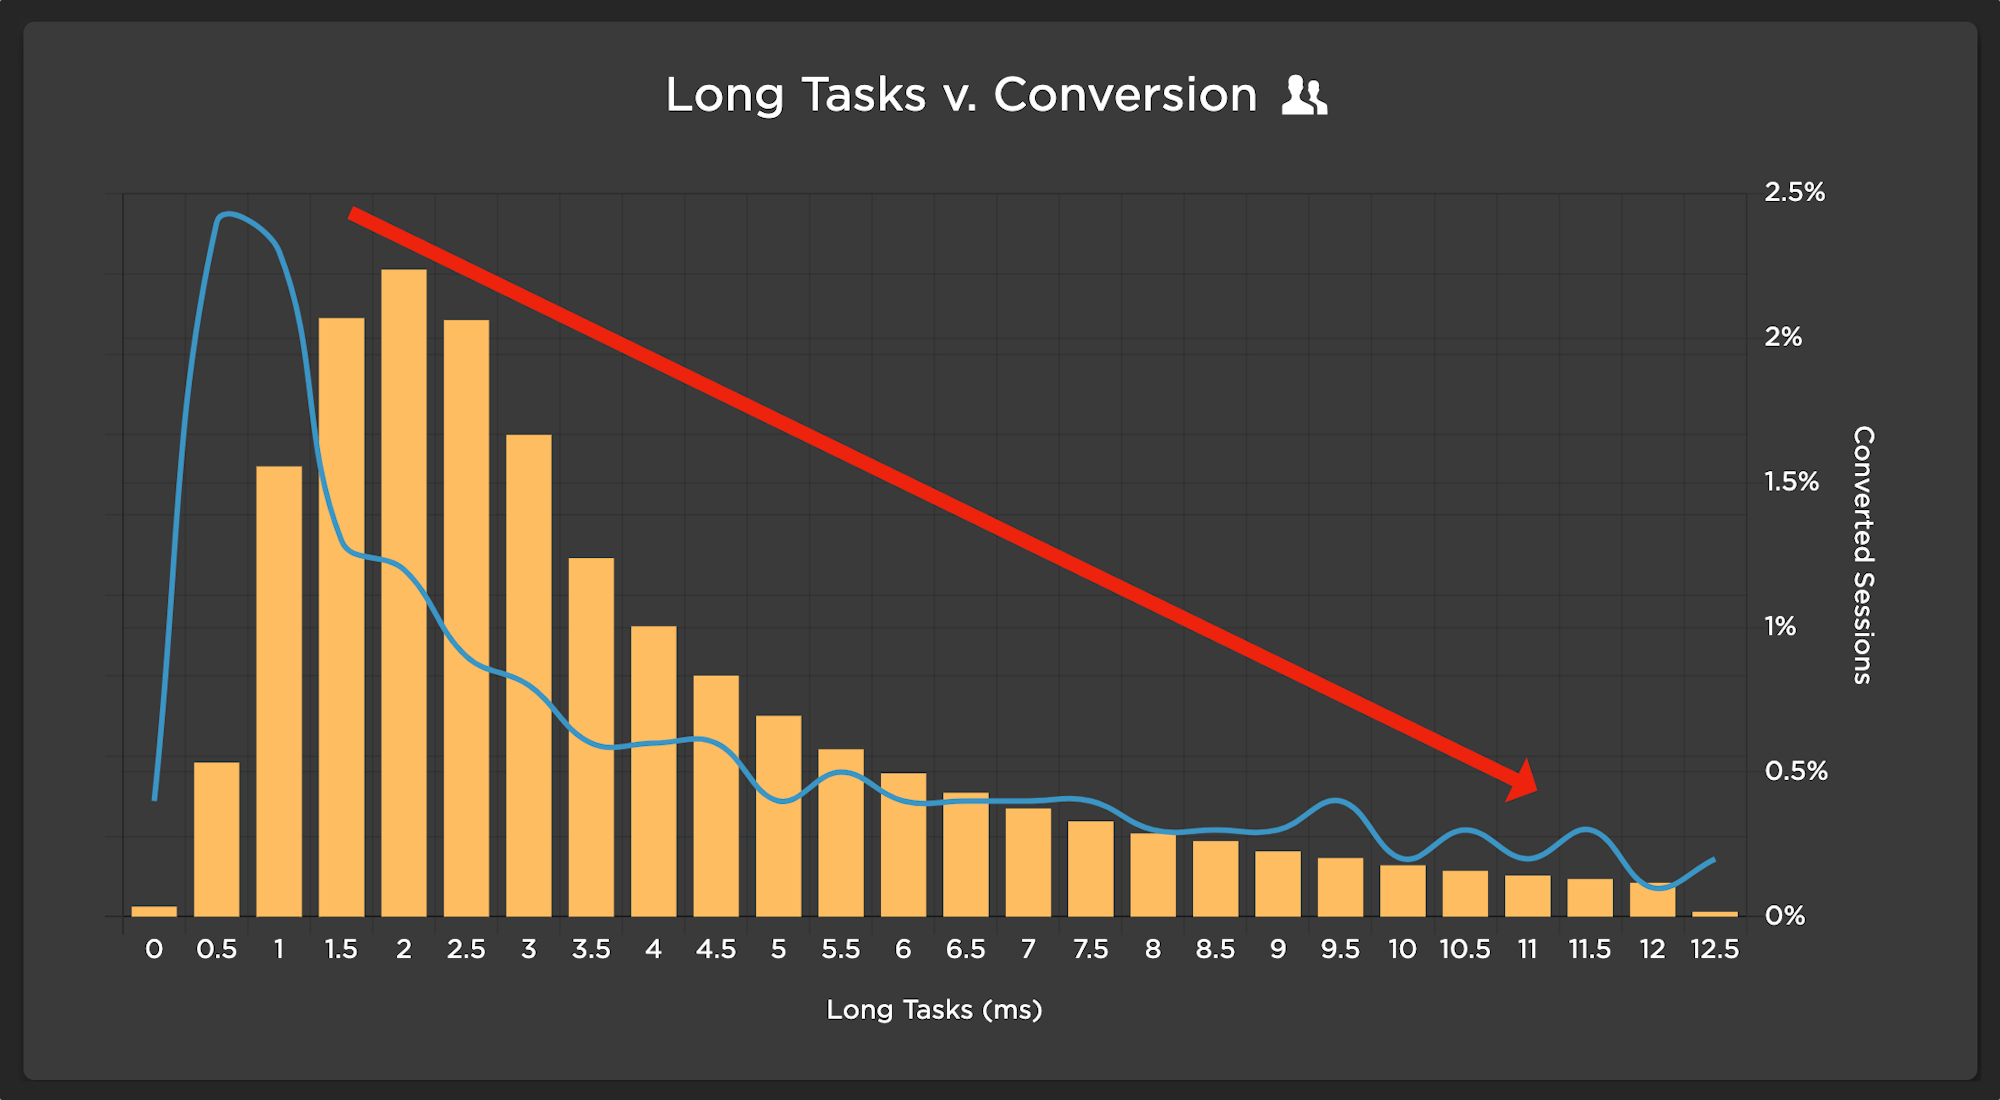
Distribution of Long Tasks vs. Converted Sessions consistently shows an impact on shopping behavior
So, what does it all mean?
There is a real risk that if you are relying solely on FID to get a handle on your JS problem, you are missing the boat at the expense of your users.
Don’t get us wrong. Understanding FID is very important. This is especially true if you find yourself on the "needs improvement" (red is bad!) side of the Vitals spectrum. Perhaps we should entertain a reset of the current threshold for this Vital. Instead of a 100ms threshold, we might want to consider setting the bar a bit higher (lower, actually) to 50ms – or, alternatively, no long tasks occurring within the FID window – as a goal for your application.
In addition to FID, here are some available metrics in SpeedCurve we suggest you focus on to get a grip on your JavaScript problem:
- Long Tasks:
- Long tasks: Total time attributed to long tasks on a page from the start of navigation
- Number of long tasks: The total number of individual long tasks occurring in a page
- Longest JS task: The longest pole in the tent. Start your journey here and use synthetic monitoring to identify the source.
- Interaction times: While not always something you can optimize for, this context is very helpful when understanding how a user responds to your application and exactly where FID occurs. While we excluded scroll interactions, this context is important as well when looking at optimizing JavaScript tasks to avoid the janky, slow experience your users dread.
What does your own data tell you?
We explored a LOT of data for this post. While we certainly saw some common trends, we always encourage you to look at your own data. Core Web Vitals are now supported across several RUM products. If you don't have RUM or are curious about how you can use SpeedCurve to do you own analysis, you can get started here.


