How to automatically test the performance of your GitHub pull requests


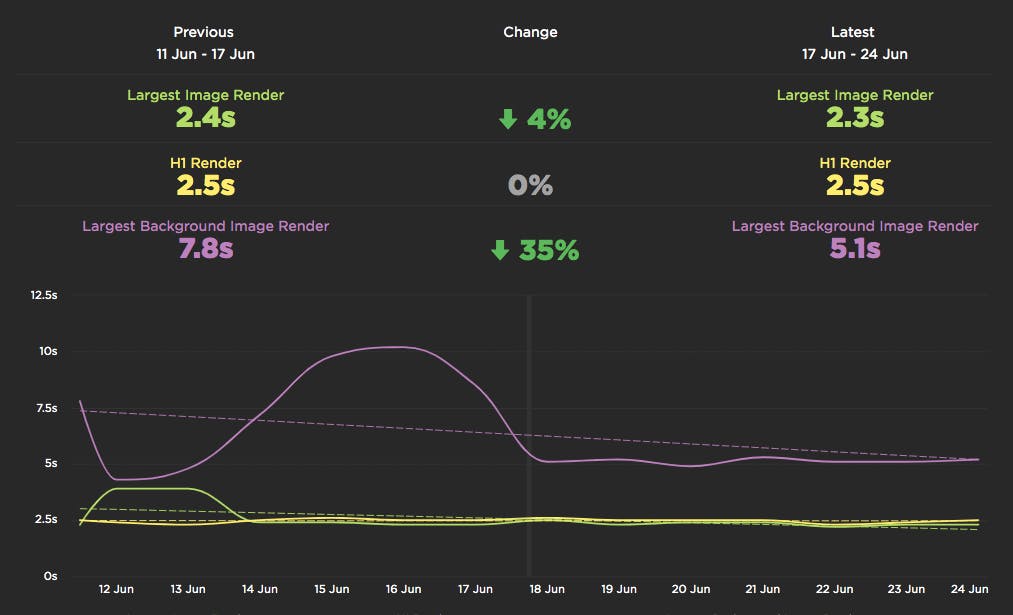
As highlighted in our December product update, we've been making a lot of improvements in the area of CI/CD. In addition to the new Deployments dashboards and Notes updates, we've launched a new GitHub integration. Our purpose in building this integration is to lower the barrier for getting web performance feedback for your code changes, directly in the environment you are working in.
Follow along below for an example of how you can use this integration in practice to fight web performance regressions and keep your pages fast.
New! User Happiness metric, CI plugin, and an inspiring third-party success story

Here at SpeedCurve, the past few months have found us obsessing over how to define and measure user happiness. We've also been scrutinizing JS performance, particularly as it applies to third parties. And as always, we're constantly working to find ways to improve your experience with using our tools. See below for exciting updates on all these fronts.
As always, we love hearing from you, so please send your feedback and suggestions our way!

Getting started with web performance? Here's what you need to focus on.
A while back, our friends at Shopify published this great case study, showing how they optimized one of their newer themes from the ground up – and how they worked to keep it fast. Inspired by that post, I wanted to dig a bit deeper into a few of the best practices they mentioned, which fall loosely into these three buckets:
- Analyze your pages – understand the critical rendering path and page composition.
- Create performance budgets and fight regression.
- Build a performance culture that embraces collaboration between design and dev.
Keep reading to learn how you can apply these best practices to your own site and give your pages a speed boost.
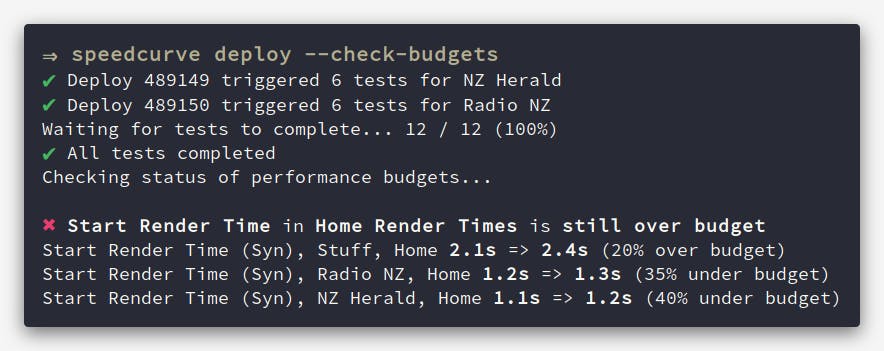
Performance testing in CI: Let's break the build!
Raise your hand if you've ever poured countless hours into making a fast website, only to have it slowly degrade over time. New features, tweaks, and Super Important Tracking Snippets all pile up and slow things down. At some point you'll be given permission to "focus on performance" and after many more hours, the website will be fast again. But a few months later, things start to slow again. The cycle repeats.
What if there was a way that you could prevent performance from degrading in the first place? Some sort of performance gateway that only allows changes to production code if they meet performance requirements? I think it's time we talked about having performance regressions break the build.
The language and metrics of UX evolve at Velocity 2015

Originally published on the O'Reilly Radar Blog
I’ve attended four O’Reilly Velocity conferences over the last year, and I was struck by a notable shift in the conversations at Velocity in Santa Clara, Calif. Many speakers and attendees have started to change their language and describe the experience of their websites and apps from the user’s perspective.
The balance has shifted from just talking about how fast or reliable a particular system is to the overall experience a user has when they interact with and experience a product. Many people are now looking at themselves from the outside in and developing more empathy for their users. The words “user” and “user experience” were mentioned again and again by speakers.
Here are recent talks from Velocity and other events that highlight this shift to UX concerns.
Velocity: Better performance through better design
Improve web performance by improving your design process… it needs to be iterative, mindful, principled and visual.
At my third Velocity conference for the year (this time in beautiful Barcelona) my keynote presentation explored the ways in which a thoughtfully developed design process can lead to higher functioning teams and better web performance.
Velocity: A better waterfall chart
The way we visualize performance data can have an impact on how we interpret and communicate performance issues within our teams.
In this talk from Velocity New York I explored the importance of data visualization and presented some of my own explorations into re-imagining the classic waterfall chart which is the mainstay of front-end performance analysis.
Skip to 15:30 if you just want to see the data visualization experiments.
One of these experiments was also turned into a performance heatmap bookmarklet.
Velocity: Responsive in the wild
I was lucky enough to give a Lighting Demo at Velocity Conference in Santa Clara. The focus was on research I conducted into 250 responsive websites and how well optimized for performance they were.