First Input Delay: How vital is it?
We’ve been pretty vocal about Core Web Vitals since Google announced this initiative last spring. We love the idea of having a lean, shared set of metrics that we can all rally around – not to mention having a broader conversation about web performance that includes teams throughout an organization.
For many site owners, the increased focus on Core Web Vitals is driven by the fact that Google will be including them as a factor in search ranking in May 2021. Other folks are more interested in distilling the extremely large barrel of performance metrics into an easily digested trinity of guidelines to follow in order to provide a delightful user experience.
We’ve had some time to evaluate and explore these metrics, and we're committed to transparently discussing their pros and cons.
The purpose of this post is to explore First Input Delay (FID). This metric is unique among the three Web Vitals in that it is can only be measured using real user monitoring (RUM), while the other two (Largest Contentful Paint and Cumulative Layout Shift) can be measured using both RUM and synthetic monitoring.
In this post we'll cover:
- What is FID?
- What does FID look like across the web?
- The importance of measuring user interactions
- How JavaScript affects user behavior
- Suggestions for how you can look at FID in relation to your other key metrics
Let's dig in!
Measuring Blocking Resources
SpeedCurve reports the number of critical blocking resources in the page. These are the resources that block rendering. Since it's important that users see your content as quickly as possible, it's important to know what might be causing your page to render slowly. We recently enhanced the way we measure blocking resources and wanted to share those improvements with our customers as well as the performance community at large.
The main culprits that block rendering are scripts and stylesheets that are loaded synchronously. A great way to avoid this blocking problem is to load your scripts and stylesheets asynchronously. You can do that for scripts by using the async and defer attributes, plus other programmatic techniques. Loading stylesheets asynchronously is less popular but is still possible using techniques like loadCSS.
Critical Blocking Resources
At SpeedCurve, we focus on metrics that capture the user experience. A big part of the user experience is when content actually appears in front of the user. Since stylesheets and synchronous scripts are the culprits when it comes to blocking rendering, we've rolled out some new metrics that focus on these critical blocking resources.
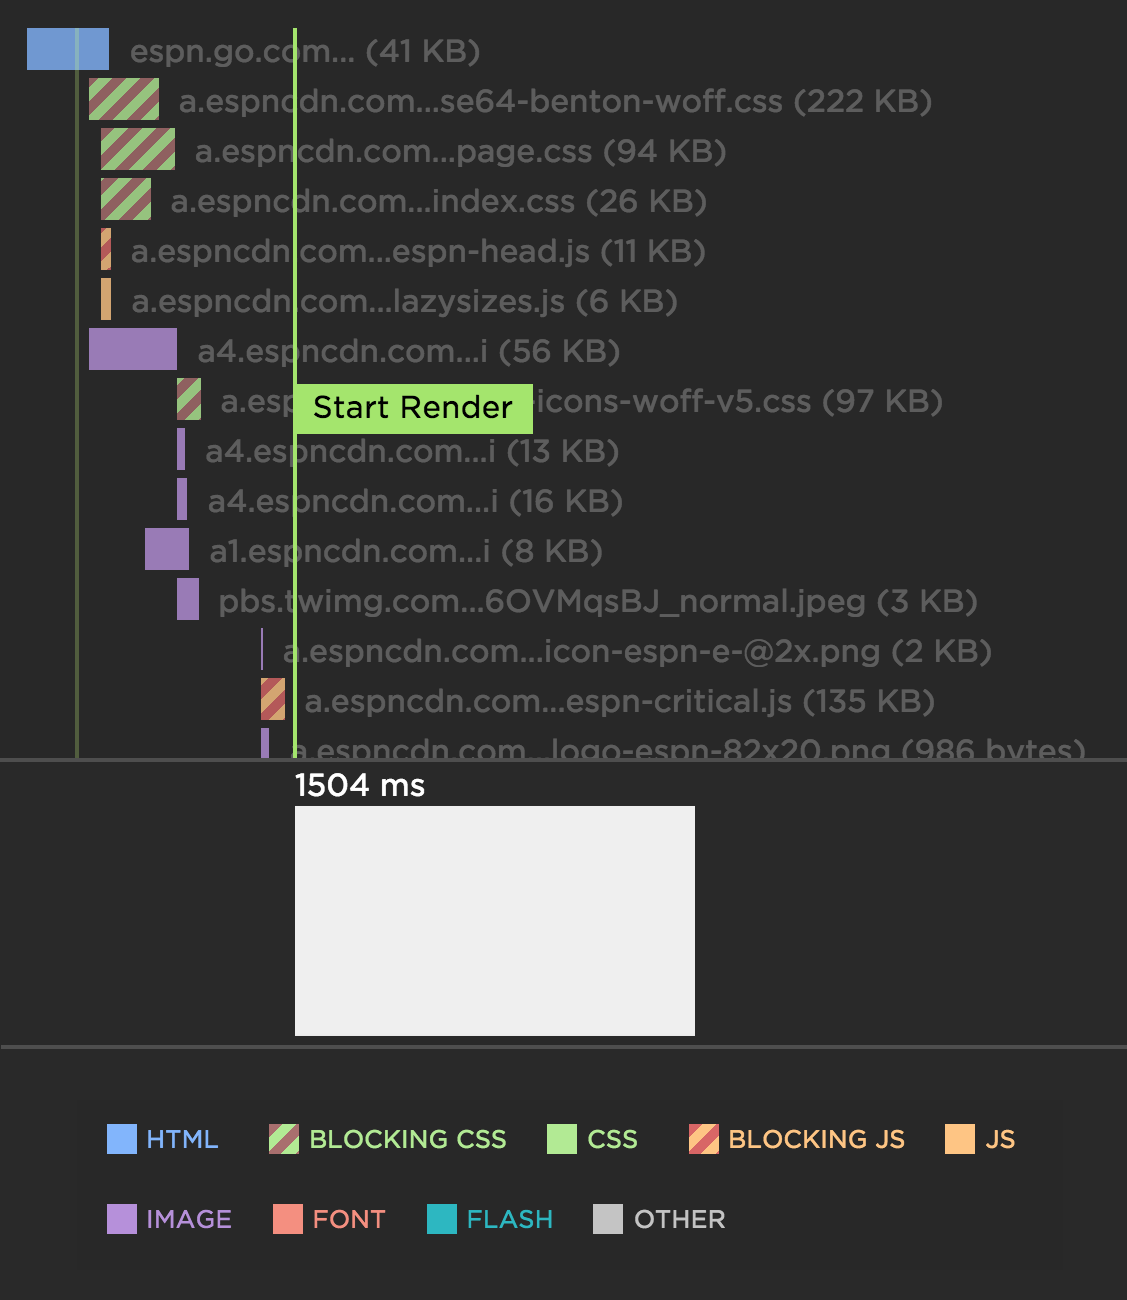
The most helpful innovation we made is to highlight the critical blocking stylesheets and synchronous scripts in our waterfall charts. In the following example waterfall chart for ESPN, notice how the critical stylesheets (green) and synchronous scripts (orange) have a red hash pattern. Not surprisingly, the Start Render metric is delayed until after the last of these critical blocking resources is done loading. The "scrubber" at the bottom of the waterfall (showing the screenshot at that point in time) confirms that rendering has been blocked up to this point. Explore an example of a interactive waterfall chart.


