Track down front-end CPU hogs

Often when monitoring and debugging site performance we focus on network activity and individual resources, but what about the CPU? As more and more sites switch to using large Javascript frameworks and manipulating the page using Javascript, the execution time this code takes and the available CPU can instead become the performance bottleneck.
CPU usage for all Chrome tests
For any of SpeedCurve's Chrome-based tests, including emulated devices, we capture the Chrome Dev Tools timeline. From the browser main thread usage in the timeline we extract how busy the CPU is and what it's spending time on. Is it busy executing Javascript functions or busy laying out elements and painting pixels?
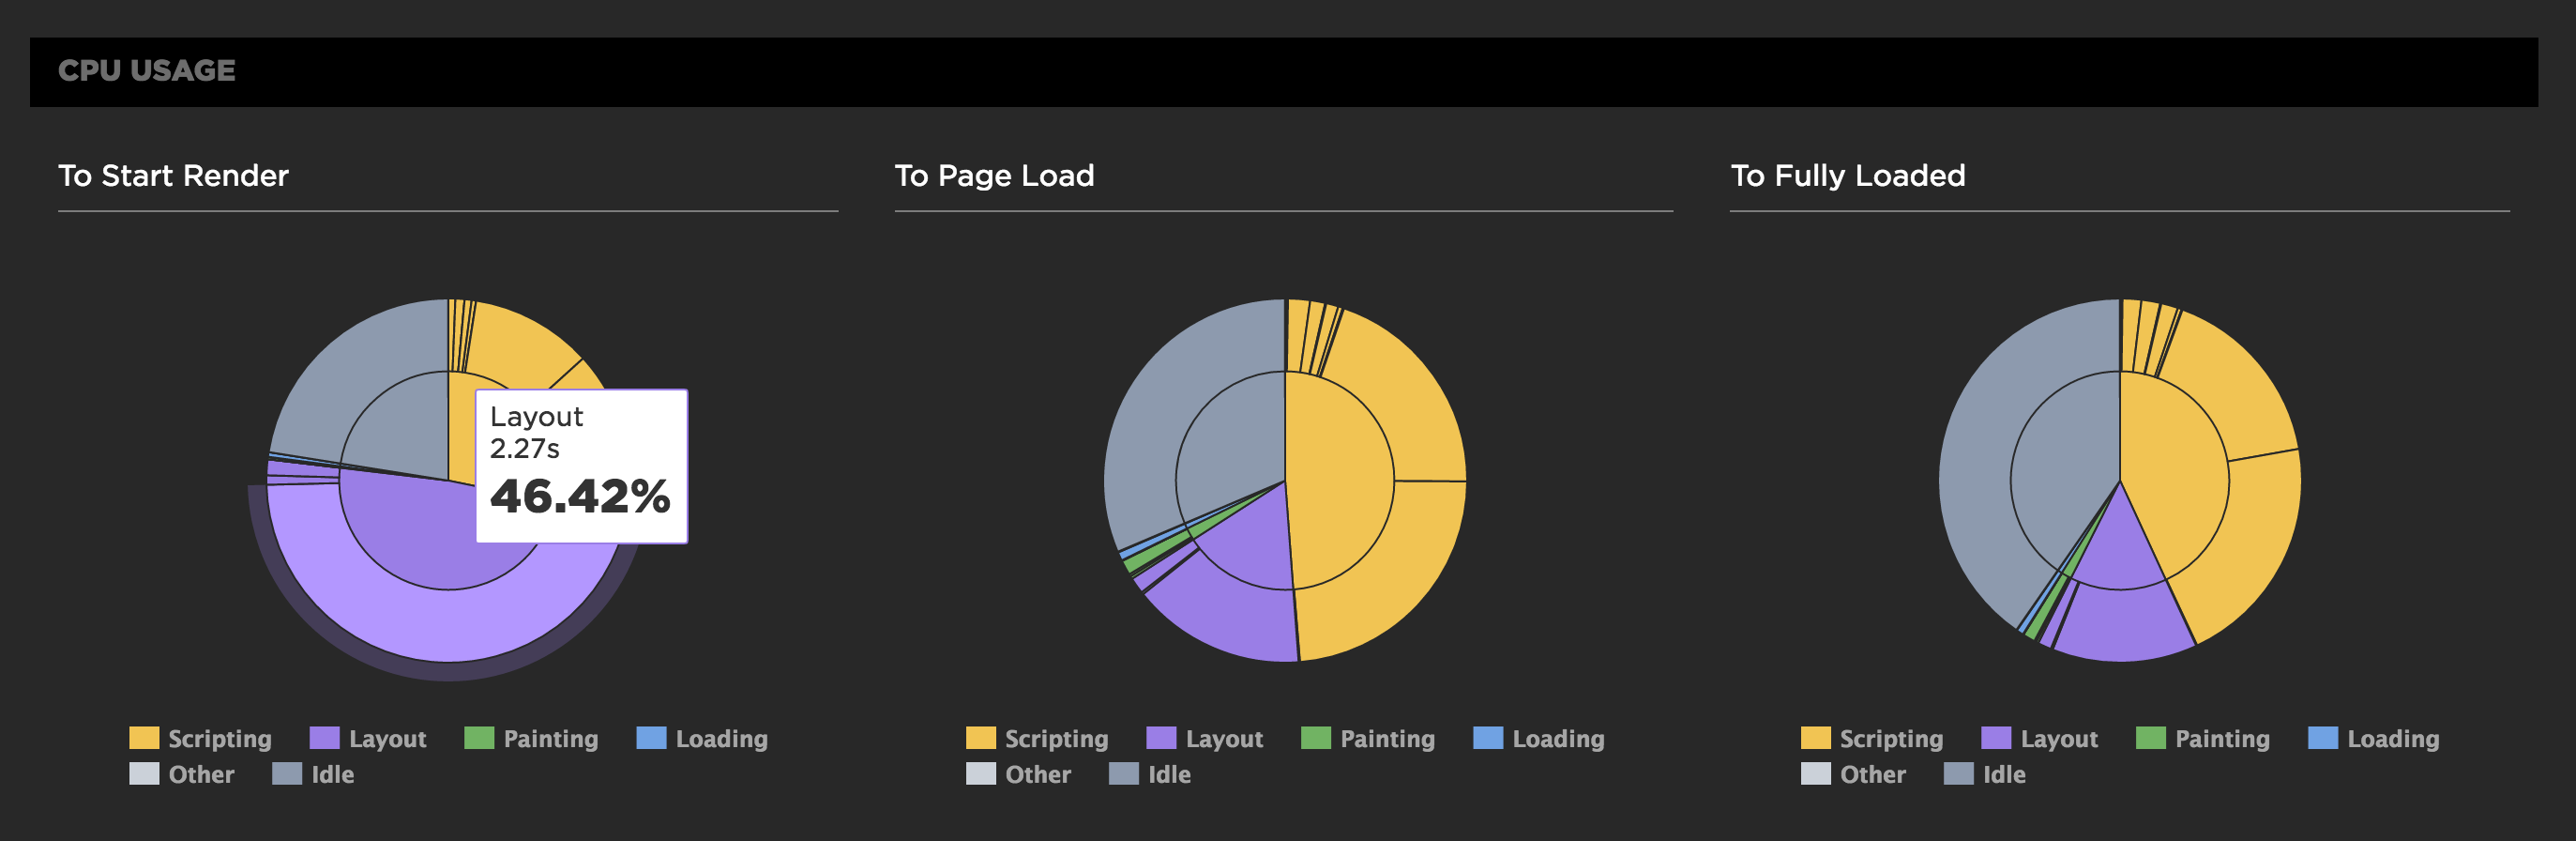
We also measure the CPU usage to different key events in the rendering of the page. SpeedCurve's focus is on the user experience and getting content in front of people as fast as possible, so we show you what the CPU is doing up till the page starts to render. This reflects CPU usage during the browser critical rendering path and can highlight various issues. If there's lots of CPU idle time then you're not delivering your resources efficiently. You want to get the CPU busy nice and early rendering the page, rather than sitting idle waiting for slow resources.
In the test below we see in the first pie chart that the CPU is spending a lot of time on layout up to the start render event, which is quite a different picture from the Fully Loaded CPU usage.
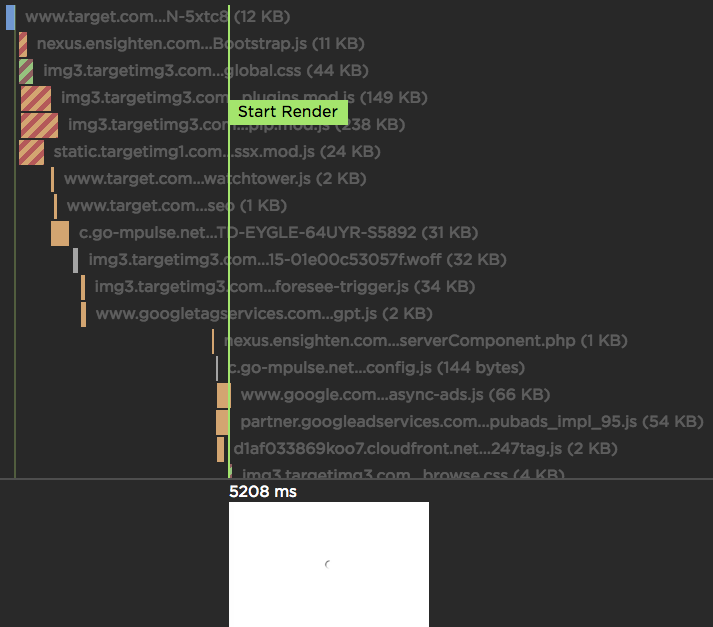
SpeedCurve Waterfall

If you're a performance engineer, then you're familiar with waterfall charts. They are found in browser dev tools as well as other performance services. I use multiple waterfall tools every day, but the waterfall chart I love the most is the one we've built at SpeedCurve: