SpeedCurve is now part of the Embrace family! There are no changes to how you use our products. Our founder Mark shares what this means...
NEW! A trickle of updates to your waterfall charts

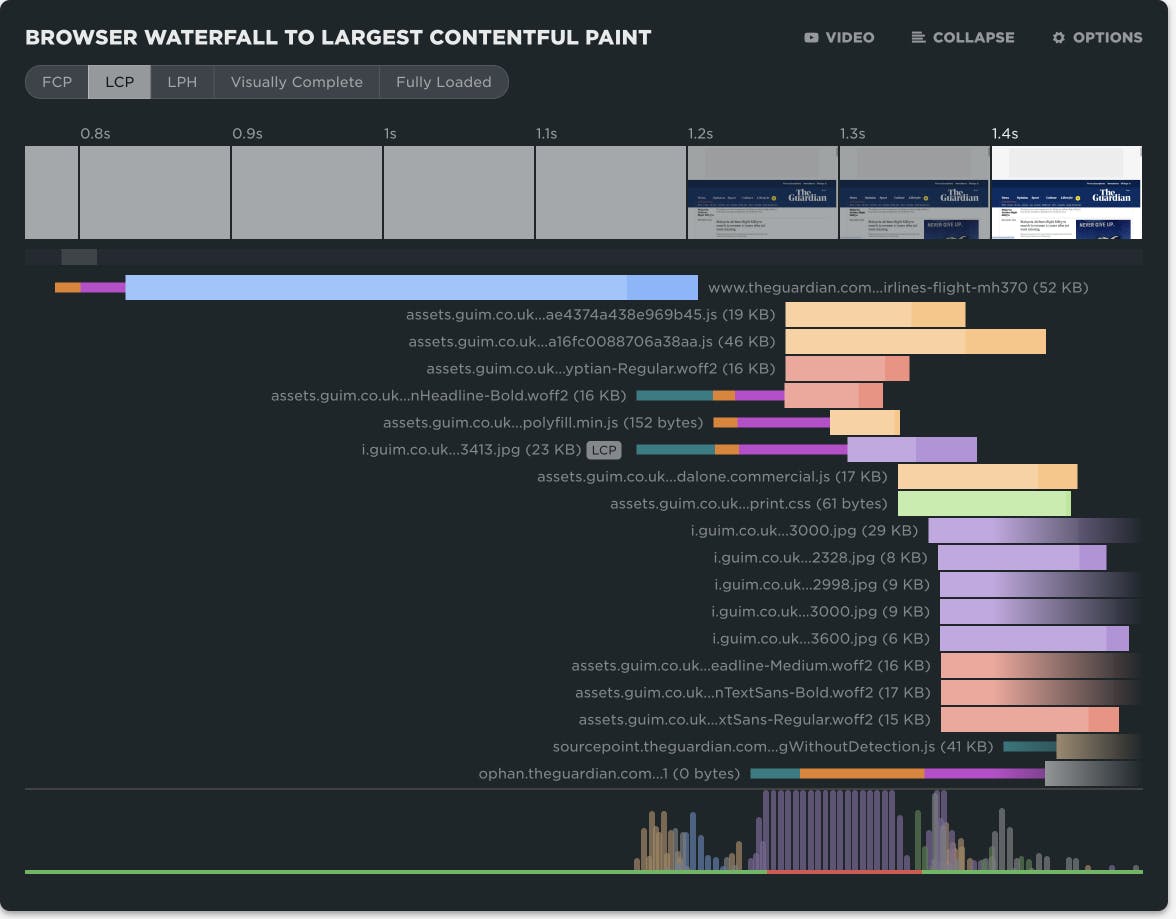
Waterfall charts are the workhorse of any web performance enthusiast. SpeedCurve's interactive waterfall is one of the first components I designed and built more than a decade ago. I've just given our much-loved waterfall chart some team-inspired updates that you may find helpful in understanding how page construction affects important user experience metrics.
At SpeedCurve, we love incremental updates based on both external and internal user feedback. We dogfood our own products, and while consulting with customers, our in-house performance expert Andy Davies is often confronted by the gulf between a customers questions and how he might answer those questions using the data we collect and the visulizations we wrap around it.
It's not always easy. Making data visible doesn't automatically mean it's useful in answering questions about the intersection of web performance and user behaviour.
Three years ago Andy asked me for a feature in the waterfall chart. I added it straight away, and to this day Andy has never discovered or used the feature!
"Wait, you can do that?" ~ Andy
If Andy uses SpeedCurve everyday, knows it inside out, and still can't stumble across a three-year-old feature, that's not Andy's problem. That's a problem with complexity in the user interface and feature discoverability. It's a common problem as software matures and features get layered on top of each other. What started out simple and easy to explore becomes complex and hidden behind a myriad of options.
Today I'm taking a crack at removing some options in the waterfall to reduce complexity and choice while exposing better defaults.
I'm hoping Andy sees the changes this time around and it helps answer more of his questions...
The SpeedCurve family grows

I’m really excited to have become the latest member of the SpeedCurve family. I’ve known Mark for 20 years, since he started lecturing in design here in New Zealand. I was one of his first students and we’ve always kept in touch. Our careers have overlapped at various points, it’s the nature of a small country with an even smaller web design industry. I remember attending the Webstock conference where Mark first presented SpeedCurve in the Start-Up Alley competition. He won, netting the prize money and a trip to the USA to present his new startup. We all know how relevant and useful his startup has become and I’m thrilled to have this opportunity to get involved in its development.
Mark+Steve, Performance+Design

I'm excited to announce that I've joined SpeedCurve!
When SpeedCurve was just a twinkle in Mark's eye, he contacted me about the concept and I encouraged him that a commercial version of WebPageTest was needed. When I saw the early versions of SpeedCurve, I was blown away. Mark presents traditional performance data in a way that is more compelling, revealing his strong design background.
Mark has pioneered this new territory where performance and design overlap. It's exciting to say "overlap". Many times there's little interaction between designers and performance engineers. When there is interaction, it can feel adversarial with no one wanting to give any ground. And yet, designers and performance engineers are after the same thing: creating a great user experience!
Design and performance are connected, like the yin and yang. They aren't opposing forces, but instead complement each other. Users want an experience that is rich and fast. The trick is figuring out how to do that. That's where SpeedCurve comes in.
