SpeedCurve is now part of the Embrace family! There are no changes to how you use our products. Our founder Mark shares what this means...
NEW! RUM Compare dashboard

Exploring real user (RUM) data can be a hugely enlightening process. It uncovers things about your users and their behavior that you never might have suspected. That said, it's not uncommon to spend precious time peeling back the layers of the onion, only to find false positives or uncertainty in all that data.
At SpeedCurve, we believe a big part of our job is making your job easier. This was a major driver behind the Synthetic Compare dashboard we released last year, which so many of you given us great feedback on.
As you may have guessed, since then we've been hard at work coming up with the right way to explore and compare your RUM datasets using a similar design pattern. Today, we are thrilled to announce your new RUM Compare dashboard!
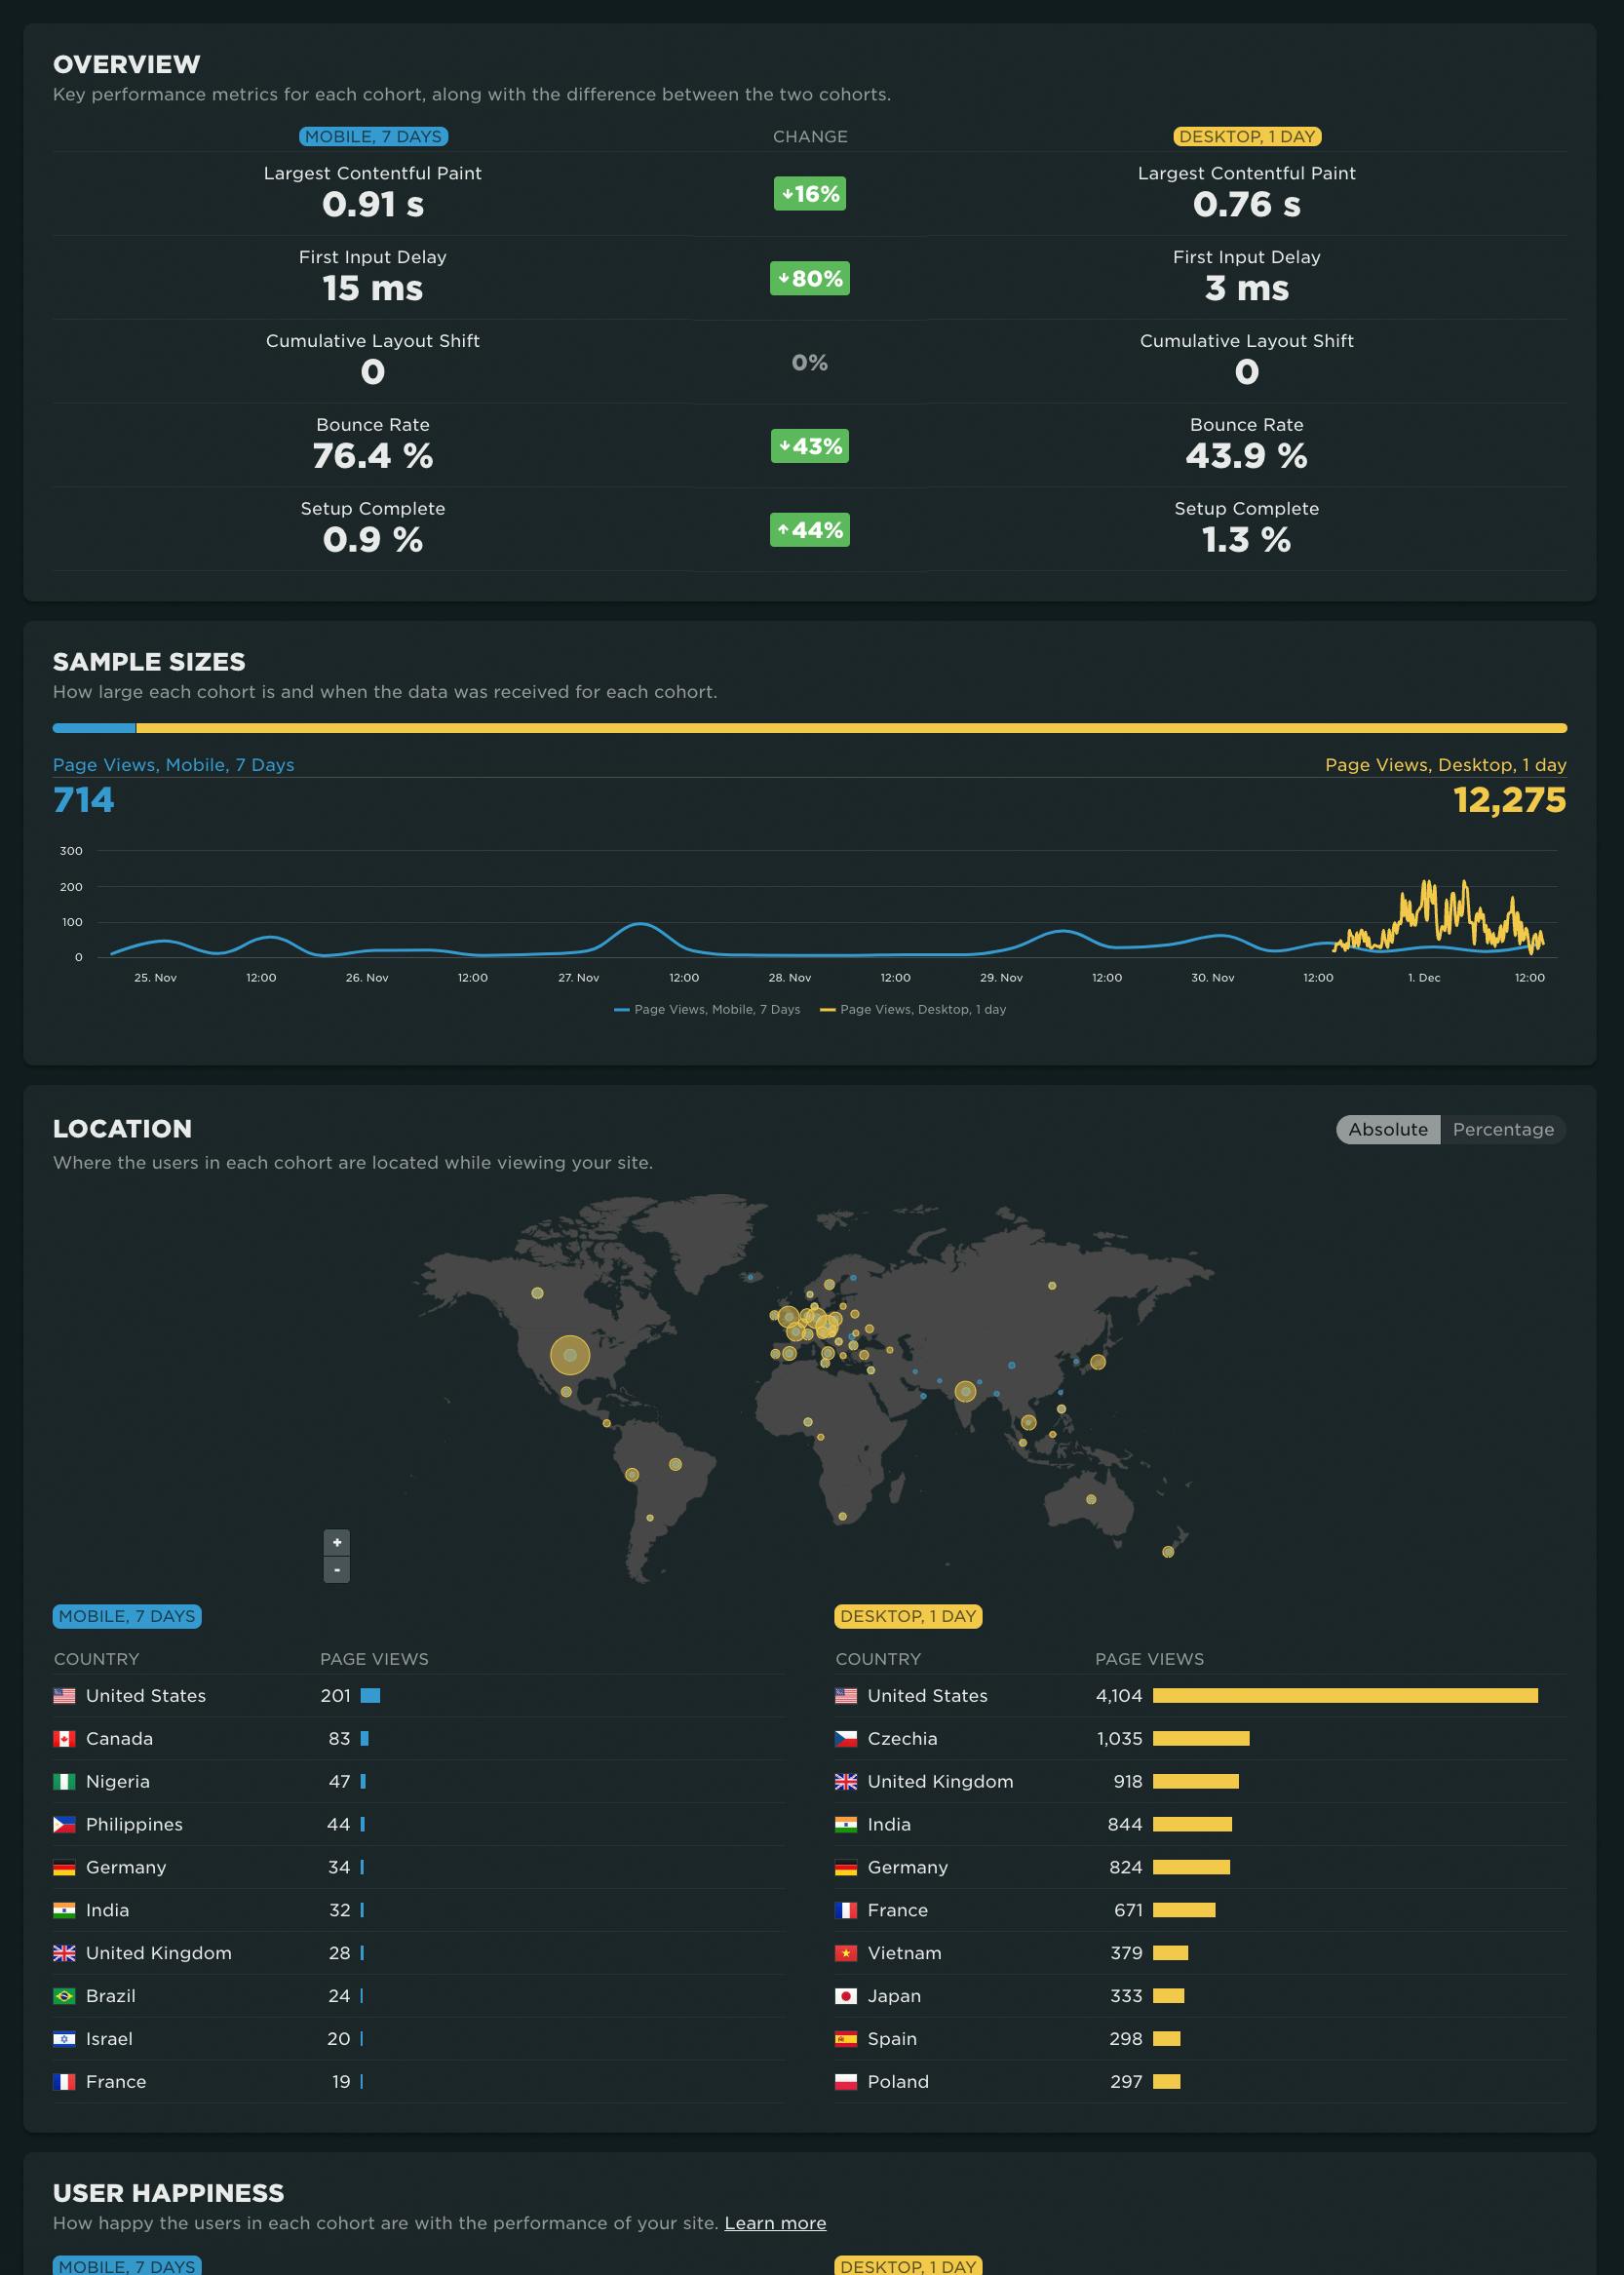
With your RUM Compare dashboard, you can easily generate side-by-side comparisons for any two cohorts of data. Some of the many reasons you might want to do this include:
- Improve Core Web Vitals by identifying the tradeoffs between pages that have different layout and construction
- Triage a performance regression related to the latest change or deployment to your site by looking at a before/after comparison
- Explore and compare different out-of-the-box cohorts, such as device types, geographies, page labels, and more
- Analyze A/B tests or experiments to understand which had the most impact on user behavior, as well as performance
- Optimize your funnel by understanding differences between users that convert or bounce from your site and users who don't
- Evaluate CDN performance by exploring the impact of time-of-day traffic patterns
Let's take a tour...
Page labels: Why they are important and how to use them
Labeling your pages in your synthetic and real user monitoring (RUM) tools is a crucial step in your performance monitoring setup. We recently released some exciting new capabilities for labeling your RUM pages that we want to share with you. This is also a great opportunity to reiterate why page labels are important, and to show you how easy it is to apply labels to your pages.
Why should I care about page labels?
There are so many benefits to labeling your pages in both your synthetic and real user monitoring (RUM) tools. Page labels give you the ability to:
- Compare and benchmark similar pages across different sites
- Create more meaningful performance budgets in RUM
- Correlate RUM data with synthetic diagnostics in the same charts (e.g., for Core Web Vitals that are measurable in synthetic and RUM)
- Prioritize performance optimizations according to their projected impact on real users
Ready to learn more? Let's get to it!
Element Timing: One true metric to rule them all?

One of the great things about Google's Core Web Vitals is that they provide a standard way to measure our visitors’ experience. Core Web Vitals can answer questions like:
- When was the largest element displayed? Largest Contentful Paint (LCP) measures when the largest visual element (image or video) finishes rendering.
- How much did the content move around as it loads? Cumulative Layout Shift (CLS) measures the visual stability of a page.
- How responsive was the page to visitors' actions? First Input Delay (FID) measures how quickly a page responds to a user interaction, such as a click/tap or keypress.
Sensible defaults, such as Core Web Vitals, are a good start, but one pitfall of standard measures is that they can miss what’s actually most important.
The (potential) problems with Largest Contentful Paint
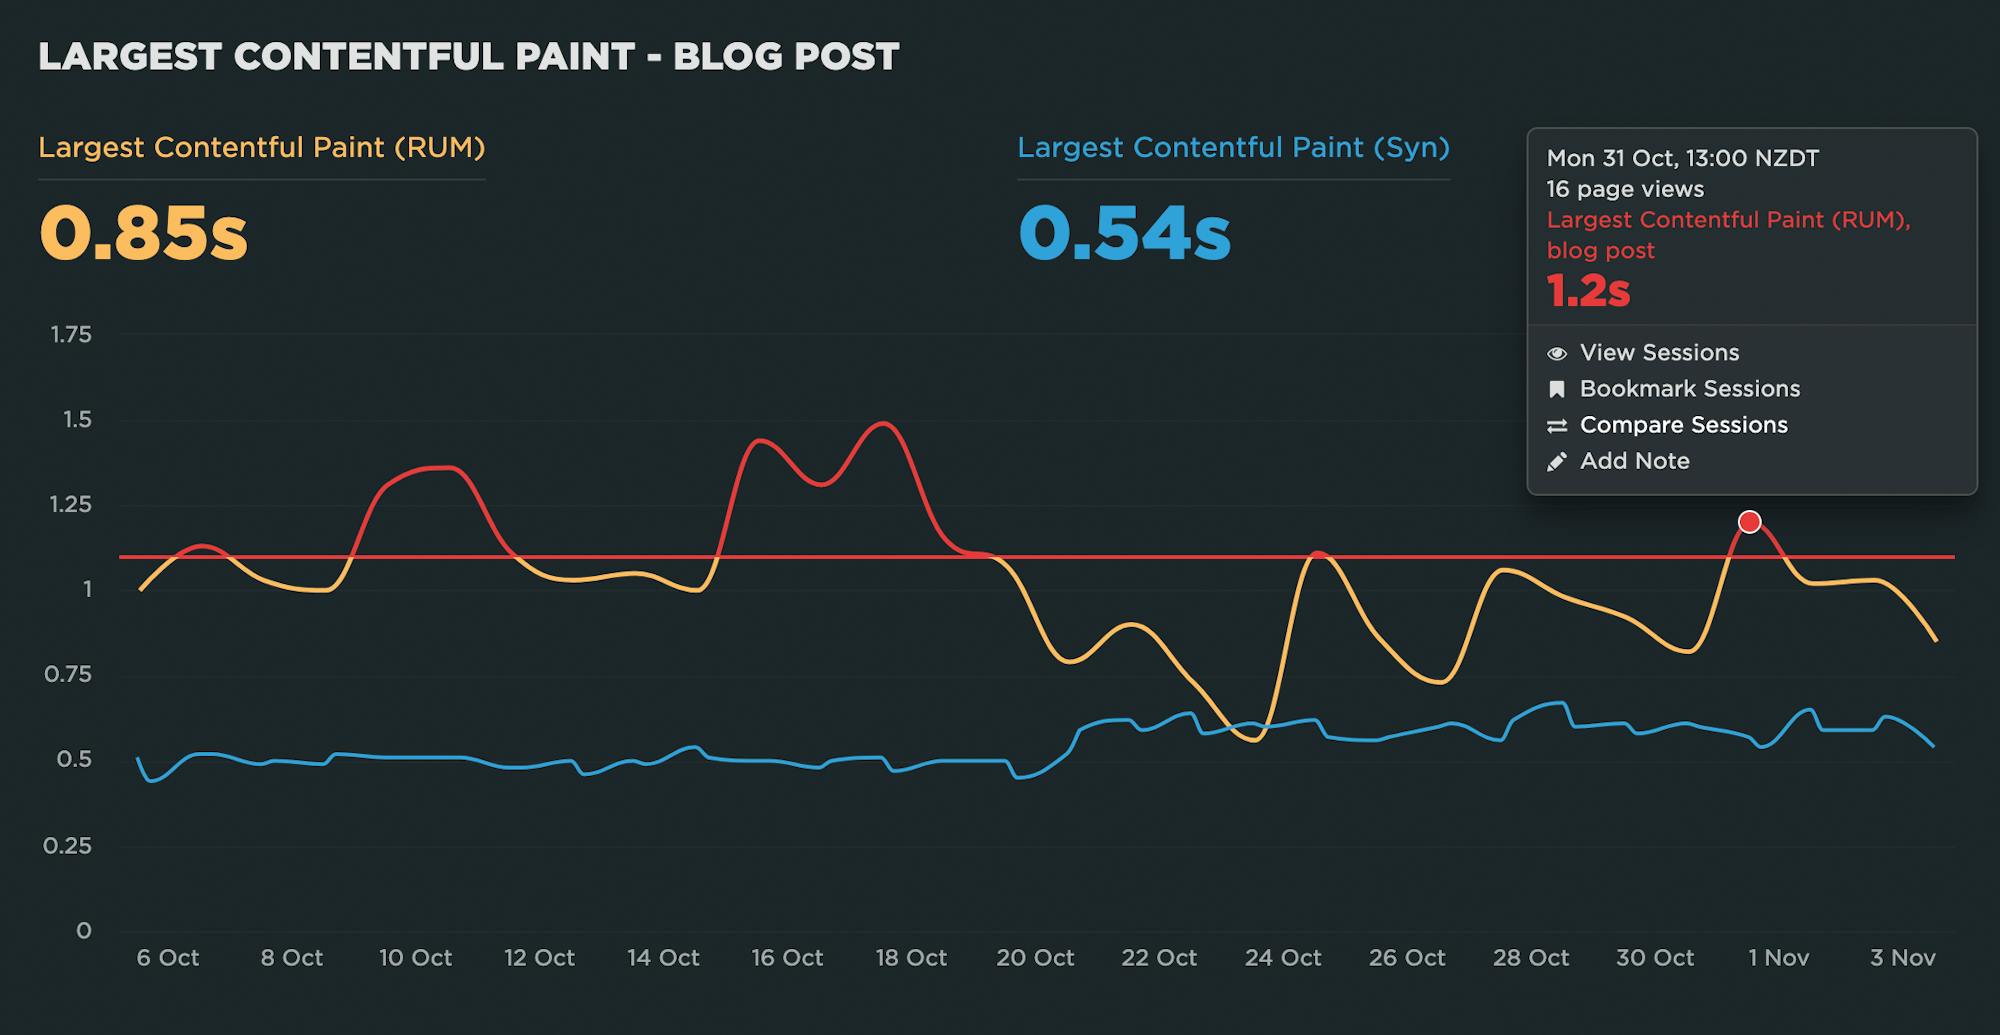
Largest Contentful Paint (LCP) makes the assumption that the largest visible element is the most important content from the visitors’ perspective; however, we don’t have a choice about which element it measures. LCP may not be measuring the most appropriate – or even the same – element for each page view.
The LCP element can vary for first-time vs repeat visitors
In the case of a first-time visitor, the largest element might be a consent banner. On subsequent visits to the same page, the largest element might be an image for a product or a photo that illustrates a news story.
The screenshots from What Hifi (a UK audio-visual magazine) illustrate this problem. When the consent banner is shown, then one of its paragraphs is the LCP element. When the consent banner is not shown, an article title becomes the LCP element. In other words, the LCP timestamp varies depending on which of these two experiences the visitor had!
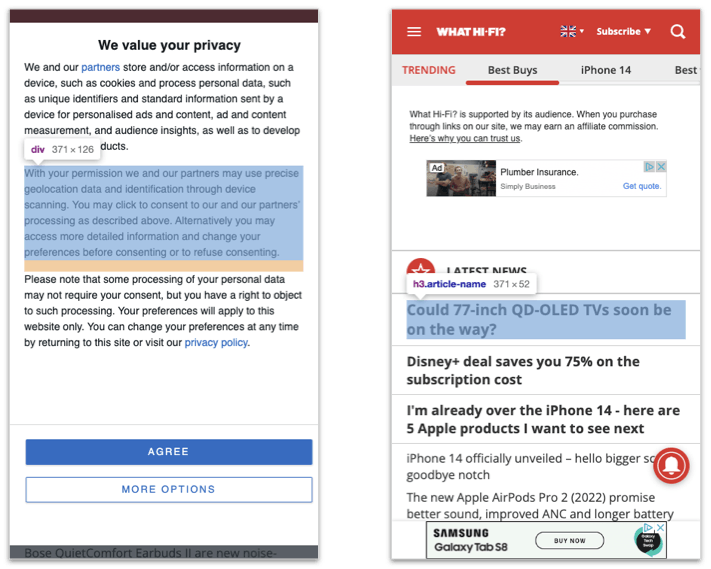 What Hi Fi with and without the consent banner visible
July 2022 product update: Web Vitals support, more synthetic test agents & performance heat maps


It's been another busy month here at SpeedCurve! Check out our latest product updates below.
June 2022 product update: Performance recommendations on Vitals dashboard, RUM path filters & more

We've been busy here at SpeedCurve HQ! Here's a roundup of our recent product updates.
Sampling RUM: A closer look
Being able to set a sample rate in your real user monitoring (RUM) tool allows you to monitor your pages while managing your spending. It's a great option if staying within a budget is important to you. With the ability to sample real user data, comes this question...
"What should my RUM sample rate be?"
This frequently asked question doesn't have a simple answer. Refining your sample rate can be hit or miss if you aren’t careful. In a previous post, I discussed a few considerations when determining how much RUM data you really need to make informed decisions. If you sample too much, you may be collecting a lot of data you may never use. On the other hand, if you sample too little, you risk creating variability in your data that is hard to trust.
In this post, we are going to do a bit of research and let the data speak for itself. I took a look at the impact of sampling at various levels for three t-shirt sized companies (Small, Medium, Large) with the hope of providing some guidance for those of you considering sampling your RUM data.
In this post, I'll cover:
- Methodology
- Key findings
- Considerations
- Recommendations
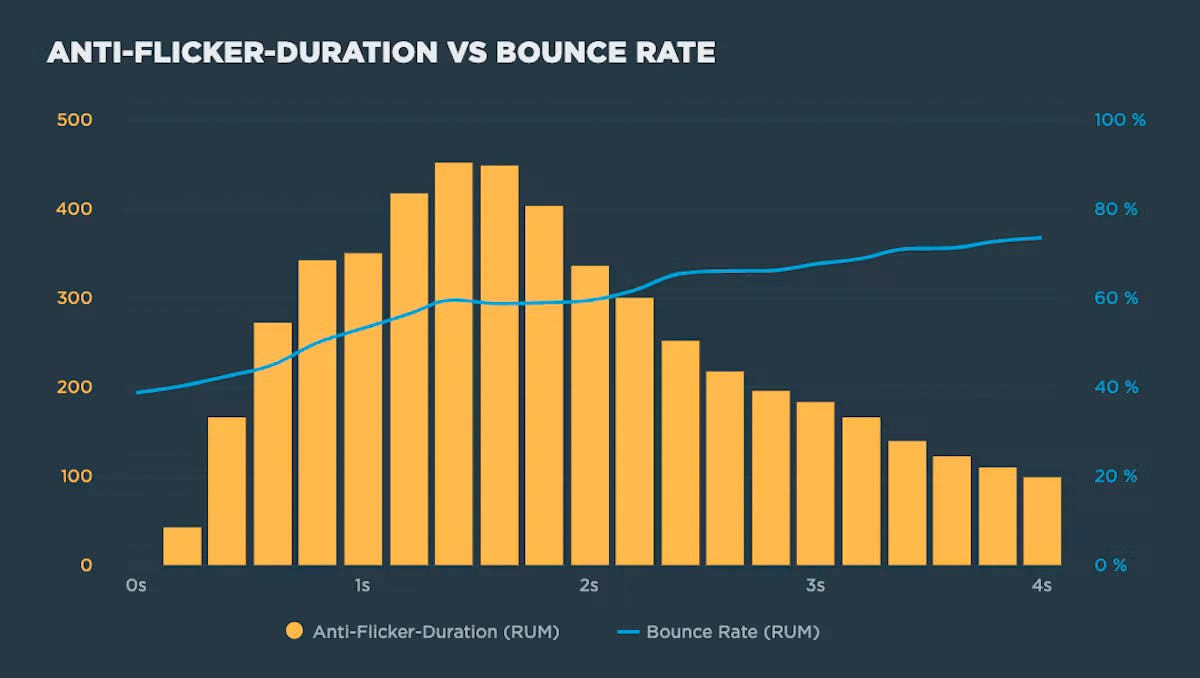
Understanding the performance impact of anti-flicker snippets
Experimentation tools that use asynchronous scripts – such as Google Optimize, Adobe Target, and Visual Web Optimizer – recommend using an anti-flicker snippet to hide the page until they've finished executing. But this practice comes with some performance measurement pitfalls:
- Hiding the contents of the page can have a dramatic effect on the Web Vitals that measure visual experience, such as First Contentful Paint (FCP) and Largest Contentful Paint (LCP)
- Anti-flicker snippets can also affect Cumulative Layout Shift (CLS) and the synthetic equivalent of First Input Delay (FID), Total Blocking Time (TBT).
In this post we'll look at how anti-flicker snippets work, their impact on Web Vitals, and how to measure the delay they add to visitors' experience.
Industry page speed benchmarks (March 2022)
Page Speed Benchmarks is an interactive dashboard that lets you explore and compare web performance data for leading websites across several industries – from retail to media – over the past year. This dashboard is publicly available (meaning you don't need a SpeedCurve account to explore it) and is a treasure trove of meaningful data that you can use for your own research.
The dashboard allows you to easily filter by region, industry, mobile/desktop, fast/slow, and key web performance metrics, including Google's Core Web Vitals. (Scroll down to the bottom of this post for more testing details.)
At the time of writing this post, these were the home pages with the fastest Start Render times in key industries:
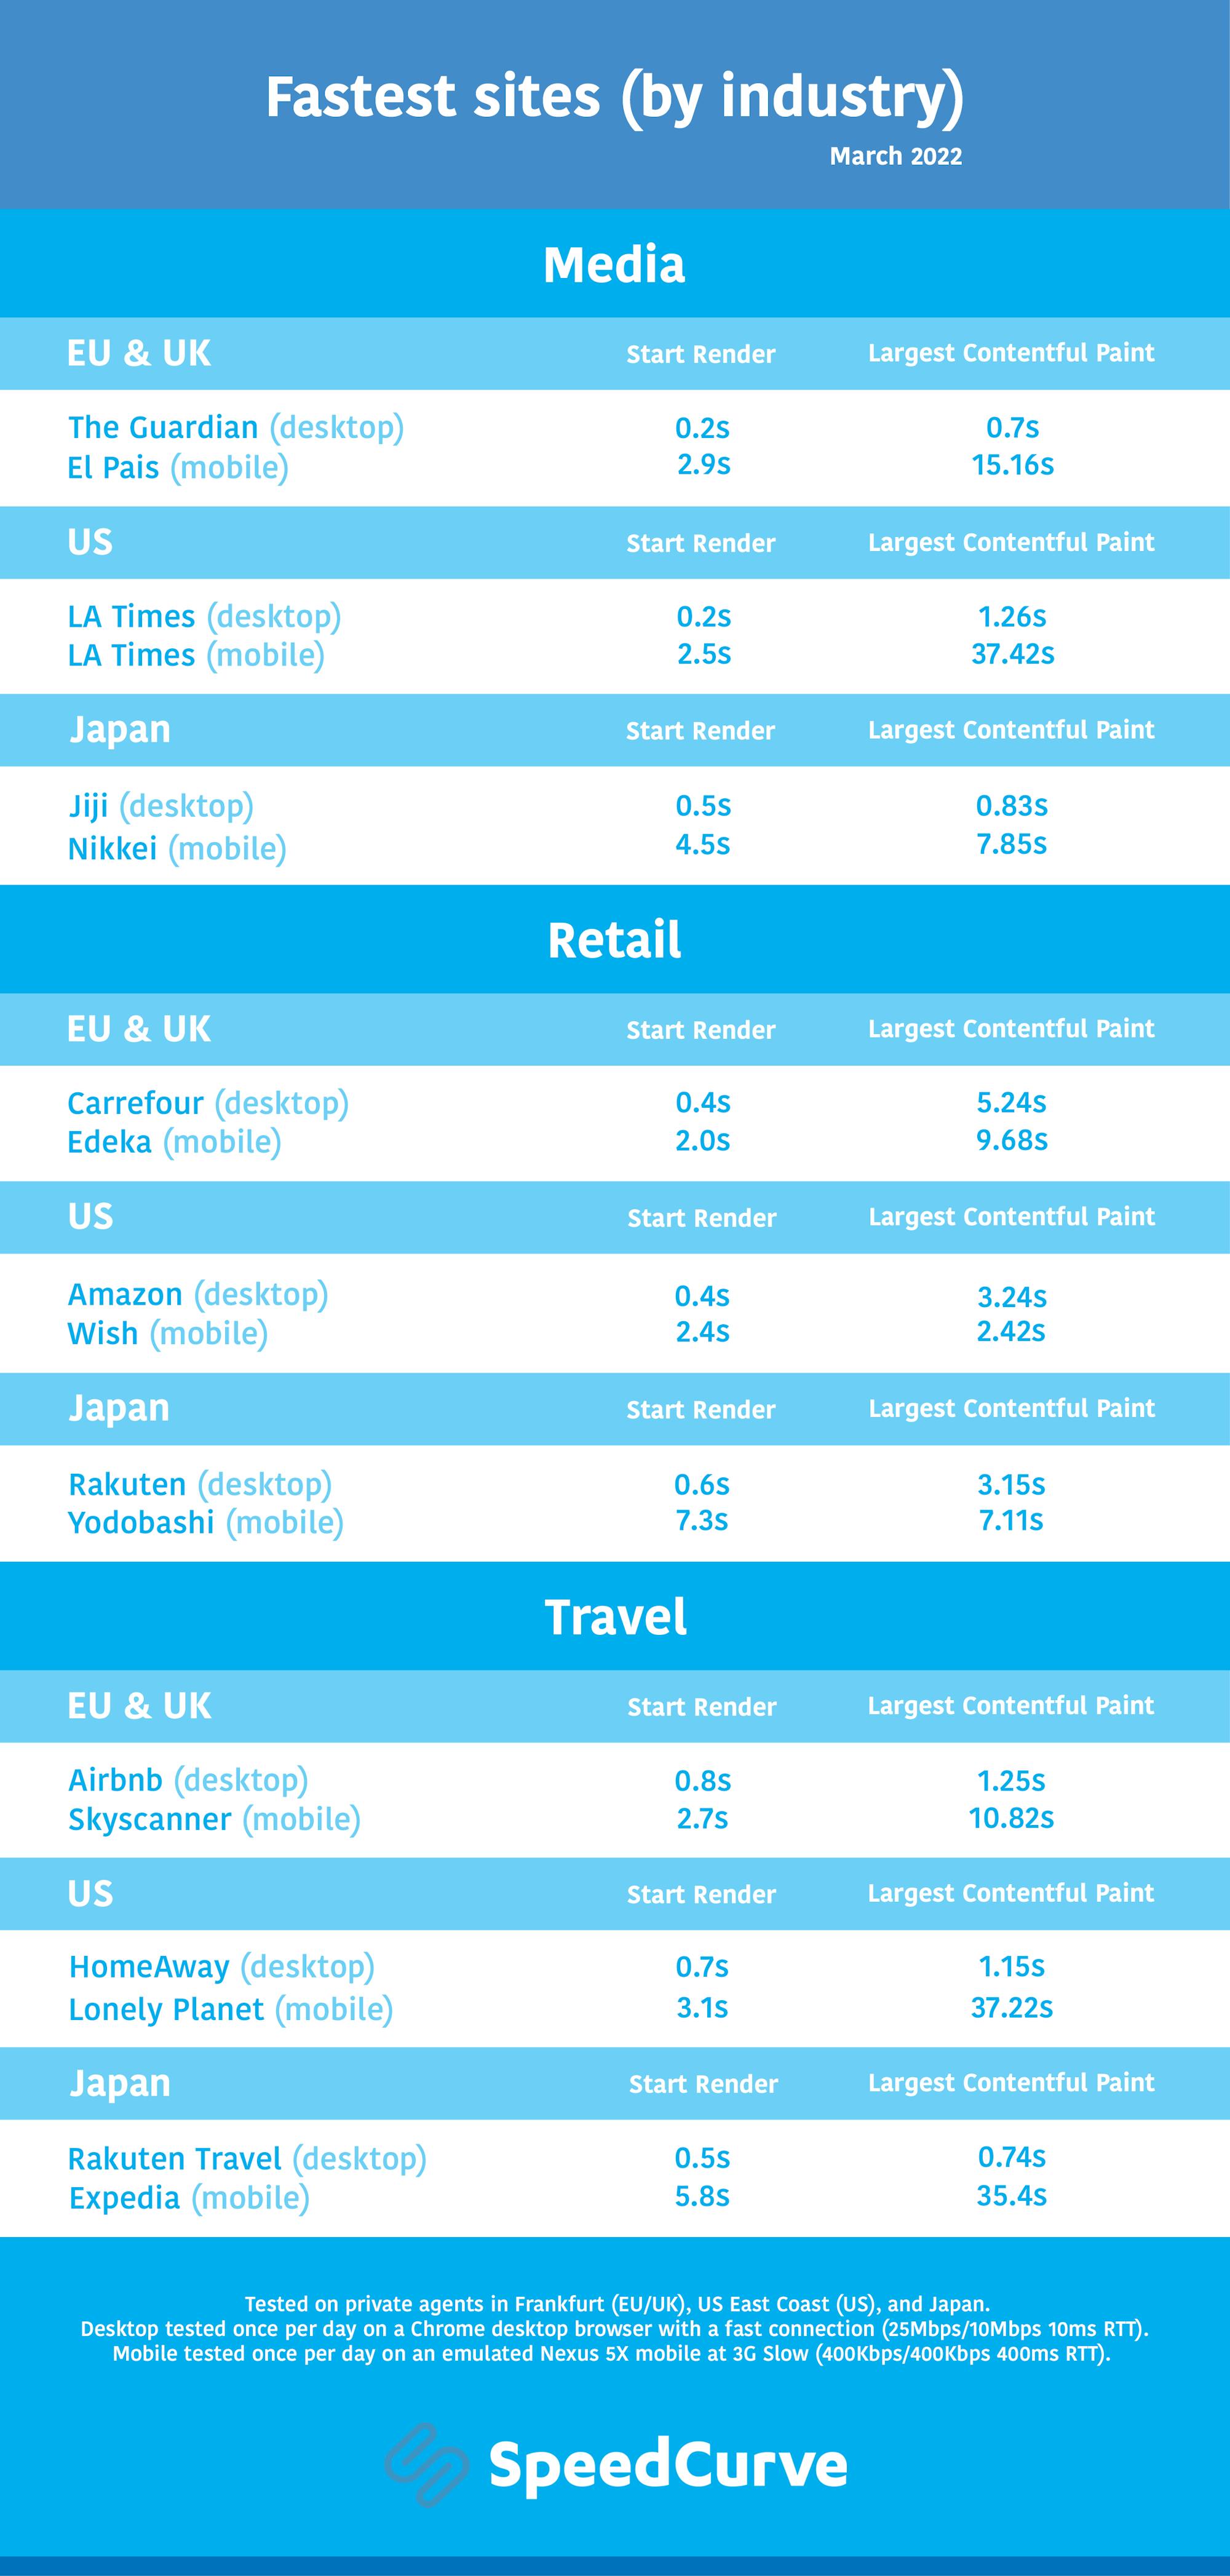
As you can see, I've included Largest Contentful Paint alongside Start Render in this chart, for reasons I explain below.
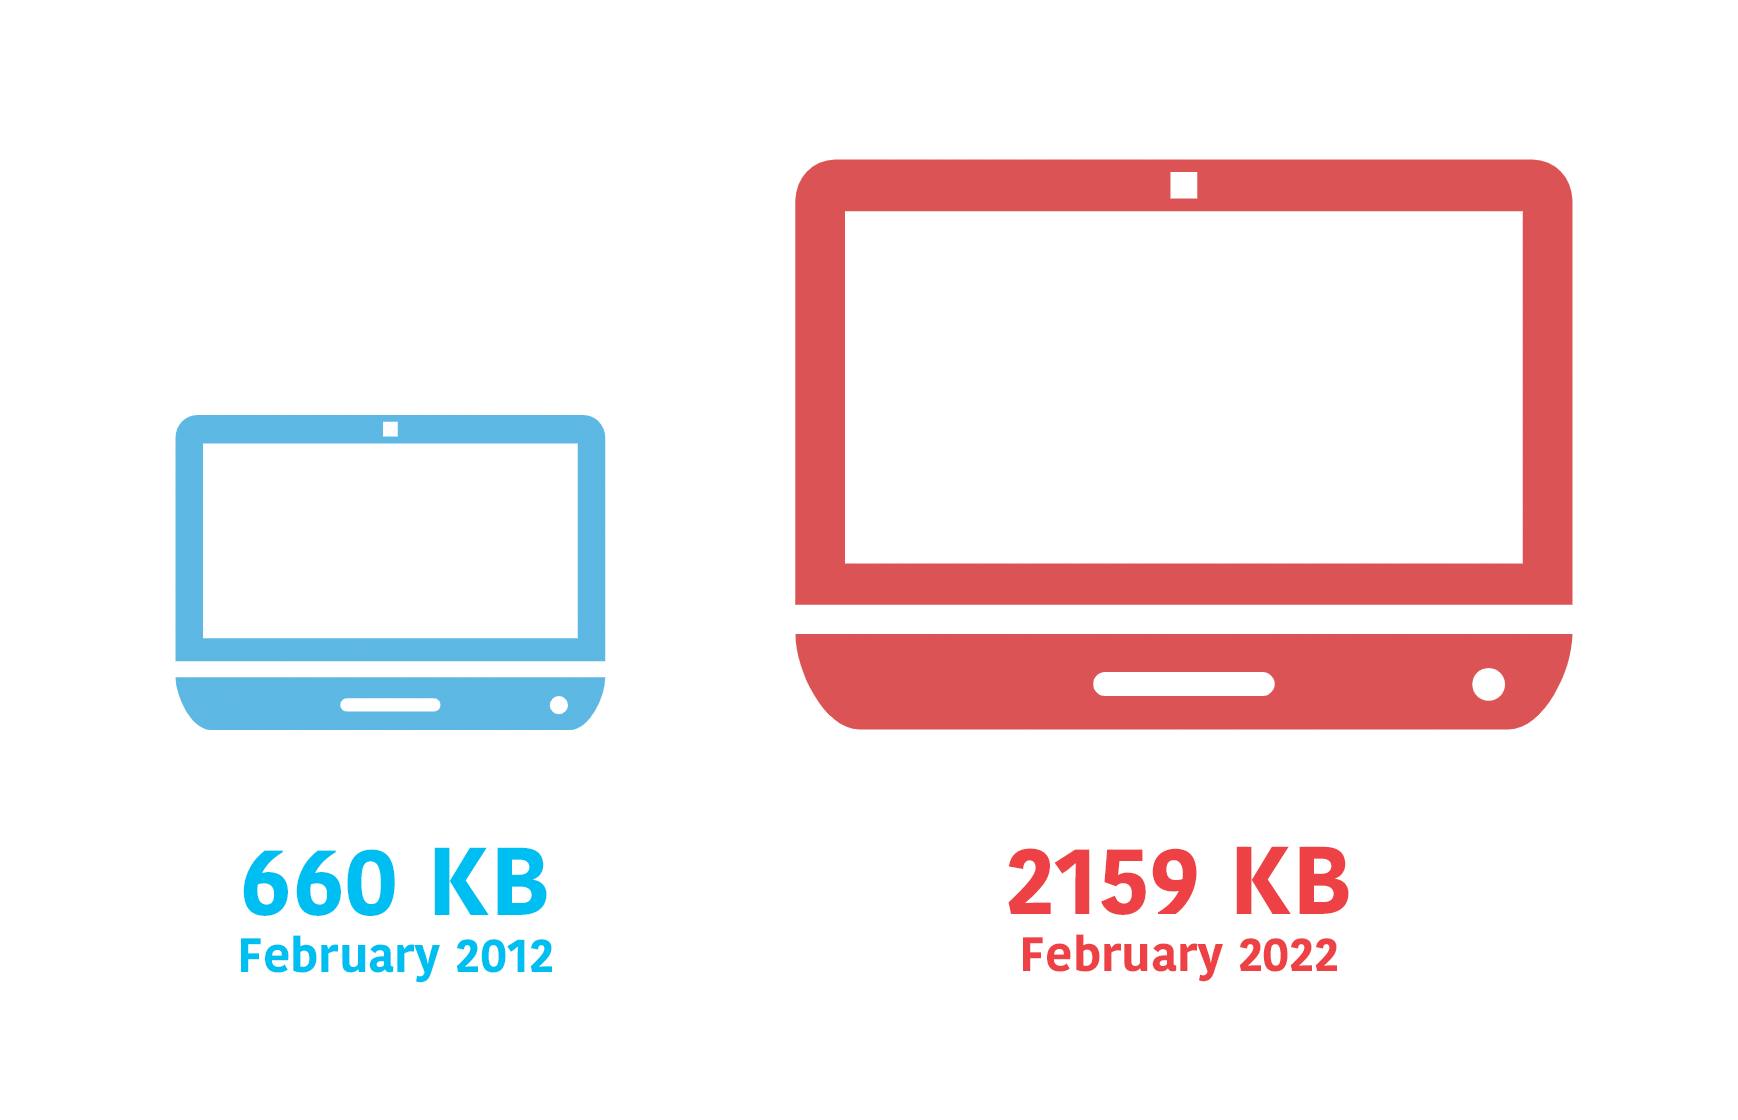
Ten years of page bloat: What have we learned?
(See our more recent page growth post: What is page bloat? And how is it hurting your business, search rank, and users?)
I've been writing about page size and complexity for years. If you've been working in the performance space for a while and you hear me start to talk about page growth, I'd forgive you if you started running away. ;)
But pages keep getting bigger and more complex year over year – and this increasing size and complexity is not fully mitigated by faster devices and networks, or by our hard-working browsers. Clearly we need to keep talking about it. We need to understand how ever-growing pages work against us. And we need to have strategies in place to understand and manage our pages.
In this post, we'll cover:
- How big are pages today versus ten years ago?
- How does page bloat hurt your business?
- How does page bloat affect other metrics, such as Google's Core Web Vitals?
- Is it possible to have large pages that deliver a good user experience?
- What can we do to manage our pages and fight regression?
NEW: RUM Live and Page Views dashboards
Shortly before the end of the year, we snuck in a couple of last-minute gifts for 2021. It was a great year for SpeedCurve with a lot of renewed focus on RUM. We couldn't think of a better way to finish out the year than to launch the new Live and Page Views dashboards. Let's take a look!